Ximenes2004
Data contributor: Fabiano de Aquino Ximenes
Email: [email protected]
Address:
- NSW Department of Primary Industries, West Pennant Hills, NSW, Australia
Citation: Ximenes F, Gardner W and Marchant J (2004). 'Total biomass measurement and recovery of biomass in log products in spotted gum (Corymbia maculata) forests of SE NSW.' National Carbon Accounting System Technical Report, 47, pp. 1-92.
DOI:
Abstract:
The dataset includes records for 504 individuals from 7 species belonging to 2 family(ies), presenting 1 functional type(s), growing in 1 condition(s) within 1 major type(s) of habitat, with data included for the following variables:
| Variable | Label | Units | N | Min | Median | Max |
|---|---|---|---|---|---|---|
| latitude | Latitude | deg | 504 | -36 | -35 | -35 |
| longitude | Longitude | deg | 504 | 150 | 150 | 150 |
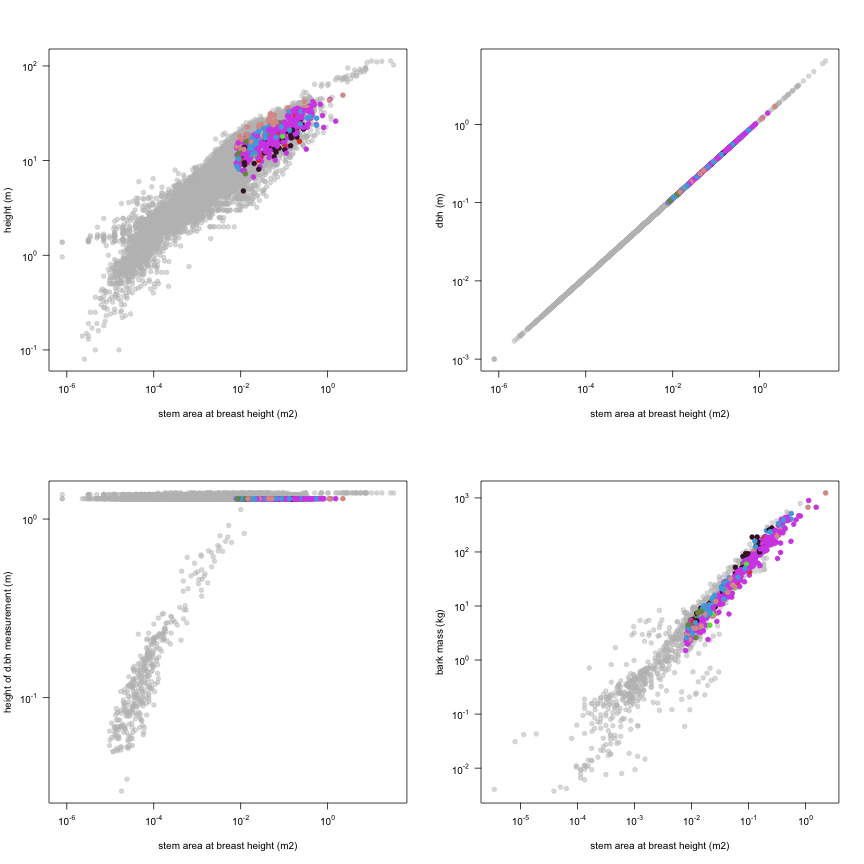
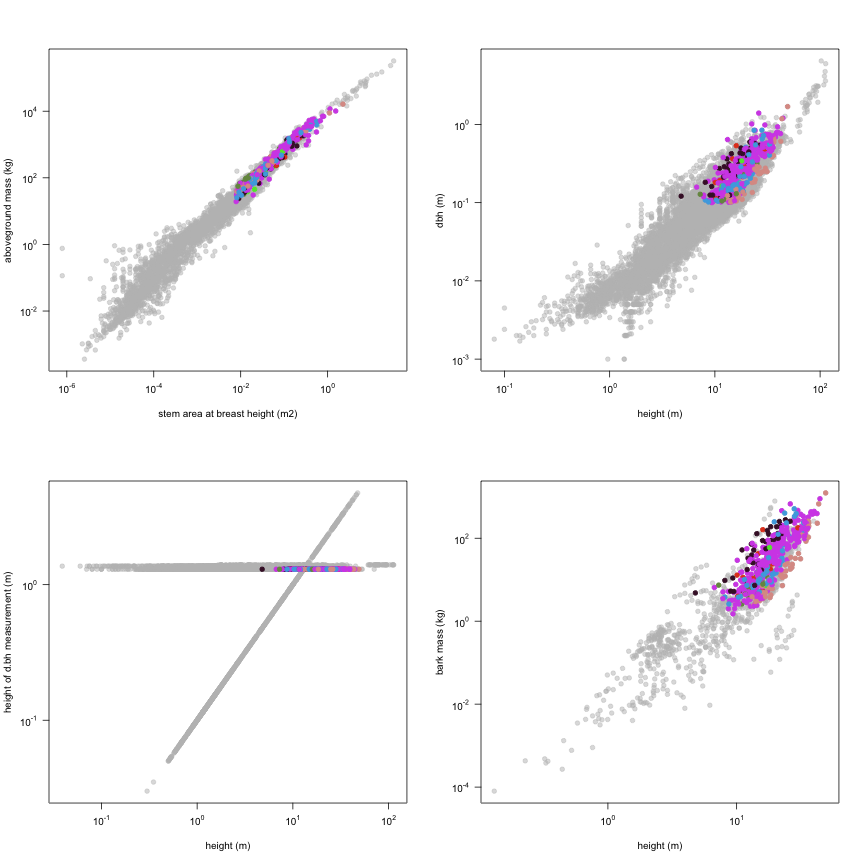
| a.stbh | Stem area at breast height | m2 | 504 | 0.0079 | 0.047 | 2.2 |
| h.t | Height | m | 472 | 4.8 | 18 | 49 |
| d.bh | Dbh | m | 504 | 0.1 | 0.24 | 1.7 |
| h.bh | Height of d.bh measurement | m | 504 | 1.3 | 1.3 | 1.3 |
| m.sb | Bark mass | kg | 504 | 1.5 | 24 | 1236 |
| m.so | Aboveground mass | kg | 504 | 19 | 302 | 16320 |
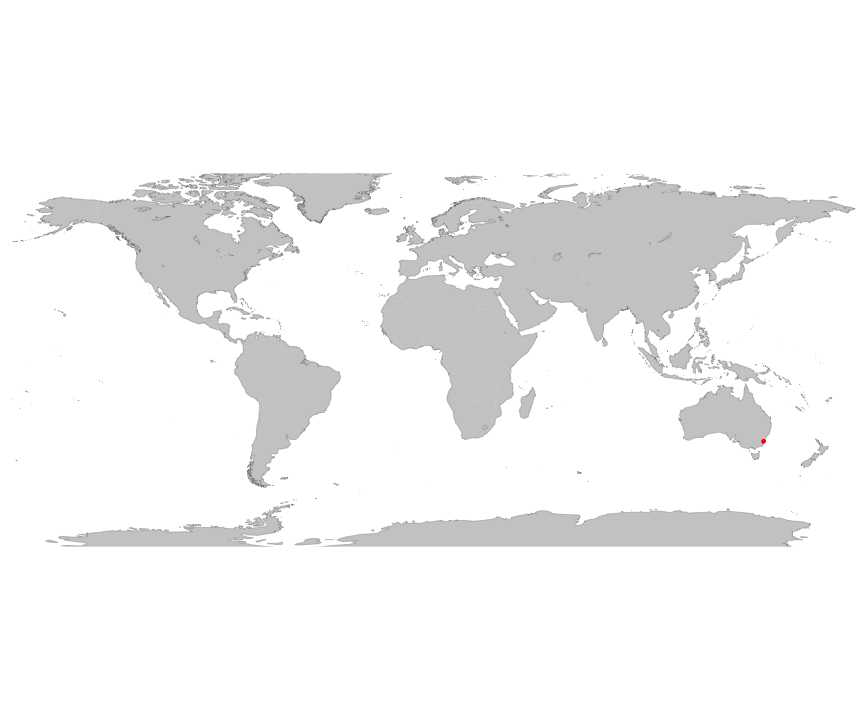
And locally within the country:

The sites sampled are:
| Location | Longitude | Latitude | Vegetation |
|---|---|---|---|
| Clyde State Forest | 150.2000 | -35.45000 | Temperate forest |
| Flat Rock State Forest | 150.3000 | -35.41667 | Temperate forest |
| Mogo State Forest | 150.0667 | -35.73333 | Temperate forest |
The growing conditions of sampled plants was:
| Location | growingCondition |
|---|---|
| Clyde State Forest | field wild |
| Flat Rock State Forest | field wild |
| Mogo State Forest | field wild |
| Species | Family | Pft |
|---|---|---|
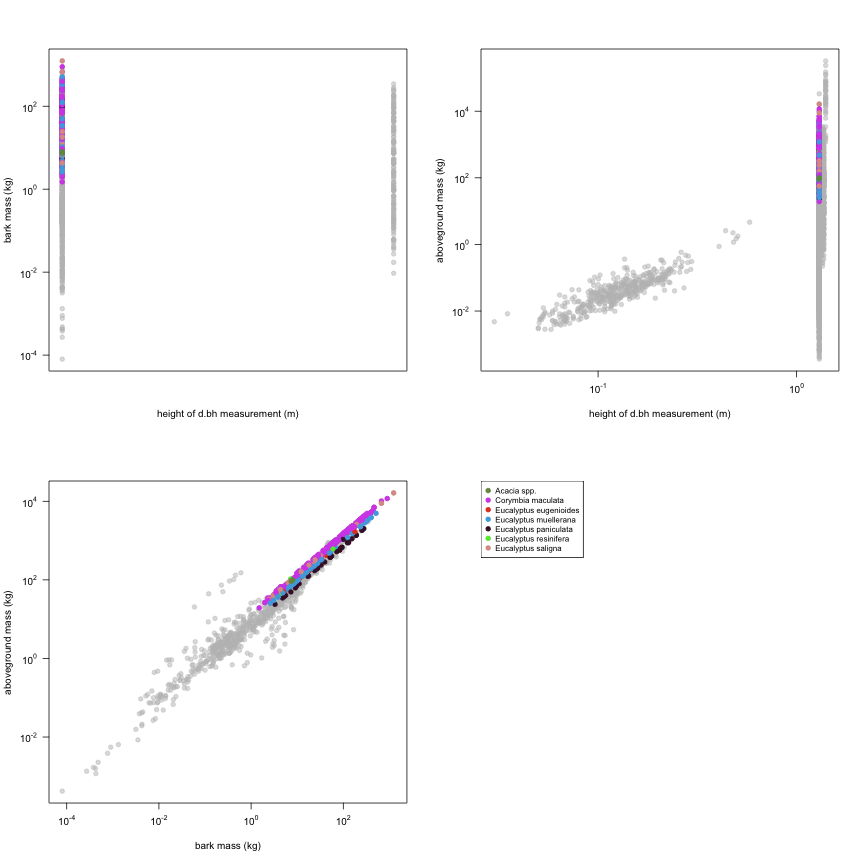
| Corymbia maculata | Myrtaceae | evergreen angiosperm |
| Acacia spp. | Fabaceae | evergreen angiosperm |
| Eucalyptus saligna | Myrtaceae | evergreen angiosperm |
| Eucalyptus muellerana | Myrtaceae | evergreen angiosperm |
| Eucalyptus eugenioides | Myrtaceae | evergreen angiosperm |
| Eucalyptus paniculata | Myrtaceae | evergreen angiosperm |
| Eucalyptus resinifera | Myrtaceae | evergreen angiosperm |
Sampling strategy: At the establishment of the plots all trees above 10 cm DBH (including dead trees) were numbered, identified and their DBH measured. The tree was harvested using a chainsaw. The stumps were numbered with the corresponding tree number and the height of each stump was measured. Most of the trees were snigged to the logging dump by a skidder or excavator; large trees had their crown component cut in the forest and each component snigged to the logging dump separately. A visual assessment was made to estimate any losses (crown, branches and bark) that may have occurred due to transport of the trees from the forest to the logging dump and their handling. The length, and butt, top and centre diameters of each log were measured. Samples were cut from the log products, crown and bark for laboratory analysis (moisture content, density and sapwood content).
Biomass: Trees weighing less than five tonnes were weighed as a whole. Trees heavier than five tonnes required further cutting before their weight was determined. The commercial log(s) was debarked, graded and weighed. The biomass was weighed on weigh bars mounted on top of a trailer especially designed and built for the CRCGA research. An excavator was used to lift the biomass components onto the trailer. The trailer is equipped with a heavy upper frame and each corner is supported by a two-speed drop leg. The nominal dimensions of the trailer are: length load space: 2.5 m; length overall: 4.1m; width load space: 1.8 m; width overall: 1.8m. Both weigh bars are equipped with two load cells with a combined capacity of 5 tonnes. Weight increments of 0.2 kg are displayed on a digital display. The weight of stumps was determined by multiplying their volume by the green density of the 'butt' section of the respective tree. The volume of the stumps was determined assuming, for practical reasons, they approached the form of the cylinder (Husch et al 1972). The weight of trees that had a component of bark, crown or branches missing was adjusted based on a visual assessment of the loss.
Growth environment: Field, wild.
Year collected: 2003
This is how the study Ximenes2004 fits in the entire dataset (grey). each colour represents a species. A legend of species names with colours is included at the end for reports with 1 < n < 20 species.