Morisawa1957
Data contributor: Masae I. Ishihara, Hajime Utsugi, Hiroyuki Tanouchi, Tsutom Hiura
Email: [email protected]
Address:
- Graduate School for International Development and Cooperation, Hiroshima University, 1-5-1 Kagamiyama, Higashi-Hiroshima 739-8529, Japan
- Forestry and Forest Products Research Institute (FFPRI), 1 Matsunosato, Tsukuba, Ibaraki, 305-8687, Japan
- Hokkaido Research Center, Forestry and Forest Products Research Institute (FFPRI), Hitsujigaoka-7, Toyohira, Sapporo, Hokkaido, 062-8516, Japan
- Tomakomai Research Station, Field Science Center for Northern Biosphere, Hokkaido University, Takaoka, Tomakomai 053-0035, Japan
Citation: Morisawa M and Taira K (1957). 'Leaf biomass of Fagus crenata in Gumma Prefecture.' Bulletin of the Forestry and Forest Products Research Institute, 95, pp. 121-127.
DOI:
Abstract:
The dataset includes records for 21 individuals from 1 species belonging to 1 family(ies), presenting 1 functional type(s), growing in 1 condition(s) within 1 major type(s) of habitat, with data included for the following variables:
| Variable | Label | Units | N | Min | Median | Max |
|---|---|---|---|---|---|---|
| latitude | Latitude | deg | 21 | 37 | 37 | 37 |
| longitude | Longitude | deg | 21 | 139 | 139 | 139 |
| a.lf | Leaf area | m2 | 21 | 2.1 | 132 | 1319 |
| a.stbh | Stem area at breast height | m2 | 21 | 0.00049 | 0.031 | 0.45 |
| a.cp | Crown area | m2 | 21 | 3.6 | 55 | 245 |
| h.t | Height | m | 21 | 3.1 | 19 | 31 |
| h.c | Height to crown base | m | 21 | 0.5 | 5.1 | 12 |
| d.bh | Dbh | m | 21 | 0.025 | 0.2 | 0.76 |
| h.bh | Height of d.bh measurement | m | 21 | 1.3 | 1.3 | 1.3 |
| d.cr | Crown width | m | 21 | 2.1 | 8.4 | 18 |
| c.d | Crown depth | m | 21 | 2.6 | 12 | 25 |
| m.lf | Leaf mass | kg | 21 | 0.1 | 6.2 | 63 |

And locally within the country:
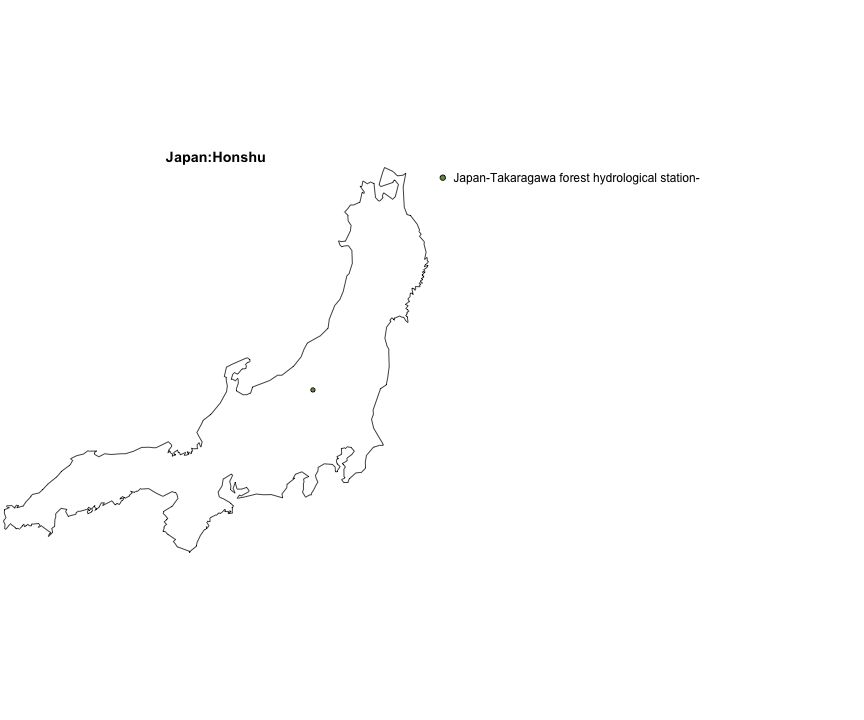
The sites sampled are:
| Location | Longitude | Latitude | Vegetation |
|---|---|---|---|
| Japan-Takaragawa forest hydrological station- | 139.02 | 36.85 | Temperate forest |
The growing conditions of sampled plants was:
| Location | growingCondition |
|---|---|
| Japan-Takaragawa forest hydrological station- | field wild |
| Species | Family | Pft |
|---|---|---|
| Fagus crenata | Fagaceae | deciduous angiosperm |
Sampling strategy: Sampling was conducted in a natural forest that had experienced selective cutting at Takaragawa forest hydrological station, Gumma prefecture, Japan during the end of July to early August of 1954 and 1955. Trees were selected from each diameter class. Trees were cut down at the ground level and all leaves were detached.
Leaf area: Leaf area was estimated from dry mass of leaves and the average ratio of leaf area to leaf dry mass reported in Morisawa and Taira (1957). The ratio was obtained from 10 leaves randomly selected from each of 13 sampled trees. Ten leaves were traced on a paper and then the area was obtained by planimeter.
Stem cross sectional area: Estimated from stem diameter.
Height: Measured by measuring tape.
Crown area: Crown area was estimated from a crown projection map.
Biomass: Fresh mass of leaves were measured for each tree. The dry to fresh mass ratio was obtained for each of 13 sampled tree from subsamples. Ten randomly-selected subsample leaves were weighted for the fresh mass and oven-dried for 70 degreeC until the mass became constant. The average ratio of 13 trees (0.463) reported in Morisawa and Taira (1957) was used to convert fresh mass to dry mass by M.I. Ishihara.
Other variables: M.I. Ishihara, H. Utsugi, H. Tanouchi, and T. Hiura conducted formal search of reference databases and digitized raw data from Morisawa and Taira (1957). Meta data was also created by M.I. Ishihara based on Morisawa and Taira (1957). Species name and family names were converted by M.I. Ishihara according to the following references: Satake Y, Hara H (1989a) Wild flower of Japan Woody plants I (in Japanese). Heibonsha, Tokyo; Satake Y, Hara H (1989b) Wild flower of Japan Woody plants II (in Japanese). Heibonsha, Tokyo.
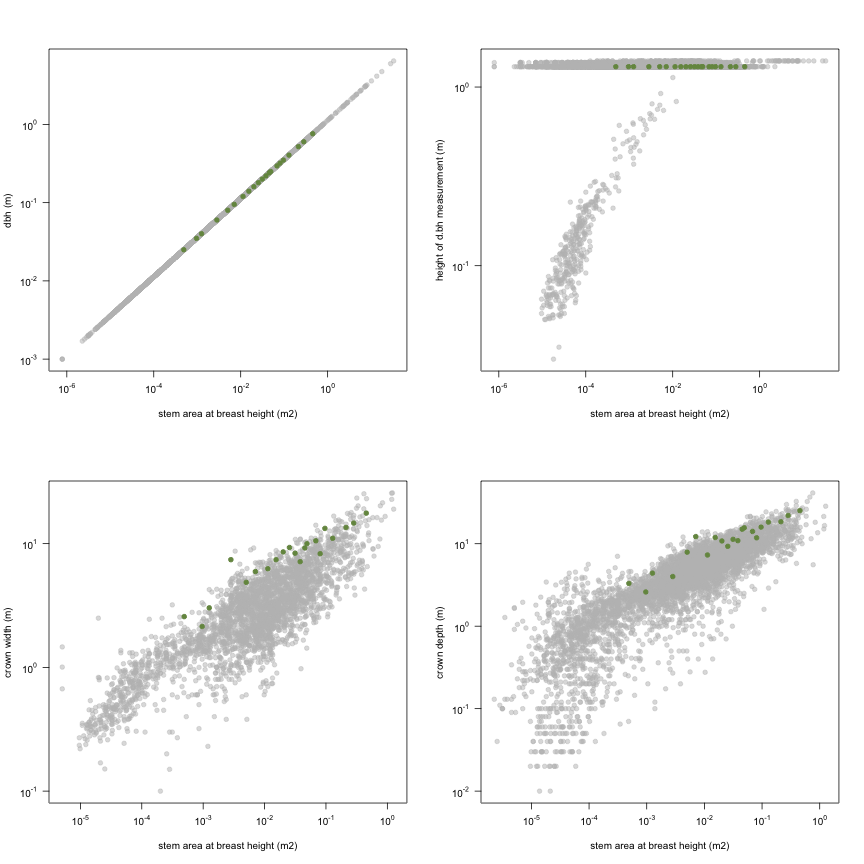
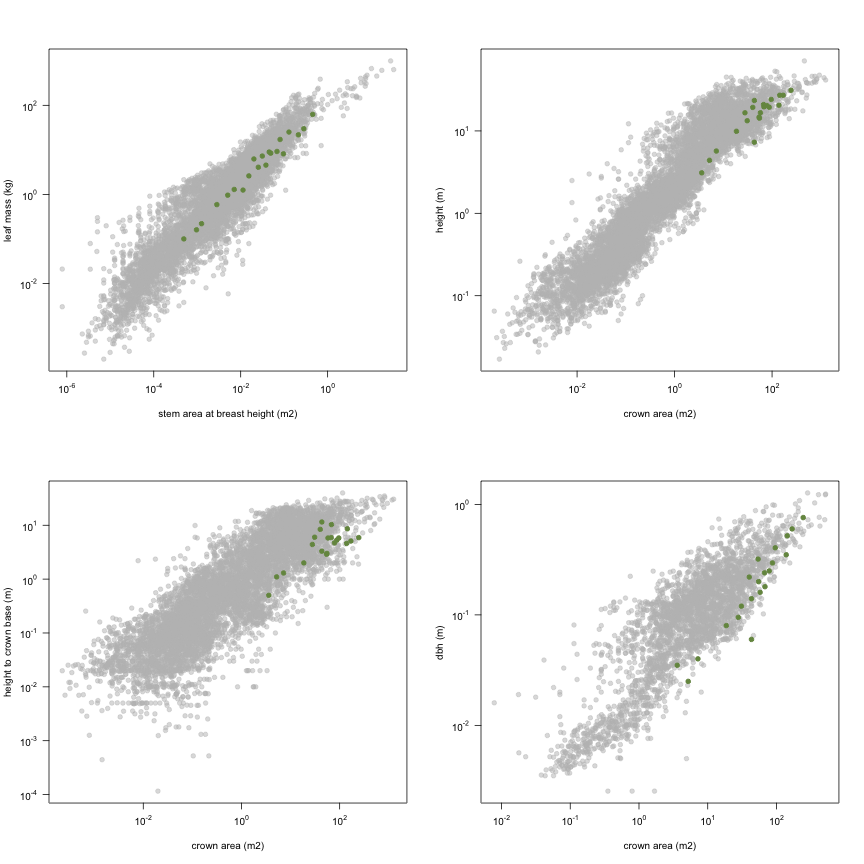
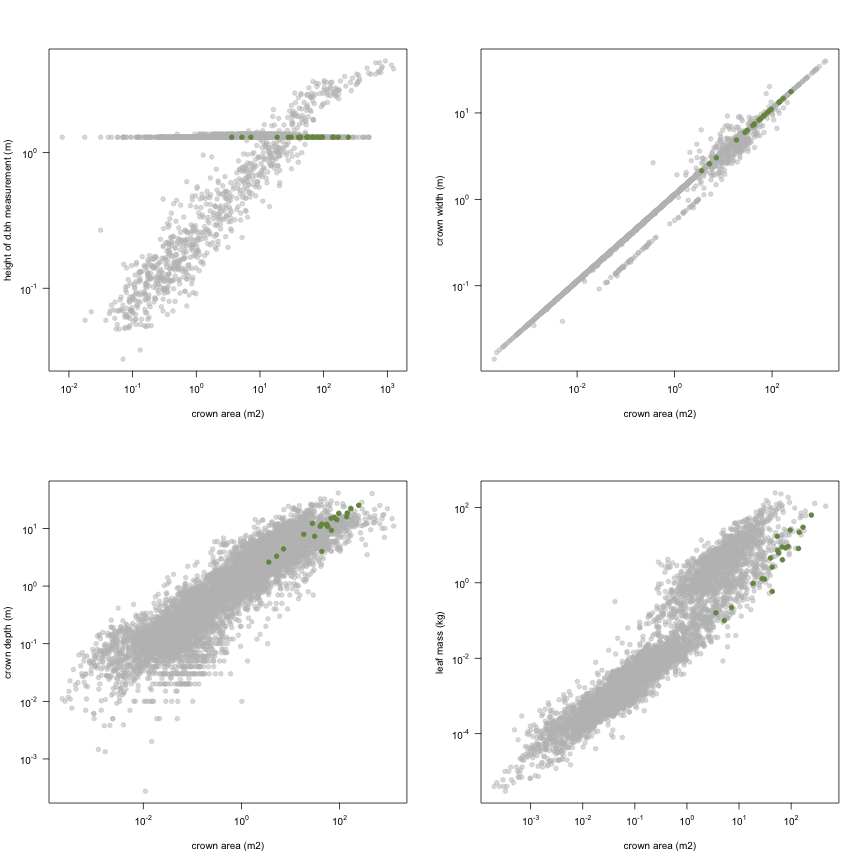
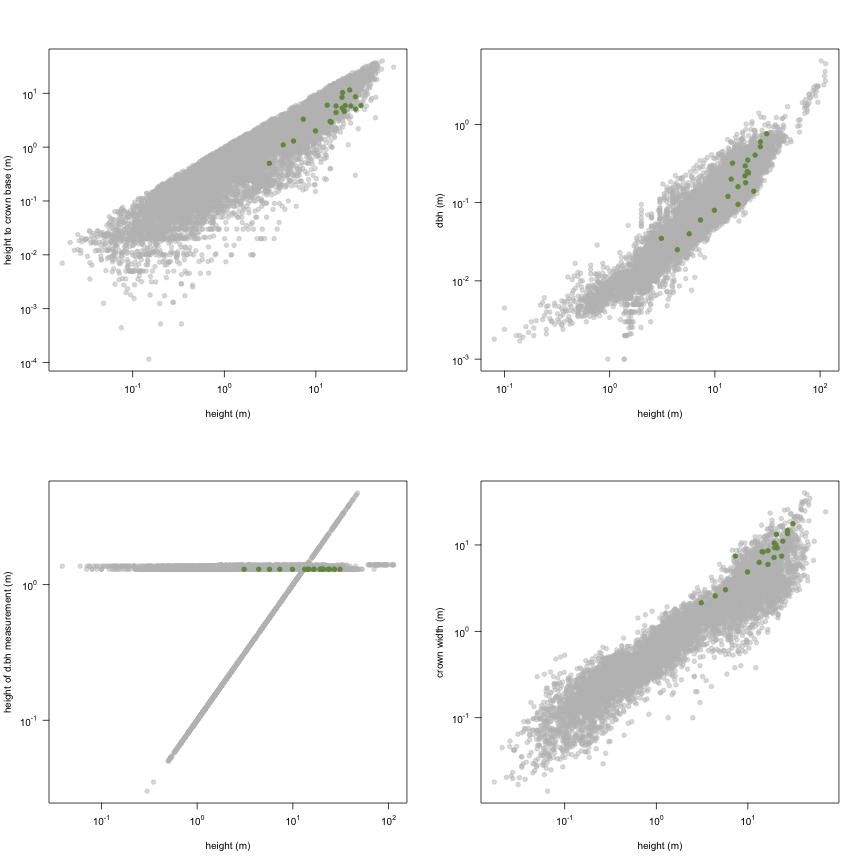
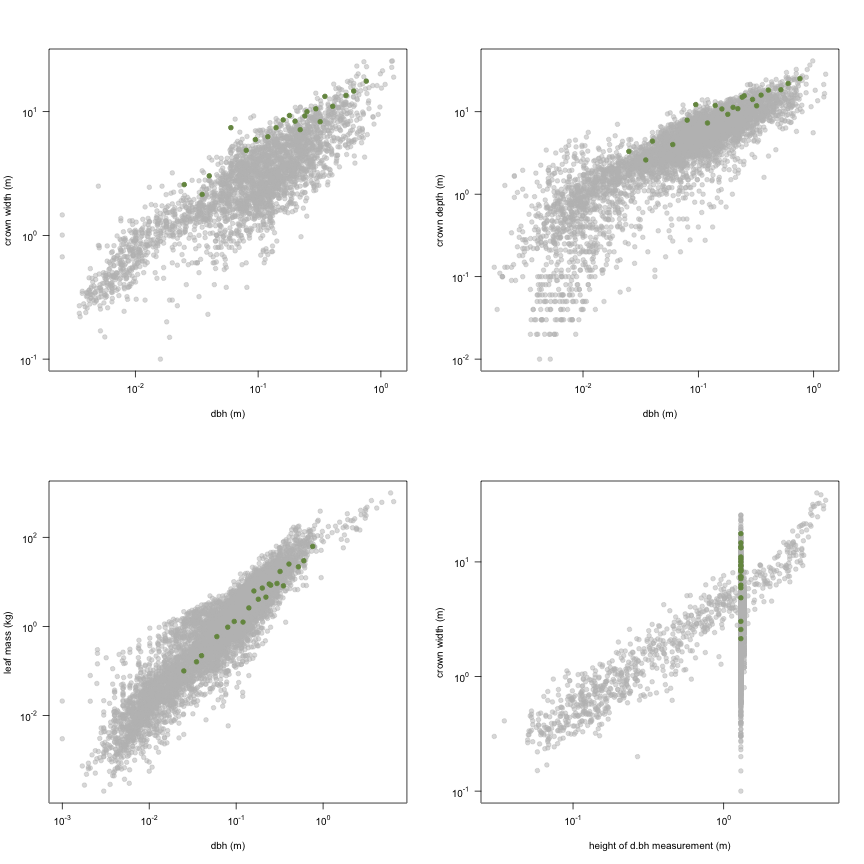
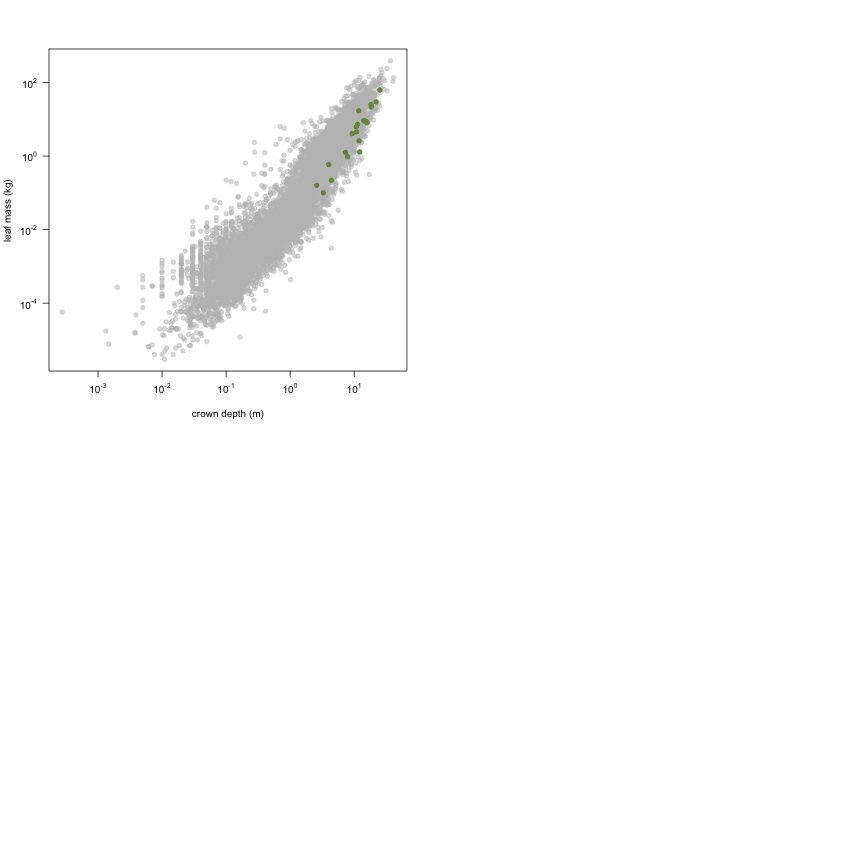
This is how the study Morisawa1957 fits in the entire dataset (grey). each colour represents a species. A legend of species names with colours is included at the end for reports with 1 < n < 20 species.