Poorter1999
Data contributor: Lourens Poorter
Email: [email protected]
Address:
- Forest Ecology and Forest Management Group, Wageningen University, P.O. Box 47, 6700 AA Wageningen, The Netherlands
Citation: Poorter L (1999). 'Growth responses of 15 rain-forest tree species to a light gradient: the relative importance of morphological and physiological traits.' Functional Ecology, 13, pp. 396-410.
DOI: 10.1046/j.1365-2435.1999.00332.x
Abstract: 1. Growth of seedlings of 15 rain-forest tree species was compared under controlled conditions, at six different light levels (3, 6, 12, 25, 50 and 100% daylight). 2. Most plant variables showed strong ontogenetic changes; they were highly dependent on the biomass of the plant. 3. Growth rate was highest at intermediate fight levels (25-50%) above which it declined. Most plant variables showed a curvilinear response to irradiance, with the largest changes at the lowest Light levels. 4. There was a consistent ranking in growth between species; species that were fast growing in a low-light environment were also fast growing in a high-light environment. 5. At low light, interspecific variation in relative growth rate was determined mainly by differences in a morphological trait, the leaf area ratio (LAR), whereas at high light it was determined mainly by differences in a physiological trait, the net assimilation rate (NAR). 6. NAR became a stronger determinant of growth than LAR in more than 10-15% daylight. As light availability in the forest is generally much lower than this threshold level, it follows that interspecific variation in growth in a forest environment is mainly owing to variation in morphology.
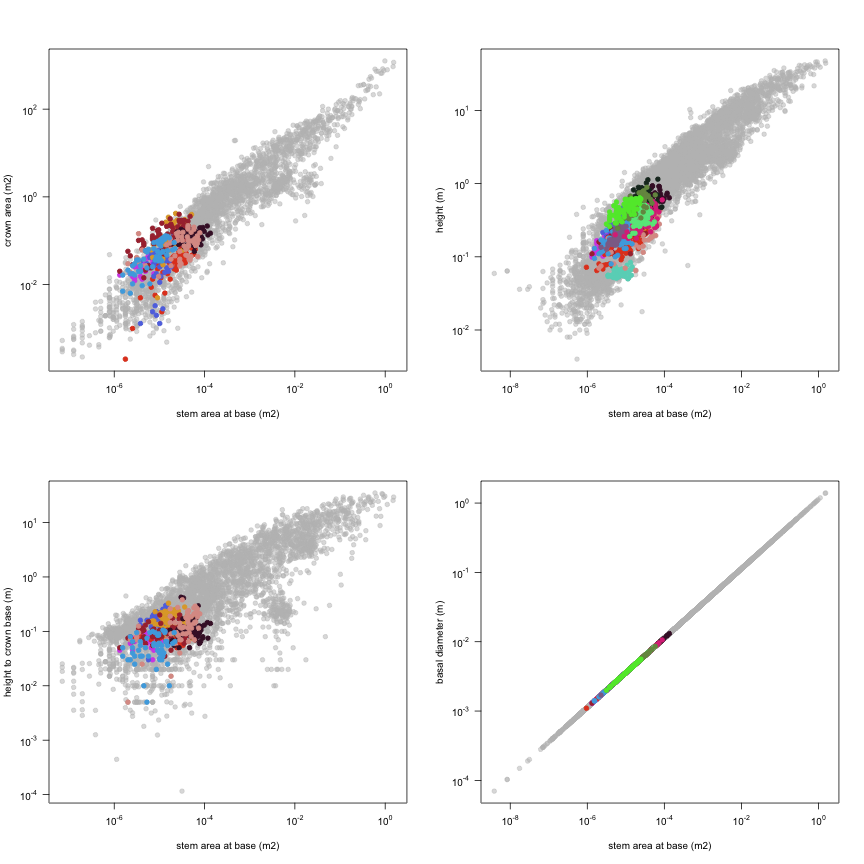
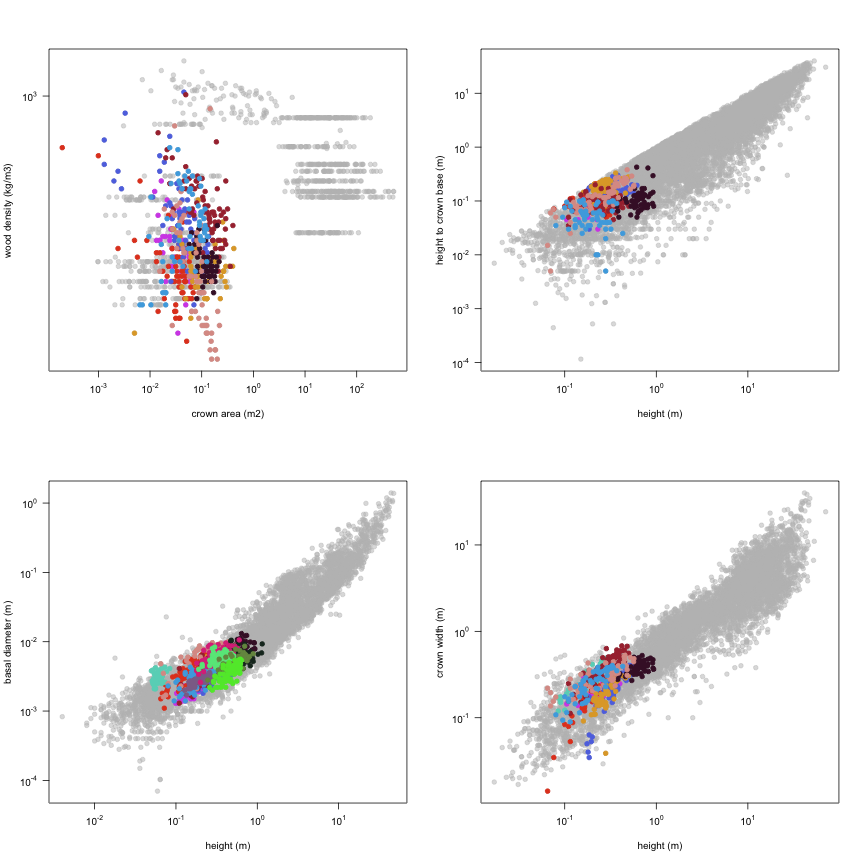
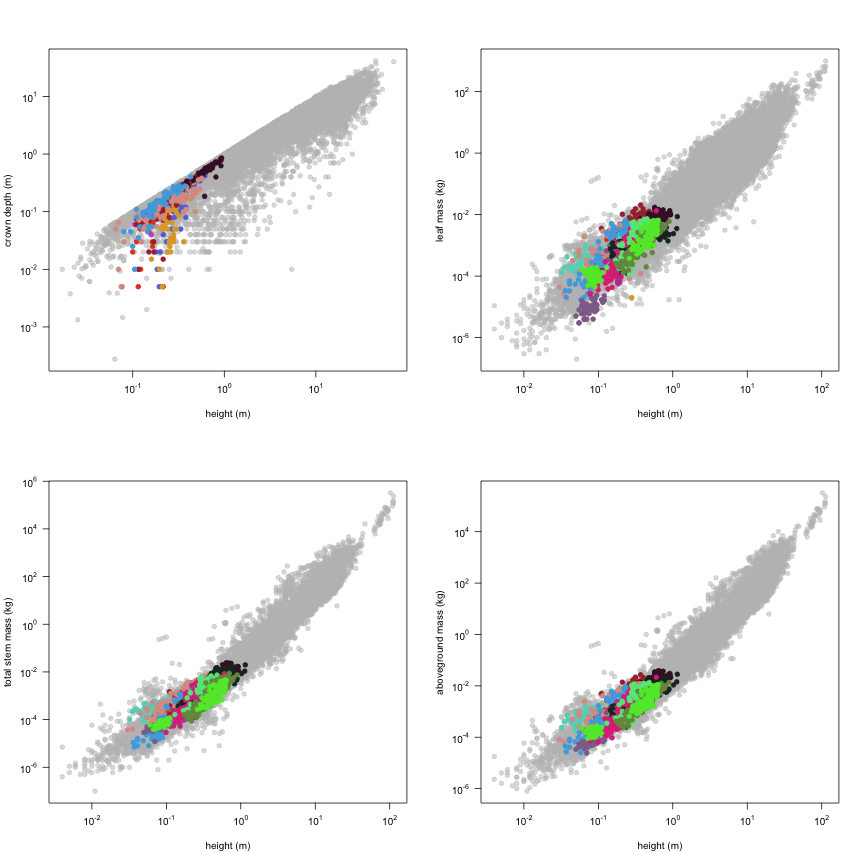
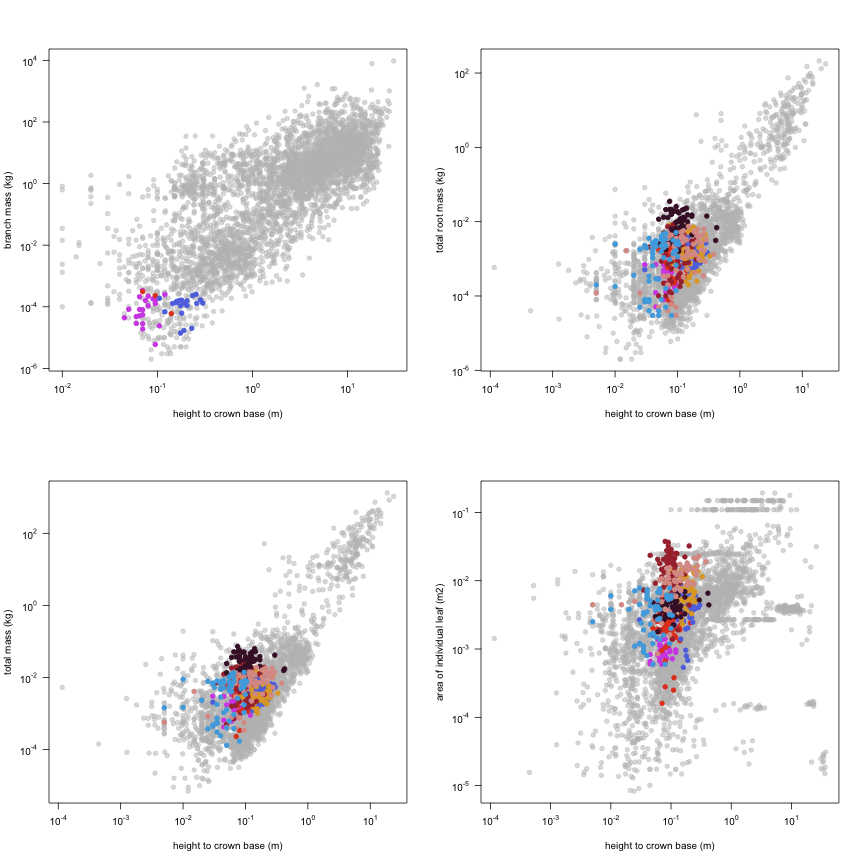
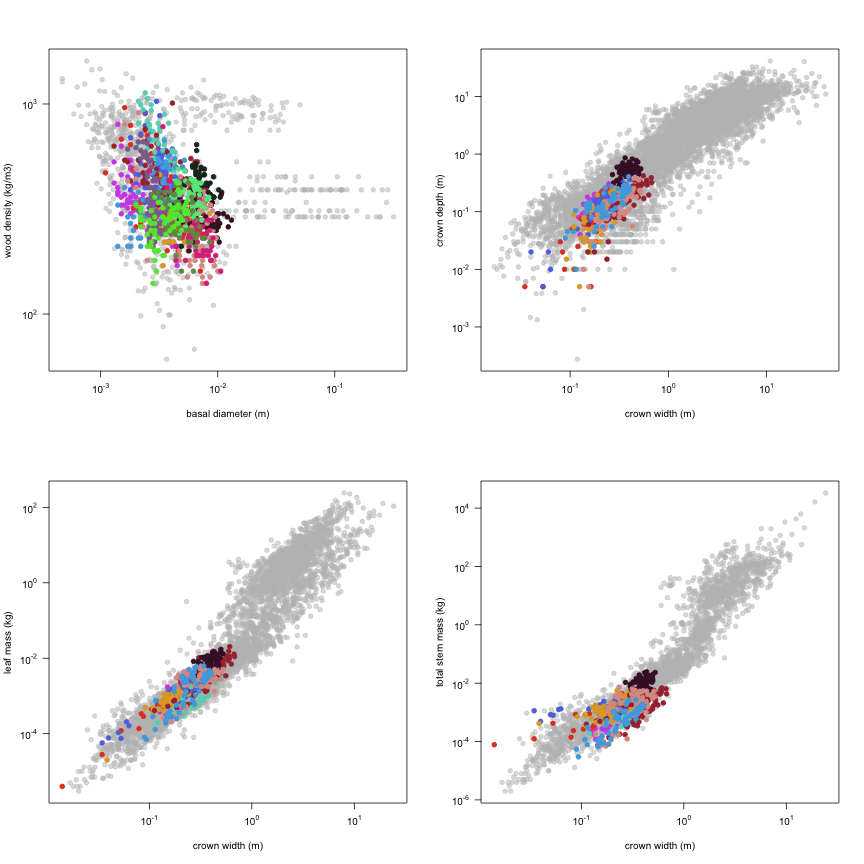
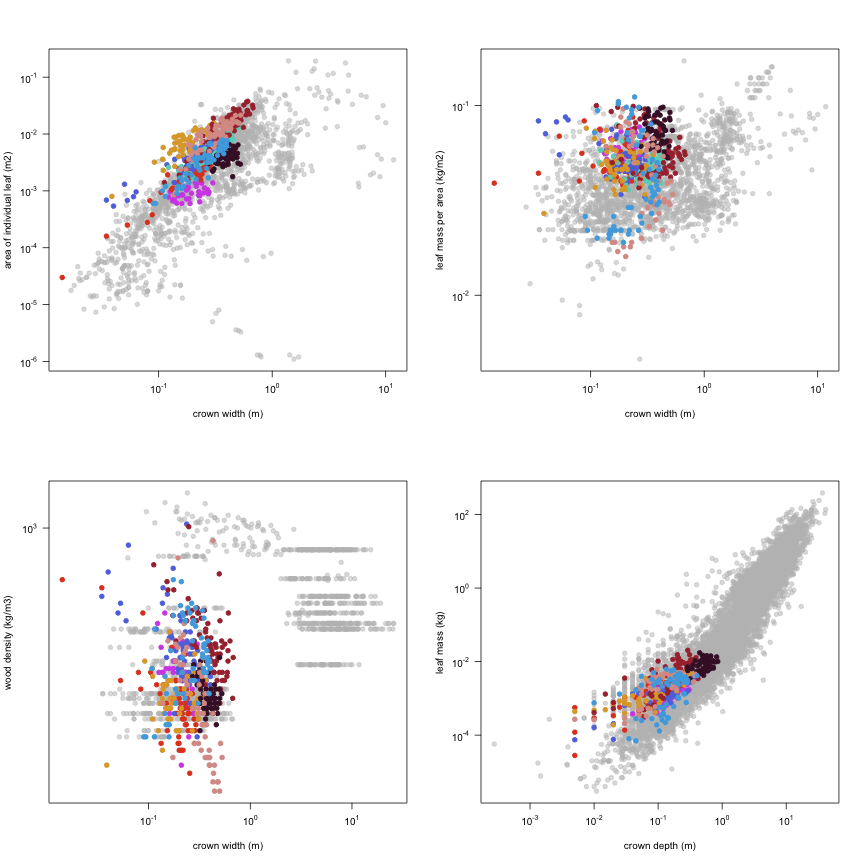
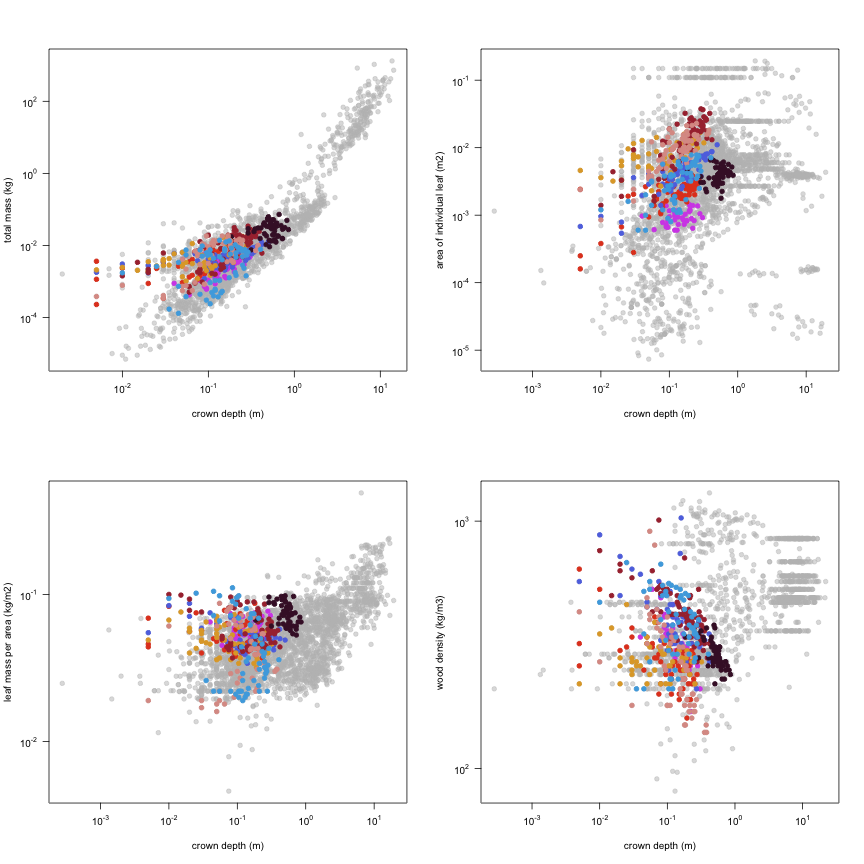
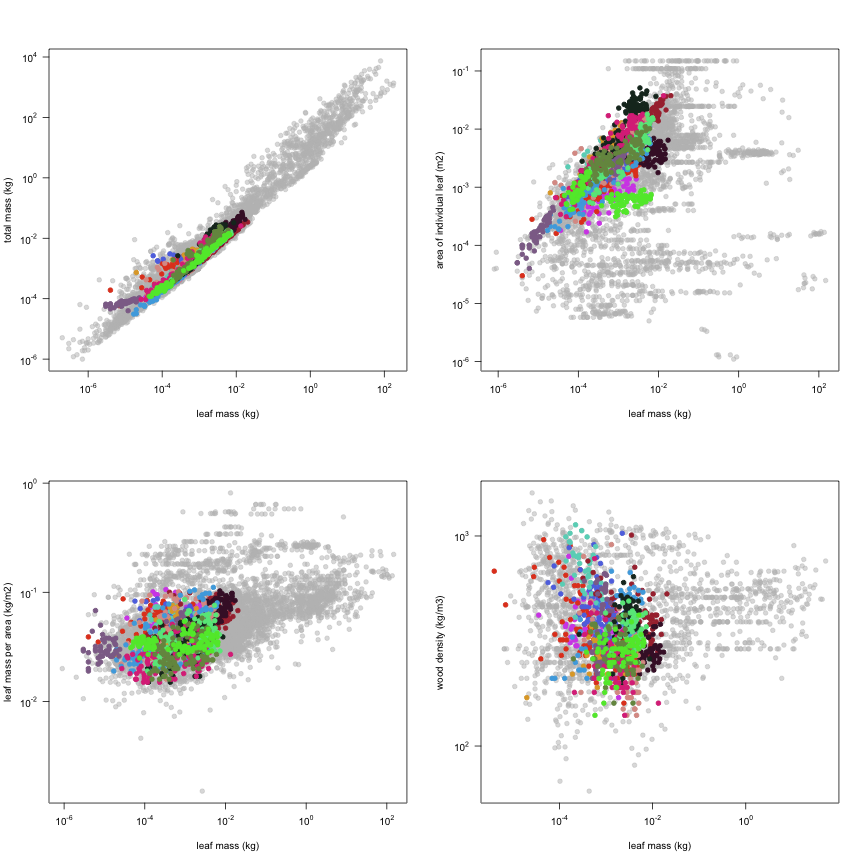
The dataset includes records for 1612 individuals from 15 species belonging to 9 family(ies), presenting 2 functional type(s), growing in 1 condition(s) within 1 major type(s) of habitat, with data included for the following variables:
| Variable | Label | Units | N | Min | Median | Max |
|---|---|---|---|---|---|---|
| latitude | Latitude | deg | 1612 | -11 | -11 | -11 |
| longitude | Longitude | deg | 1612 | -66 | -66 | -66 |
| a.lf | Leaf area | m2 | 1609 | 0.0001 | 0.02 | 0.49 |
| a.stba | Stem area at base | m2 | 1023 | 0.00000095 | 0.000013 | 0.00013 |
| a.cp | Crown area | m2 | 526 | 0.0002 | 0.066 | 0.42 |
| h.t | Height | m | 1611 | 0.03 | 0.23 | 1.1 |
| h.c | Height to crown base | m | 463 | 0 | 0.1 | 0.42 |
| d.ba | Basal diameter | m | 1023 | 0.0011 | 0.0041 | 0.013 |
| d.cr | Crown width | m | 526 | 0.014 | 0.27 | 0.68 |
| c.d | Crown depth | m | 463 | 0.005 | 0.16 | 0.85 |
| m.lf | Leaf mass | kg | 1612 | 0.000003 | 0.00083 | 0.02 |
| m.st | Total stem mass | kg | 1612 | 0.000007 | 0.00062 | 0.024 |
| m.so | Aboveground mass | kg | 1612 | 0.000024 | 0.0015 | 0.039 |
| m.br | Branch mass | kg | 47 | 0 | 0.00011 | 0.00034 |
| m.rt | Total root mass | kg | 1612 | 0.000005 | 0.00053 | 0.035 |
| m.to | Total mass | kg | 1612 | 0.000031 | 0.0021 | 0.072 |
| a.ilf | Area of individual leaf | m2 | 1609 | 0.00003 | 0.0029 | 0.051 |
| ma.ilf | Leaf mass per area | kg m-2 | 1603 | 0.015 | 0.042 | 0.11 |
| r.st | Wood density | kg m-3 | 1023 | 140 | 330 | 1130 |

And locally within the country:

The sites sampled are:
| Location | Longitude | Latitude | Vegetation |
|---|---|---|---|
| Riberalta, Bolivia | -66 | -11 | Tropical rainforest |
The growing conditions of sampled plants was:
| Location | growingCondition |
|---|---|
| Riberalta, Bolivia | common garden |
| Species | Family | Pft |
|---|---|---|
| Aspidosperma ramiflorum | Apocynaceae | evergreen angiosperm, deciduous angiosperm |
| Aspidosperma tambopatense | Apocynaceae | evergreen angiosperm, deciduous angiosperm |
| Pouteria sp. | Sapotaceae | evergreen angiosperm, deciduous angiosperm |
| Euterpe precatoria | Aracaceae | evergreen angiosperm, deciduous angiosperm |
| Cedrelinga catanaeformis | Fabaceae | evergreen angiosperm, deciduous angiosperm |
| Tachigali vasquezii | Fabaceae | evergreen angiosperm, deciduous angiosperm |
| Berholletia excelsa | Lecythidaceae | evergreen angiosperm, deciduous angiosperm |
| Cecropia ficifolia | Cecropiaceae | evergreen angiosperm, deciduous angiosperm |
| Bellucia pentamera | Melastomataceae | evergreen angiosperm, deciduous angiosperm |
| Theobroma speciosum | Sterculiaceae | evergreen angiosperm, deciduous angiosperm |
| Schizolobium amazonicum | Fabaceae | evergreen angiosperm, deciduous angiosperm |
| Cedrela odorata | Meliaceae | evergreen angiosperm, deciduous angiosperm |
| Swietenia macrophylla | Meliaceae | evergreen angiosperm, deciduous angiosperm |
| Amburana cearensis | Fabaceae | evergreen angiosperm, deciduous angiosperm |
| Cariniana micrantha | Lecythidaceae | evergreen angiosperm, deciduous angiosperm |
Sampling strategy: A growth experiment was carried out using 15 rainforest tree species. The species were grown in shade houses representing 6 light levels (3, 6, 12, 25, 50 and 100% of full light) in Riberalta, Bolivia (11 degrees S, 66 degrees W). Seedlings were germinated from seed, or collected as wildings in the forest. The seedlings were aclimated for 15 weeks (range 2-36) to the shade house before a first harvest (on average 8 seedlings per species) was carried out. A second harvest (on average 10 seedlings per species) was carried out after 23 weeks (range (12-29). The experiment was carried out in 3 batches. Plants were grown in 5 l bags.
Leaf area: For each sapling, the total leaf area and average individual leaf area were measured using photocopied images or a leaf area meter.
Stem cross sectional area: Stem diameter was measured at the stem base using a calliper.
Height: Height was measured as the vertical distance from the ground to the highest apex.
Crown area: Crown width was measured at perpendicular right angles including the widest width. Projected area and volume were estimated by assuming a circle and using the average crown diameter.
Crown length: Crown length was measured as the difference between the height and the insertion point of the lowest leaf.
Biomass: Saplings were divided into root, stem, branches and petioles, and leaf lamina. Each compartment was dried to constant weight and weighed. Leaf petioles were not included in Total leaf mass. All parts of the saplings were weighed after being oven-dried at 70degC for at least 48 h.
Traits: LMA was calculated using a flatbed scanner or video imaged photocopies, for all leaves, wood density was calculated as (stem + branch [if present]+ petiole mass) over stem volume.
Year collected: 1994-1996
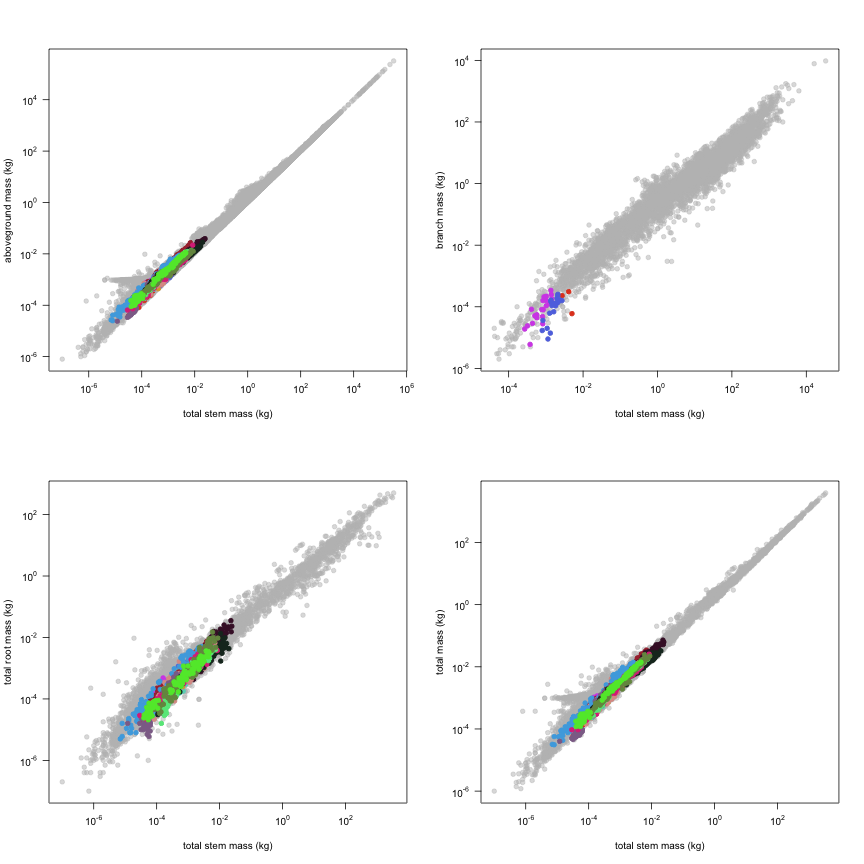
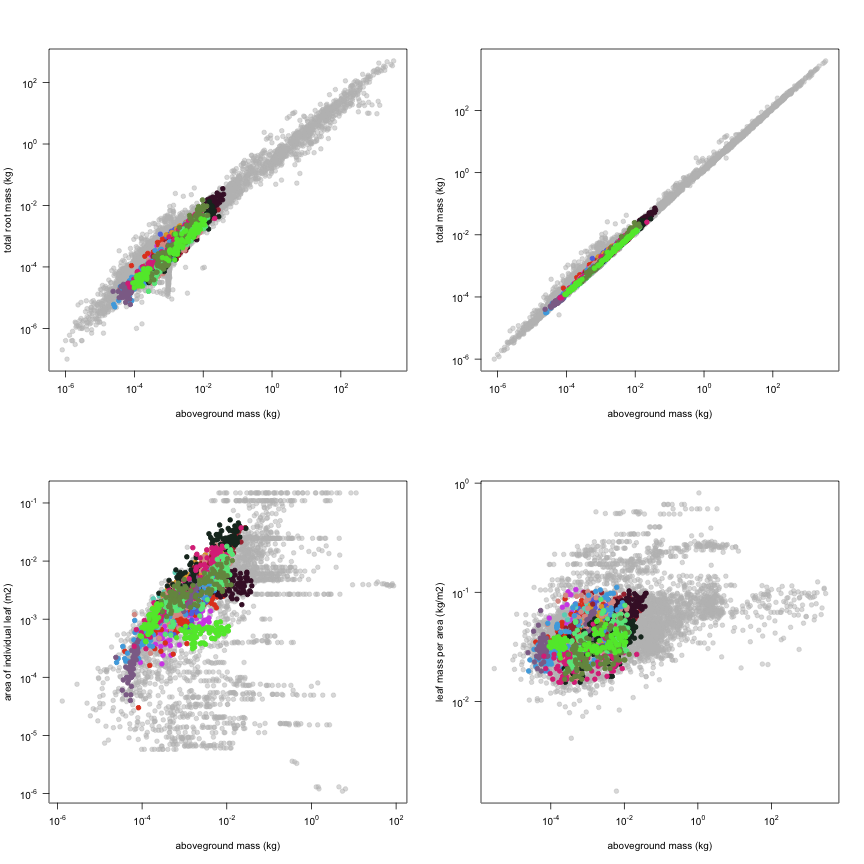
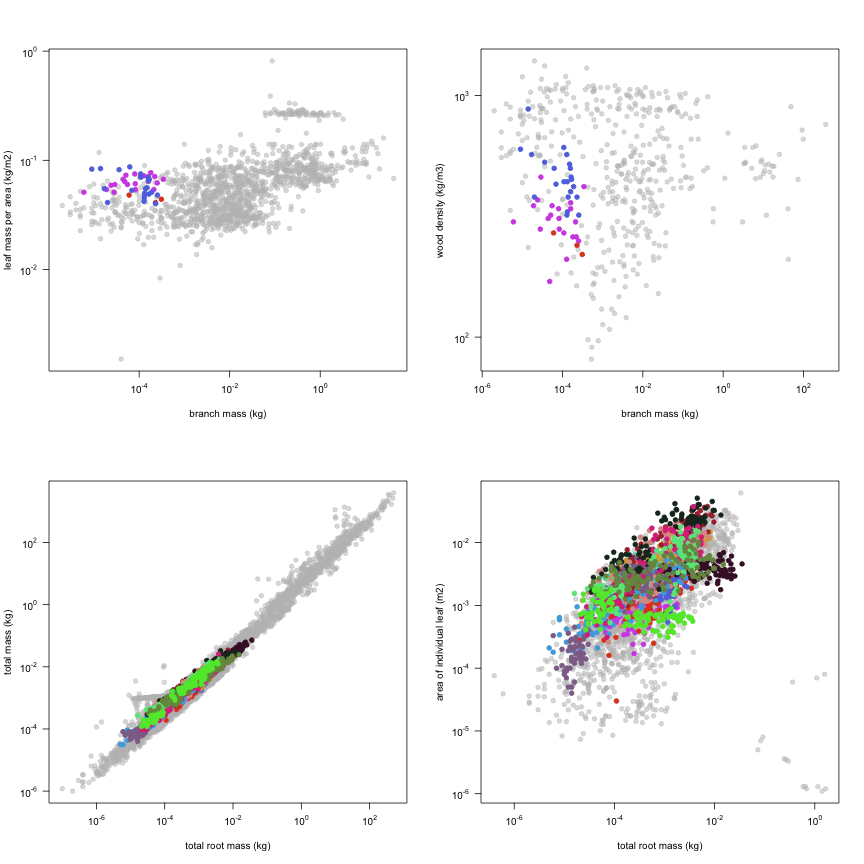
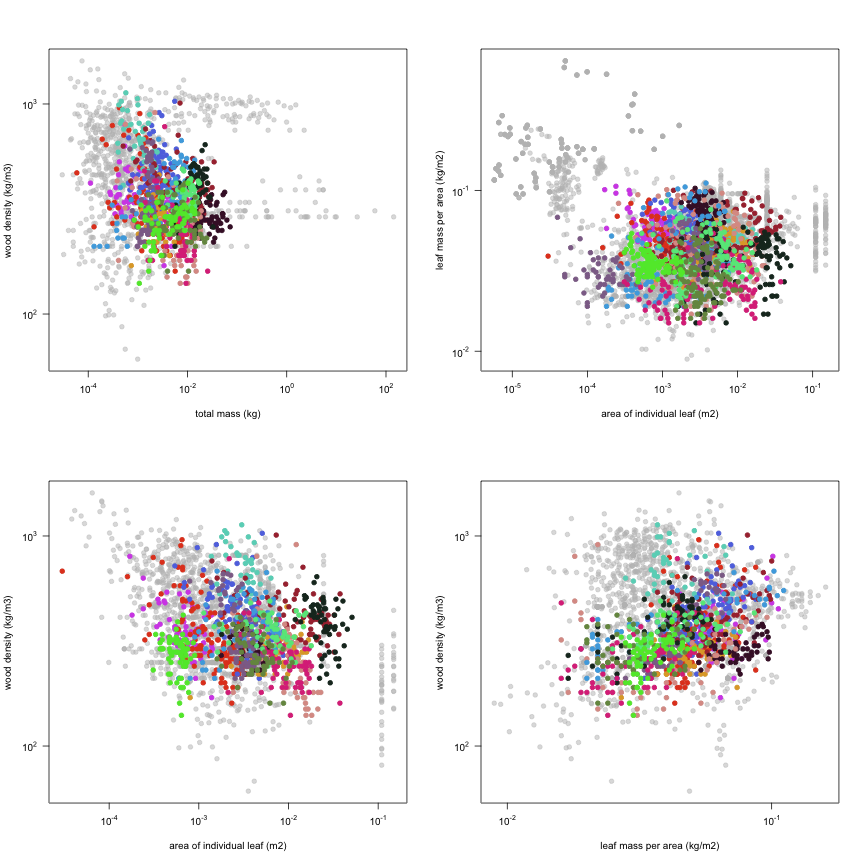
This is how the study Poorter1999 fits in the entire dataset (grey). each colour represents a species. A legend of species names with colours is included at the end for reports with 1 < n < 20 species.