Roberts2003
Data contributor: Scott D. Roberts
Email: [email protected]
Address:
- Department of Forestry, Mississippi State University, Mississippi State, MS 39762-9681, USA
Citation: Roberts SD, Dean TJ and Evans DL (2003). 'Family influences on leaf area estimates derived from crown and tree dimensions in Pinus taeda.' Forest ecology and management, 172(2), pp. 261-270.
DOI:
Abstract:
The dataset includes records for 73 individuals from 1 species belonging to 1 family(ies), presenting 1 functional type(s), growing in 1 condition(s) within 1 major type(s) of habitat, with data included for the following variables:
| Variable | Label | Units | N | Min | Median | Max |
|---|---|---|---|---|---|---|
| latitude | Latitude | deg | 73 | 33 | 33 | 33 |
| longitude | Longitude | deg | 73 | -89 | -89 | -89 |
| age | Age | yr | 73 | 15 | 15 | 15 |
| a.lf | Leaf area | m2 | 73 | 3.8 | 30 | 78 |
| a.stbh | Stem area at breast height | m2 | 73 | 0.0062 | 0.029 | 0.066 |
| a.cp | Crown area | m2 | 70 | 3.5 | 11 | 30 |
| h.t | Height | m | 73 | 10 | 17 | 19 |
| h.c | Height to crown base | m | 73 | 5.2 | 11 | 13 |
| d.bh | Dbh | m | 73 | 0.089 | 0.19 | 0.29 |
| h.bh | Height of d.bh measurement | m | 73 | 1.4 | 1.4 | 1.4 |
| d.cr | Crown width | m | 70 | 2.1 | 3.8 | 6.2 |
| c.d | Crown depth | m | 73 | 1.6 | 6.4 | 11 |
| m.lf | Leaf mass | kg | 73 | 0.81 | 6.7 | 19 |
| m.st | Total stem mass | kg | 73 | 13 | 86 | 210 |
| m.so | Aboveground mass | kg | 73 | 14 | 95 | 225 |
| m.br | Branch mass | kg | 73 | 1.2 | 10 | 50 |
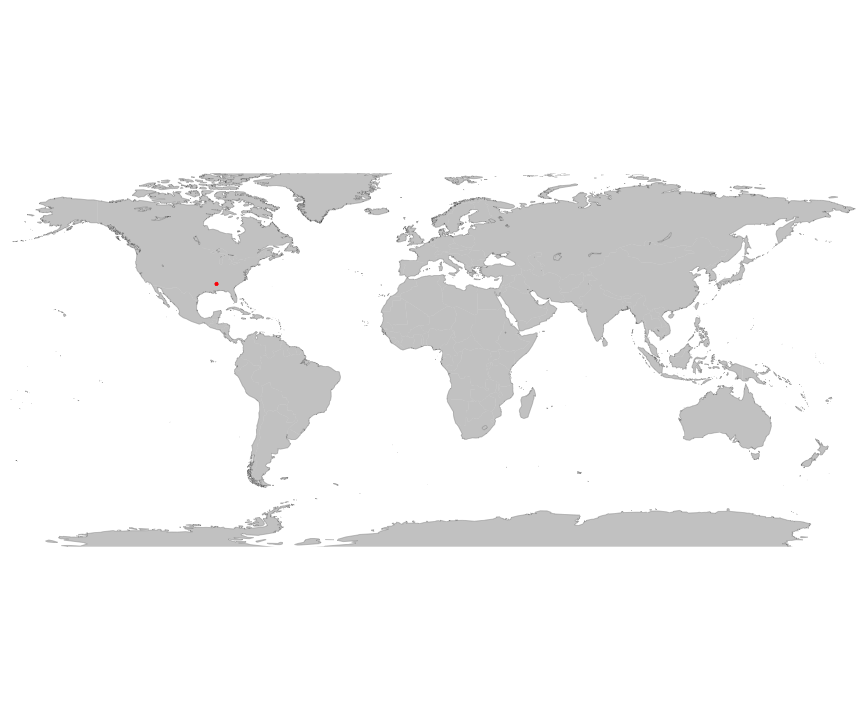
And locally within the country:

The sites sampled are:
| Location | Longitude | Latitude | Vegetation |
|---|---|---|---|
| Winston County, Mississippi USA | -89.05 | 33.235 | Temperate forest |
The growing conditions of sampled plants was:
| Location | Grouping | growingCondition |
|---|---|---|
| Winston County, Mississippi USA | Family = B | plantation unmanaged |
| Winston County, Mississippi USA | Family = C | plantation unmanaged |
| Winston County, Mississippi USA | Family = G | plantation unmanaged |
| Winston County, Mississippi USA | Family = L | plantation unmanaged |
| Winston County, Mississippi USA | Family = O | plantation unmanaged |
| Winston County, Mississippi USA | Family = P | plantation unmanaged |
| Winston County, Mississippi USA | Family = R | plantation unmanaged |
| Winston County, Mississippi USA | Family = W | plantation unmanaged |
| Winston County, Mississippi USA | Family = Y | plantation unmanaged |
| Species | Family | Pft |
|---|---|---|
| Pinus taeda | Pinaceae | evergreen gymnosperm |
Sampling strategy: Seventy-three 15-yr-old Pinus taeda trees representing eight half-sib families and an unimproved check were destructively sampled from a single planting block with trees planted on a 1.5m x 3.0m spacing. Only data from 65 trees were included in the 2003 manuscript. Trees were selected from across the range of trees sizes in the block. Allocation patterns of aboveground biomass components were examined. Allometric relationships for estimating leaf area were developed and tested for family differences.
Leaf area: From the crowns of harvested trees, all live branches were removed from each 1-meter section and separated into current year foliage and sub-tending twigs, and previous years foliage and twigs. The total fresh weight of each of the components was recorded. A random subsample of each component was weighed fresh and retained for laboratory analysis. Approximately 20 needle fascicles from both current-year and second-year foliage were collected from each crown section and returned to the lab for determination of specific leaf area (SLA). In the laboratory, subsamples were dried to a constant weight and weighed to determine fresh mass:dry mass ratios for each component in each section. Foliage was separated from twigs to determine foliage mass:wood mass ratios for each component in each section. The fresh needle samples were separated from the fascicle sheaths and projected area was determined with an optical planimeter. The samples were then dried to constant weight and weighed to determine SLA (cm2/g). Using fresh mass:dry mass ratios, foliage mass:wood mass ratios, and SLA, a projected leaf area for both current-year and second-year foliage was calculated for each 1-m crown section. Section totals were summed to get total crown LA.
Stem cross sectional area: Stem cross sectional areas were determined from stem diameters taken at stump height (0.3 m), 1 m, 1.37 m, and every 1 m interval up the stem. Stem diameters were measured using a diameter tape.
Height: Stem heights were measured on standing trees prior to felling using a clinometer to measure from the base of the stem to the tallest point on the stem. Stem height was measured again after felling by stretching a tape along the length of the stem.
Crown area: Crown projection area (CPA), the horizontal area of crown coverage, was calculated as the area of a circle with a diameter equal to mean crown width. Prior to felling, crown diameter on two axes (maximum and minimum) were measured by stretching a tape between the estimated crown edges as estimated by an observer standing several meters back from the tree.The two crown diameters were averaged to get the mean crown diameter.
Biomass: Total dry mass of woody components (stem, branches, twigs) were determined for each 1 meter section of all destructively sampled trees. Fresh weights were determined in the field, subsamples were taken, dried, and weighed to determine total dry mass of each component.
Traits: Height to the base of the live crown was determined prior to felling by using a clinometer to measure the height to the lowest branches in the predominant crown, i.e., disregarding individual branches that occasionally occur well below the majority of the live crown. Crown length was determined by subtracting the height to base of live crown from the total height of the tree. Crown volume was determined from crown projection area and crown length using the formula for a cone (1/3 * CPA * CRLEN). Height to mid-crown was taken as the distance from stem breast height (1.37 m) to the vertical center of leaf area, was calculated as ((HT - (0.56 * CRLEN)) - 1.37).
Growth environment: PU
Other: Addtional data is available from S Roberts upon request. This includes all the field measurements from each 1-meter section (foliage, branch, and stem masses) as well as the subsample weights, fresh weight:dry weight ratios, specific leaf areas, etc.
Year collected: 1999
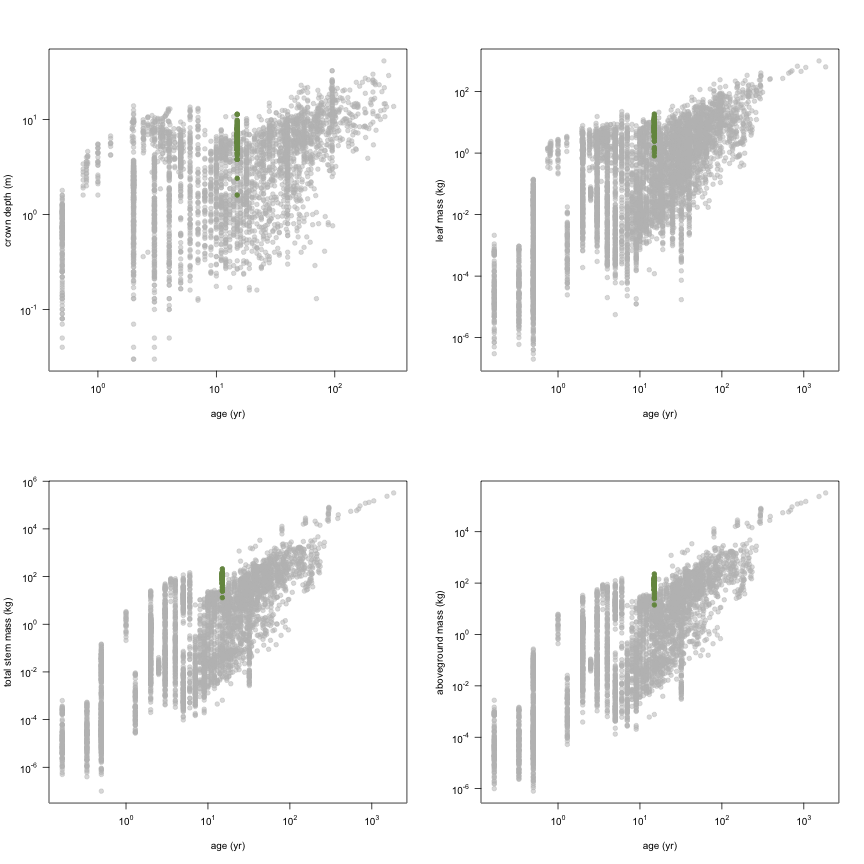
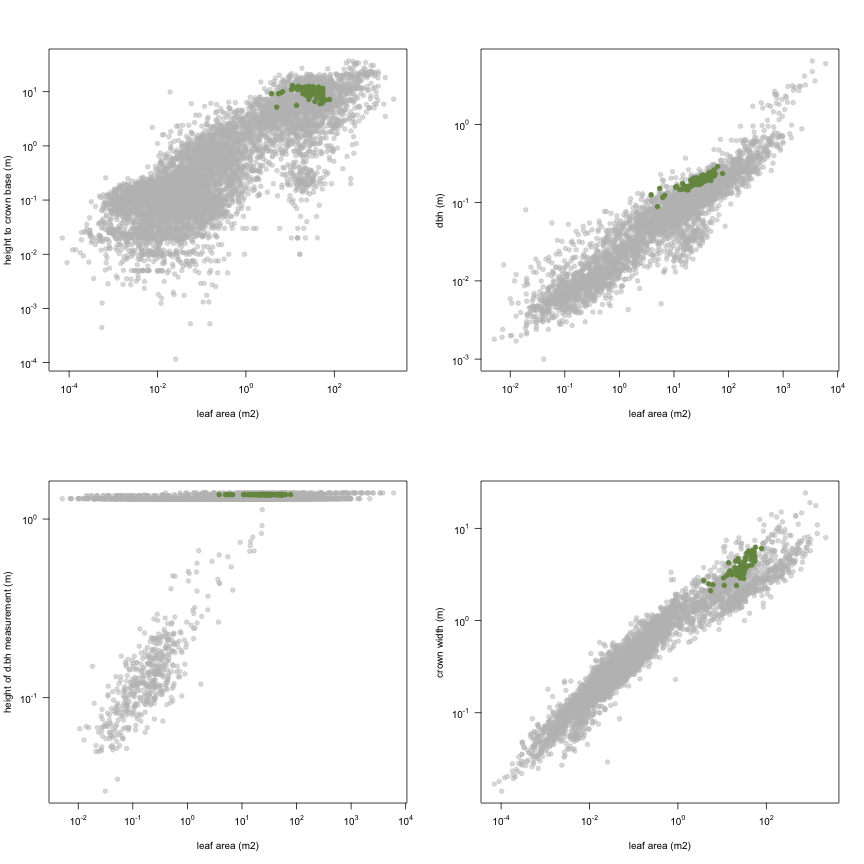
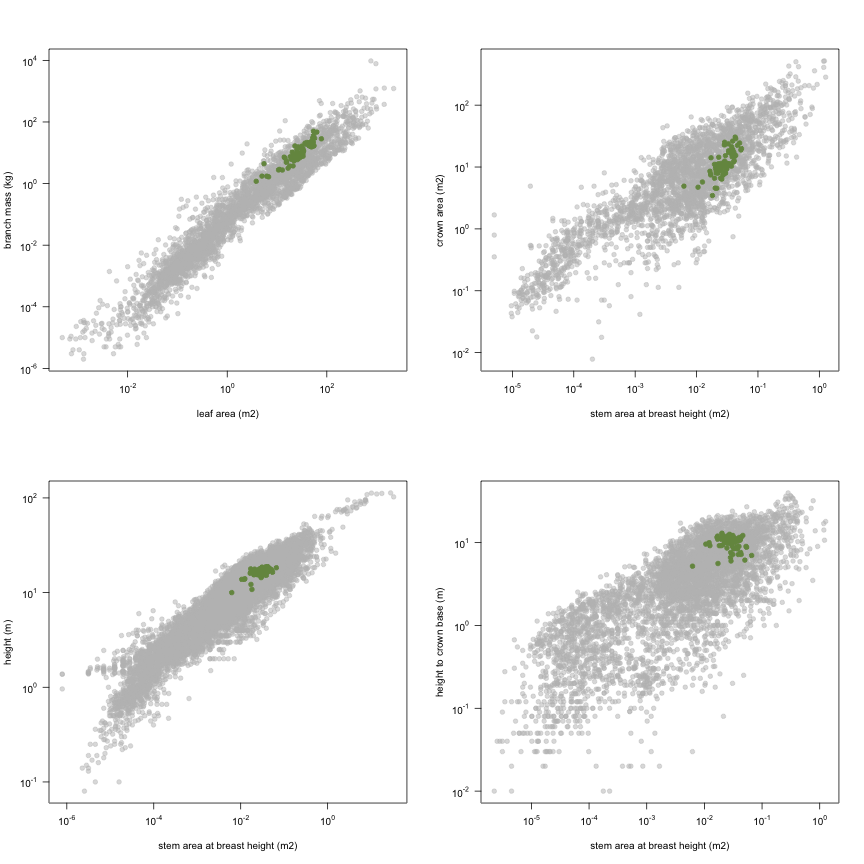
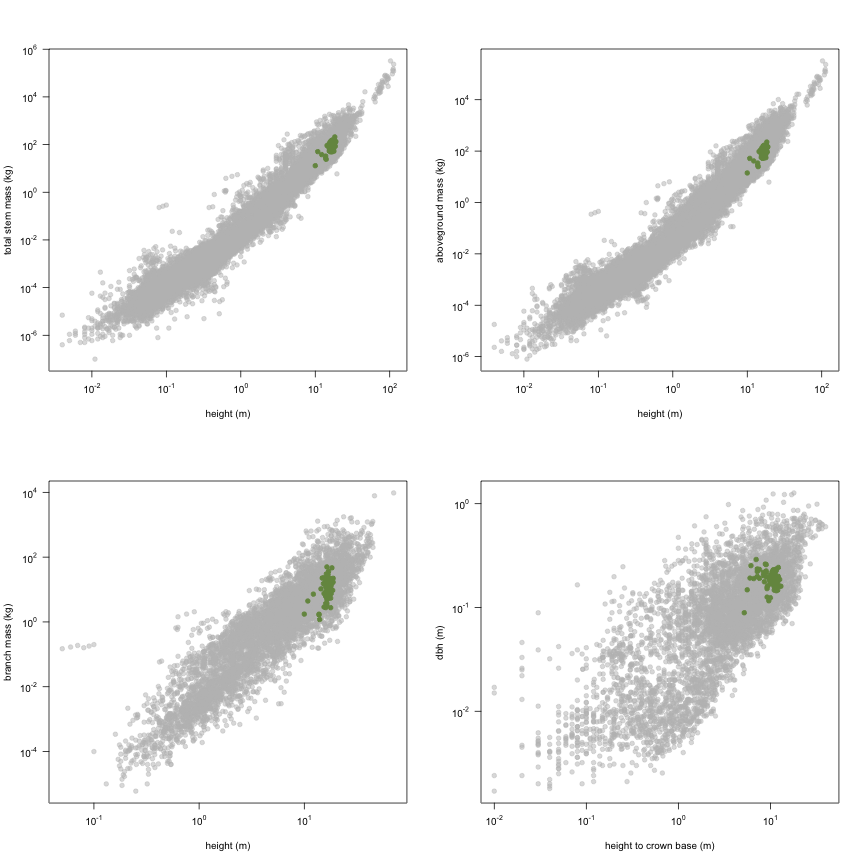
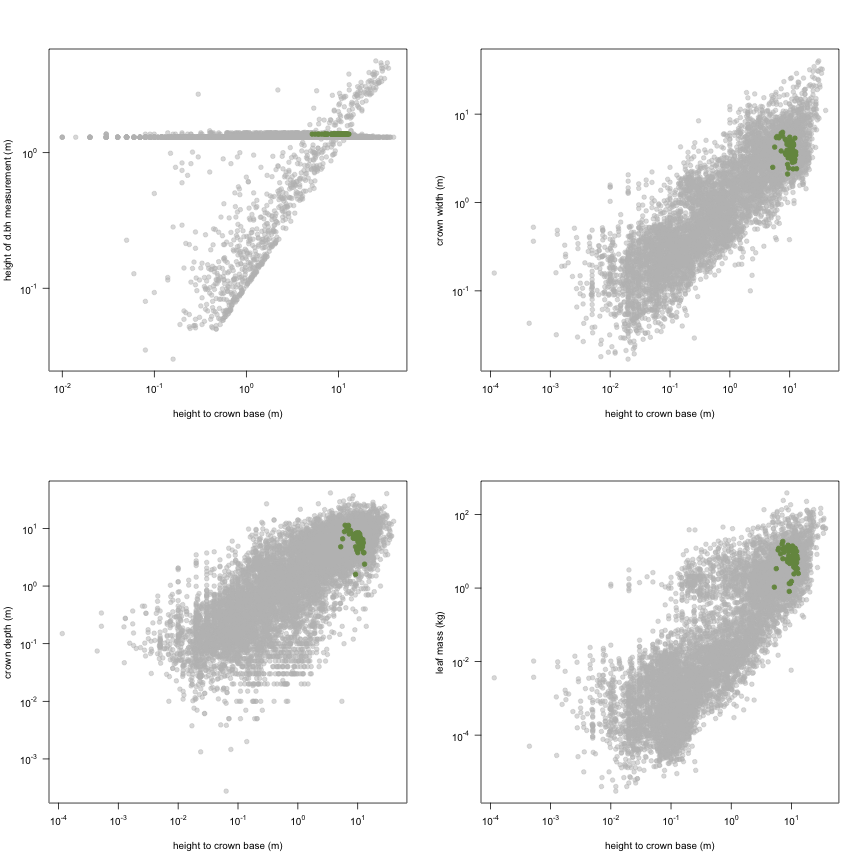
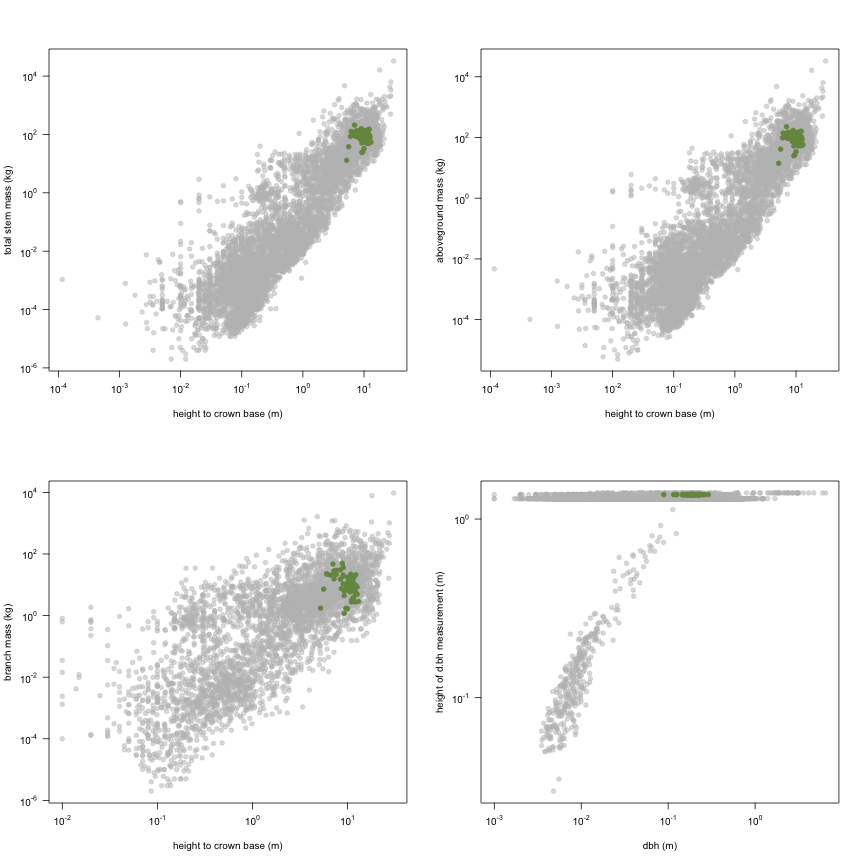
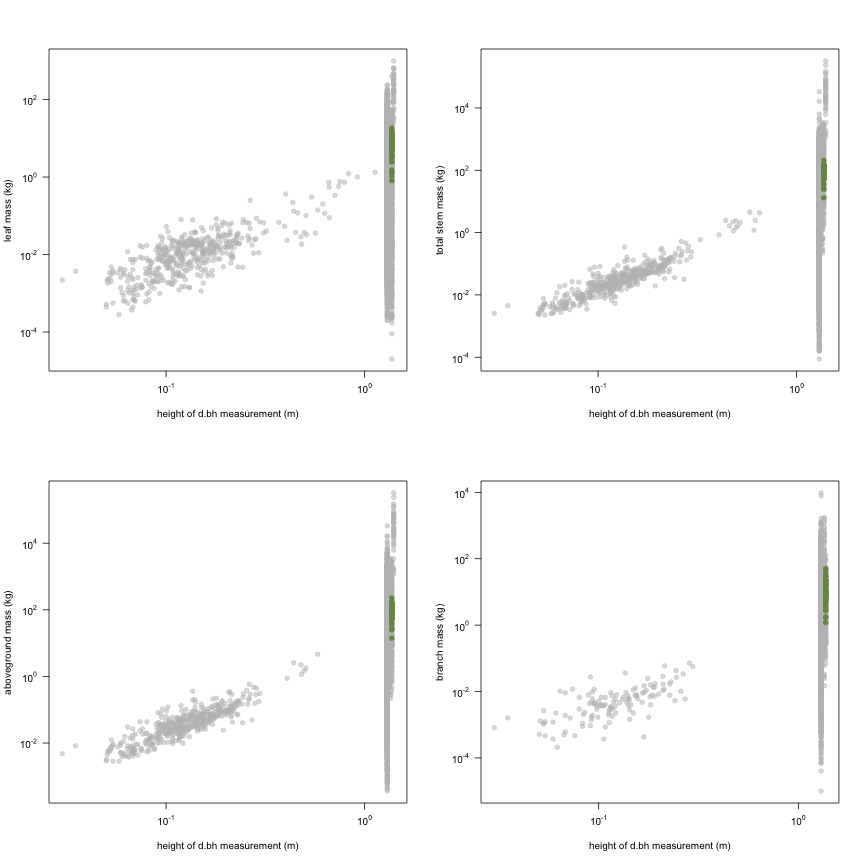
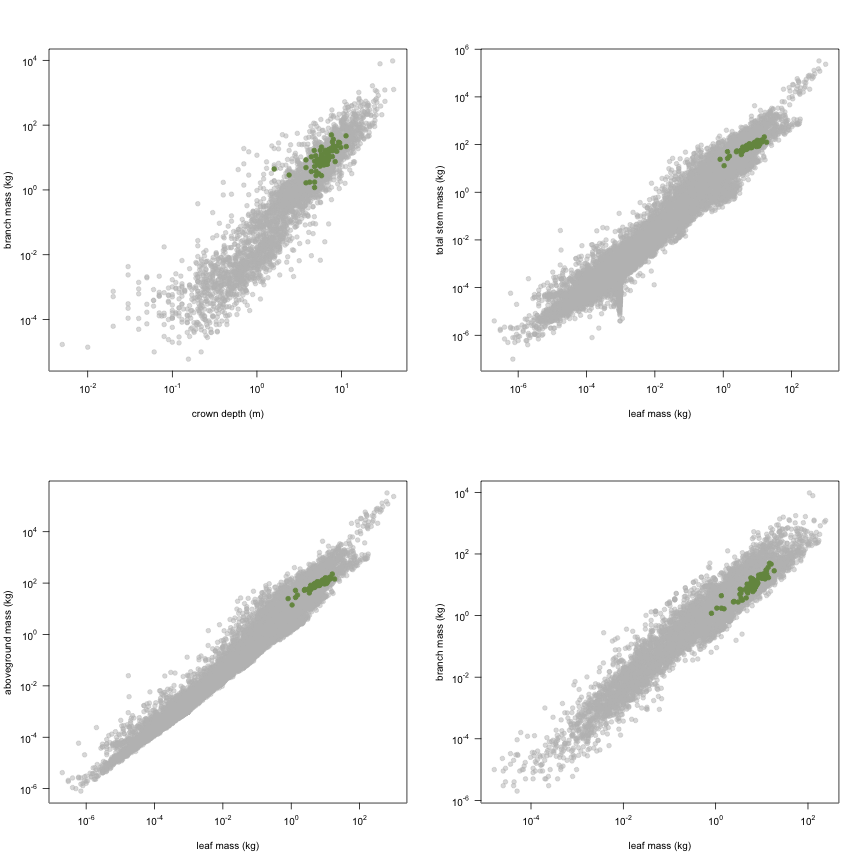
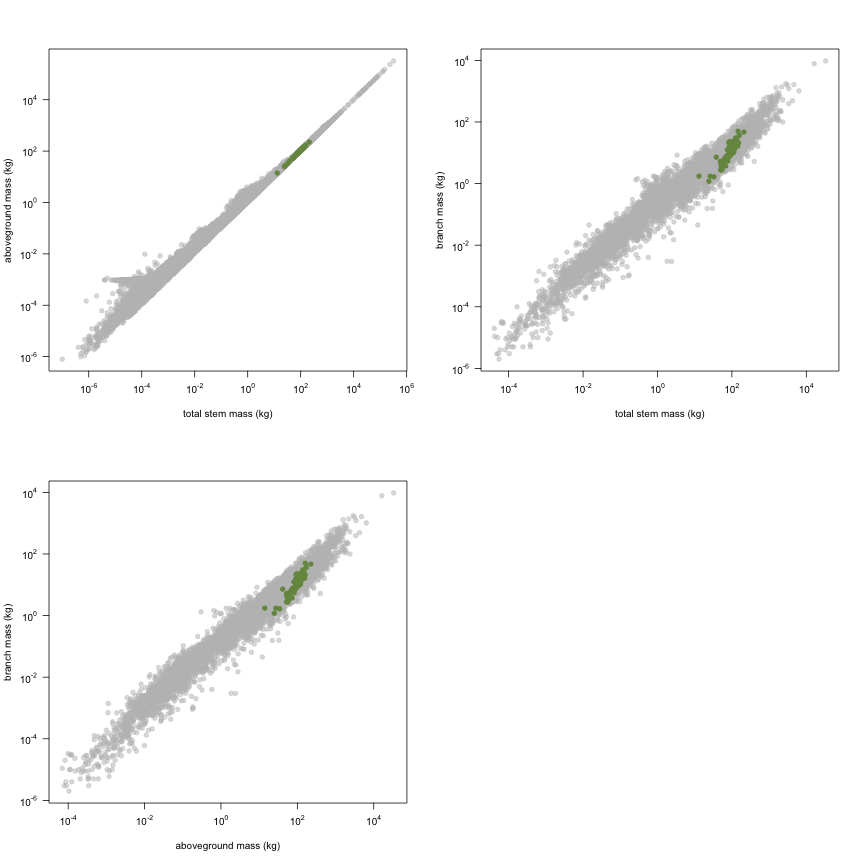
This is how the study Roberts2003 fits in the entire dataset (grey). each colour represents a species. A legend of species names with colours is included at the end for reports with 1 < n < 20 species.