Holdaway2008
Data contributor: Robert Holdaway
Email: [email protected]
Address:
- Landcare Research, P.O. Box 69040, Lincoln 7640, New Zealand
Citation: Holdaway RJ, Allen RB, Clinton PW, Davis MR and Coomes DA (2008). 'Intraspecific changes in forest canopy allometries during self-thinning.' Functional Ecology, 22, pp. 460-469.
DOI: 10.1111/j.1365-2435.2008.01388.x
Abstract: Leaves are the key active sites for energy and matter transfer in plants, and therefore the total one-sided area of leaves per square metre of ground (leaf area index, LAI) is a critical variable used for scaling up from plant to ecosystem level properties. A commonly held belief is that LAI remains constant during the self-thinning phase of stand development, and allometric relationships between tree density, mean tree size and leaf area (or leaf mass) are frequently used to provide a mechanistic explanation for the observed thinning relationships. We investigated variations in leaf allometry, stand LAI and other canopy properties along a developmental sequence of naturally occurring mono-specific self-thinning stands of mountain beech (Nothofagus solandri var. cliffortioides) in New Zealand. Stand age had a consistent significant effect on both the slope and the intercept of both the leaf mass and the leaf area allometric relationships (increasing slope, decreasing intercept). This was due to trees of a given basal area having more leaf area (or leaf mass) when growing in a neighbourhood of smaller trees, than equivalently sized individuals surrounded by a lower density of trees larger than itself. A peaked (non-constant) relationship was observed between LAI and stand age during self-thinning, with the mean LAI values peaking in intermediately aged large sapling stands (7.08) compared with the small sapling stands (5.42) and older pole stands (5.70). Stand level leaf mass per unit area (LMA) varied with canopy height and stand age, being highest at the top of canopies and in older stands. We propose that the observed increase in canopy depth during the early stages of stand development (but after canopy closure has occurred) could be driving the increase in stand LAI due to a more even distribution of light within the canopy. Our findings suggest that the commonly held assumption of constant LAI should be abandoned in favour of the notion of leaf area being at a dynamic maximum during self-thinning, with the maximum possible leaf area being influenced by age-related changes in canopy structure that occur during stand development.
The dataset includes records for 87 individuals from 1 species belonging to 1 family(ies), presenting 1 functional type(s), growing in 1 condition(s) within 1 major type(s) of habitat, with data included for the following variables:
| Variable | Label | Units | N | Min | Median | Max |
|---|---|---|---|---|---|---|
| latitude | Latitude | deg | 87 | -43 | -43 | -43 |
| longitude | Longitude | deg | 87 | 171 | 171 | 171 |
| age | Age | yr | 87 | 25 | 25 | 135 |
| a.lf | Leaf area | m2 | 87 | 0.014 | 0.16 | 55 |
| a.stba | Stem area at base | m2 | 87 | 0.000025 | 0.00019 | 0.077 |
| a.stbh | Stem area at breast height | m2 | 24 | 0.00016 | 0.0018 | 0.063 |
| h.t | Height | m | 87 | 0.8 | 2.4 | 17 |
| d.ba | Basal diameter | m | 87 | 0.0056 | 0.015 | 0.31 |
| d.bh | Dbh | m | 24 | 0.014 | 0.048 | 0.28 |
| h.bh | Height of d.bh measurement | m | 87 | 1.4 | 1.4 | 1.4 |
| m.lf | Leaf mass | kg | 87 | 0.00098 | 0.015 | 8.7 |
| a.ilf | Area of individual leaf | m2 | 87 | 0.000032 | 0.000048 | 0.000077 |
| ma.ilf | Leaf mass per area | kg m-2 | 87 | 0.065 | 0.1 | 0.16 |
And locally within the country:
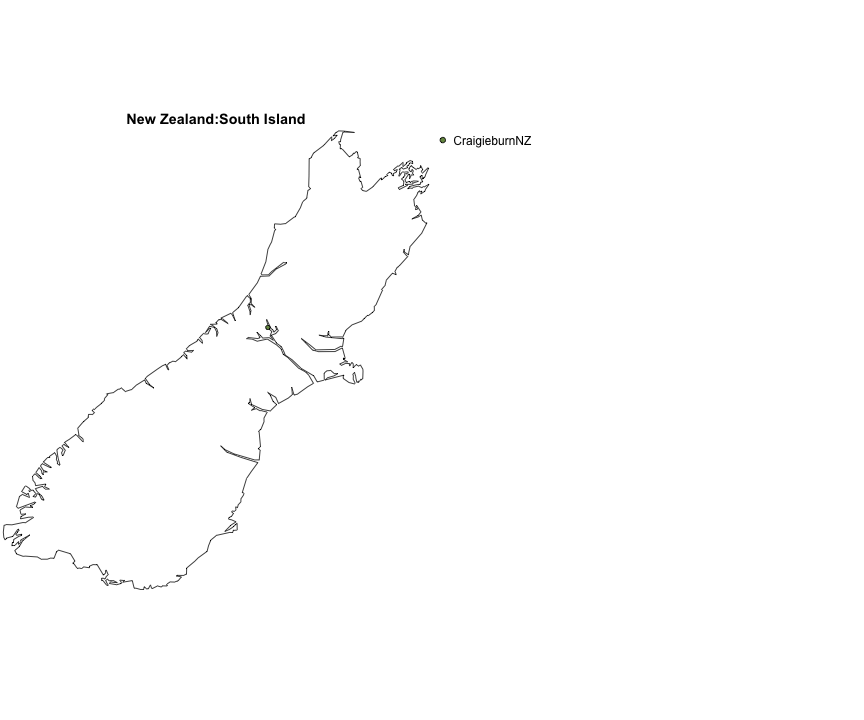
The sites sampled are:
| Location | Longitude | Latitude | Vegetation |
|---|---|---|---|
| CraigieburnNZ | 171.35 | -43.15 | Temperate forest |
The growing conditions of sampled plants was:
| Location | growingCondition |
|---|---|
| CraigieburnNZ | field wild |
| Species | Family | Pft |
|---|---|---|
| Nothofagus solandri | Nothofagaceae | evergreen angiosperm |
Sampling strategy: Leaf area and weight data collected for 87 Nothofagus solandri individuals at Craigieburn, South Island, New Zealand. Data collected January to April 2007 from three distinct age classes (25, 40 and 135 years old). All stands were located on similar slopes, aspects and altitudes
Leaf area: Each tree was divided into 1m height classes. A subsample of 100 fresh leaves from each height class was used for determination of leaf area using ImageJ software and specific leaf area was used to estimate total leaf area per height class and per tree.
Leaf biomass: For each height class leaf biomass was determined by drying the leaf component (including petioles) at 60 degC for at least three days and weighing all material per height class. Sor some the leaf biomass was determined through weighing branches with leaves still attached and calculating the leaf biomass through a known leaf to branch ratio. Total leaf biomass was attained by summation of all height classes.
Leaf mass per area: LMA calculated as the average across the entire plant
Individual leaf area: Average leaf area for an individual leaf was aceraged across the entire plant
Growth environment: Natural forest
Stem cross sectional area: Stem diameter was measured at ground using calliper at right angles, and at breast height (1.35m) using stem diameter tape
Height: Height was measured as the vertical distance from the ground to the highest apex.
Other variables: Further data exist on the stand development sequence from which these data were obtained. See Holdaway et al. 2008 Functional Ecology 22: 460-469 and references therein.
Year collected: 2007
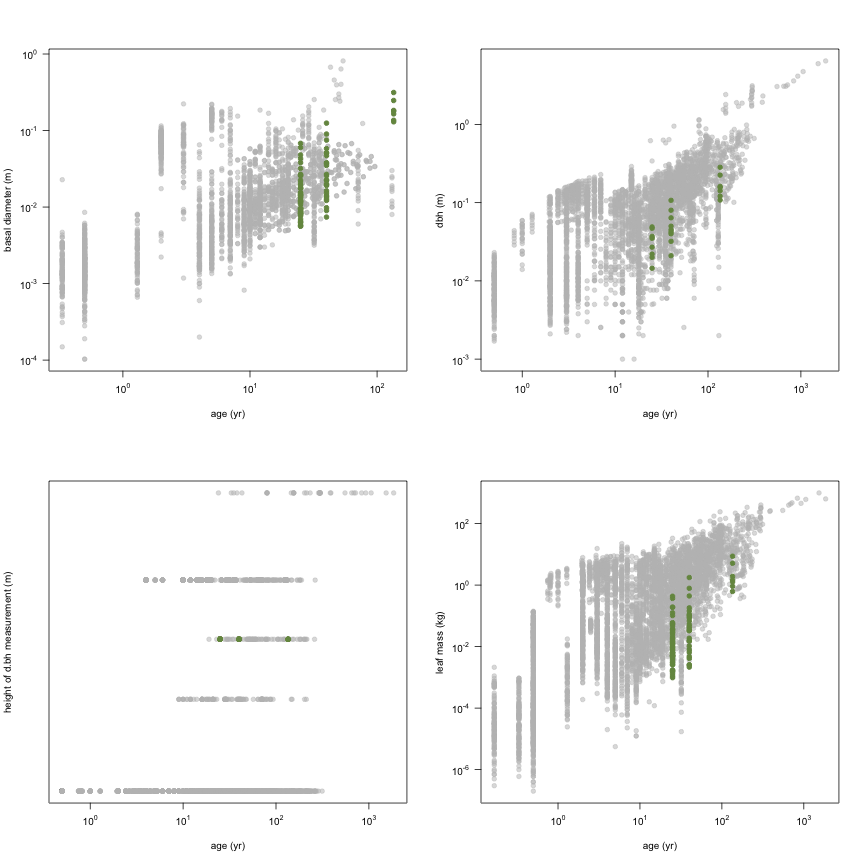
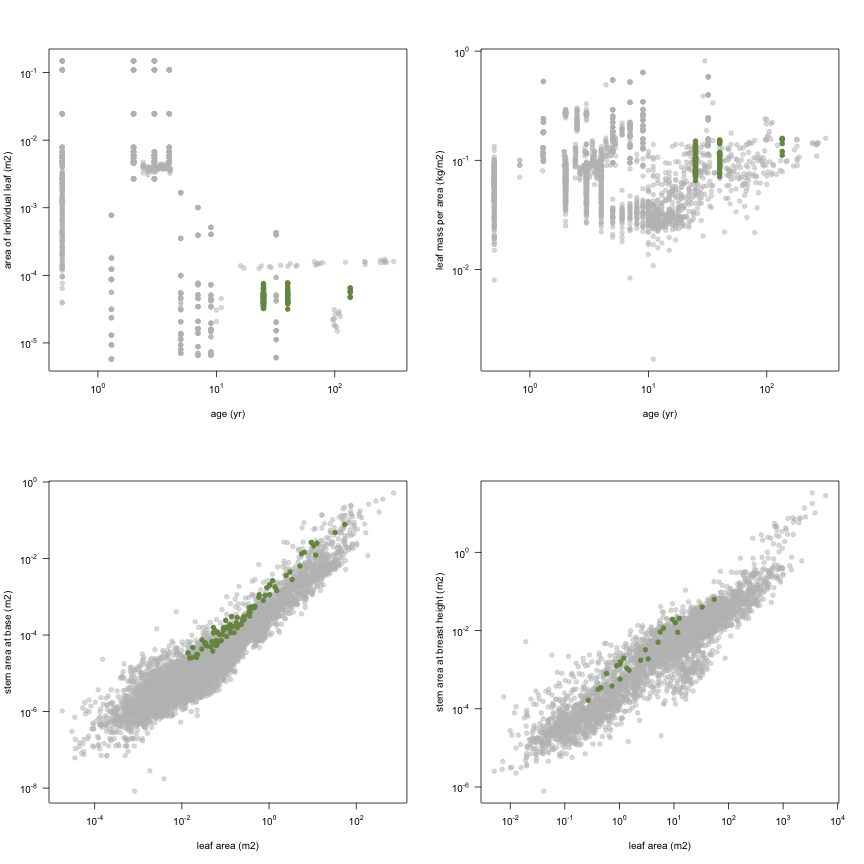
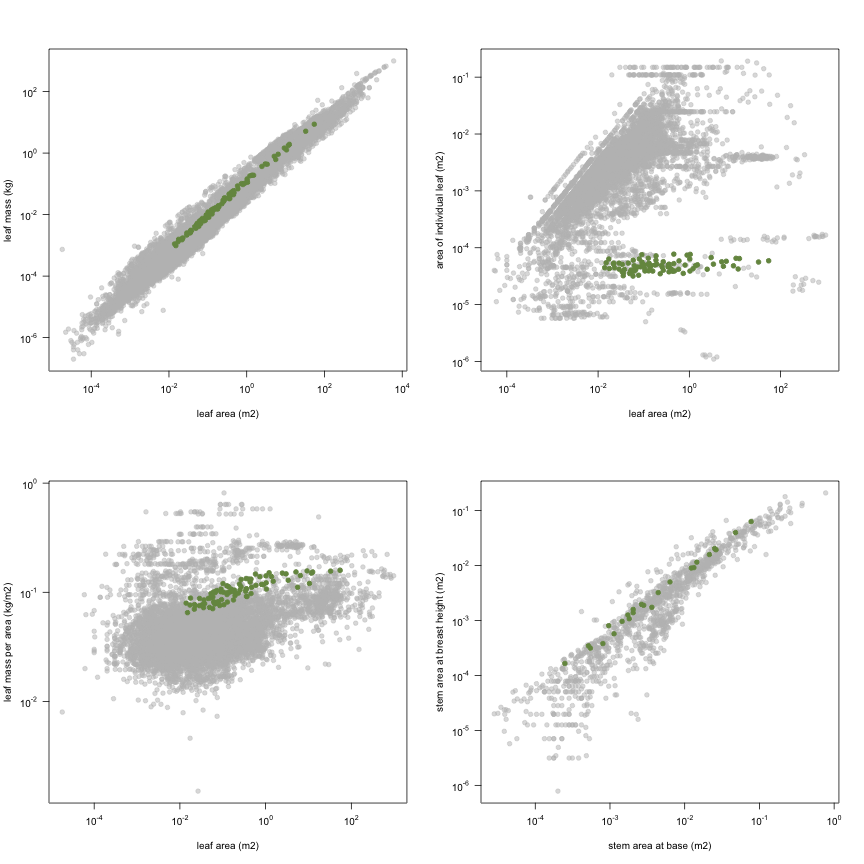
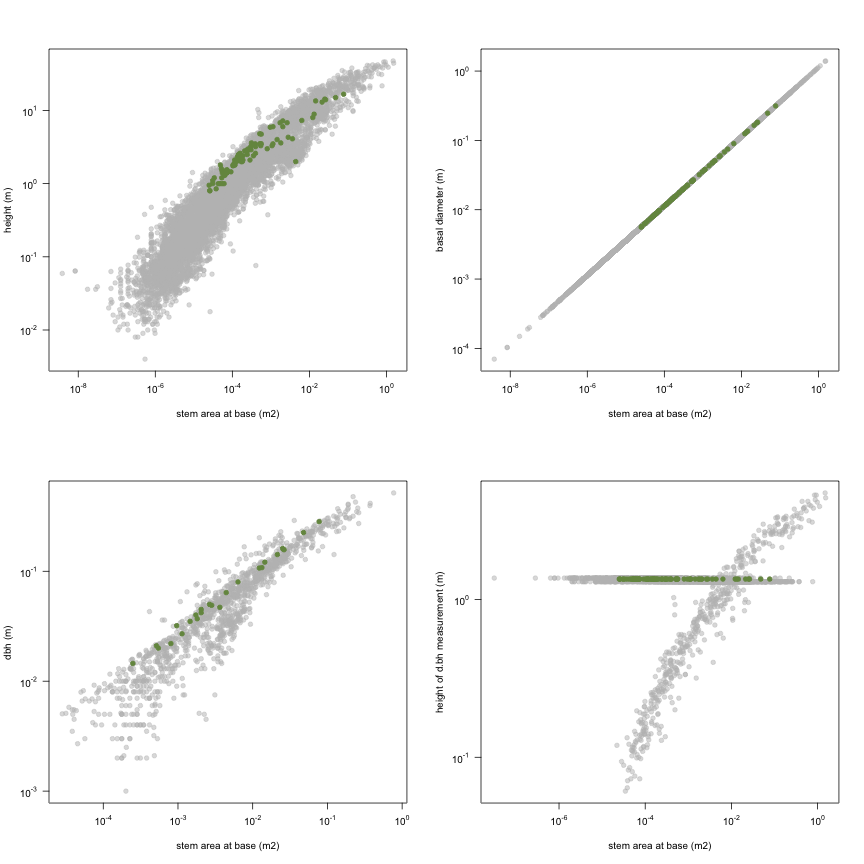
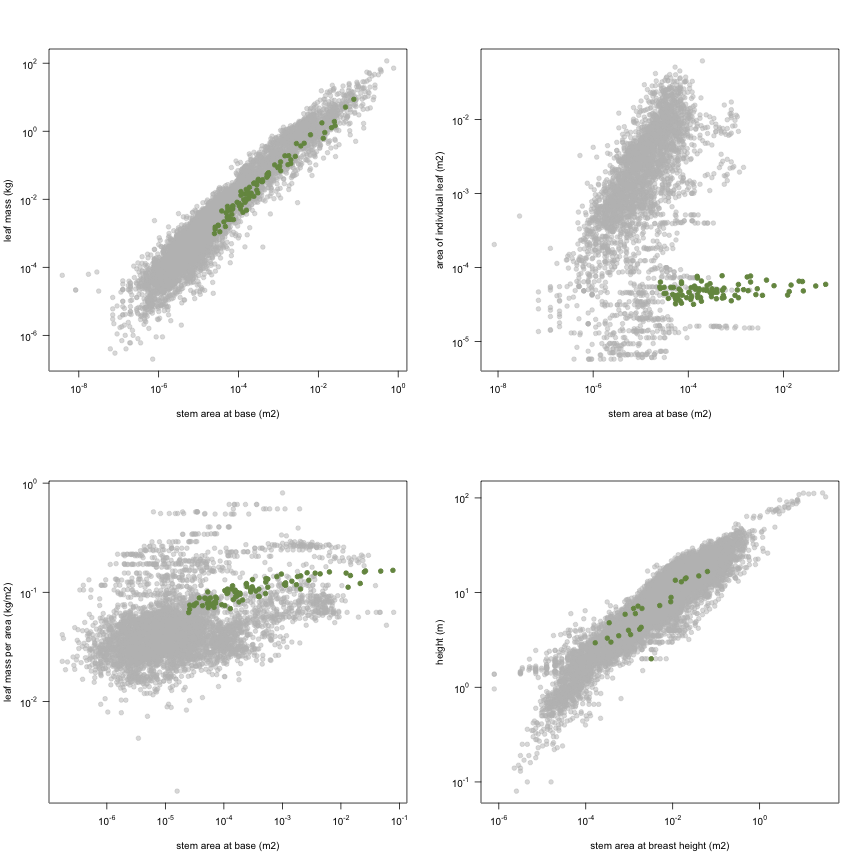
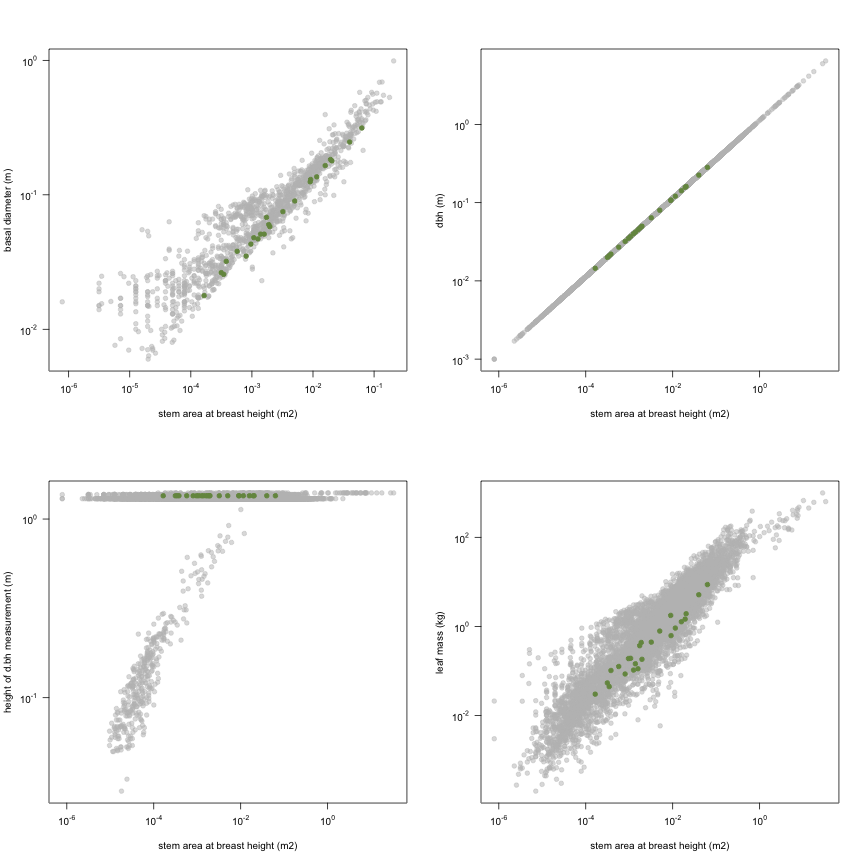
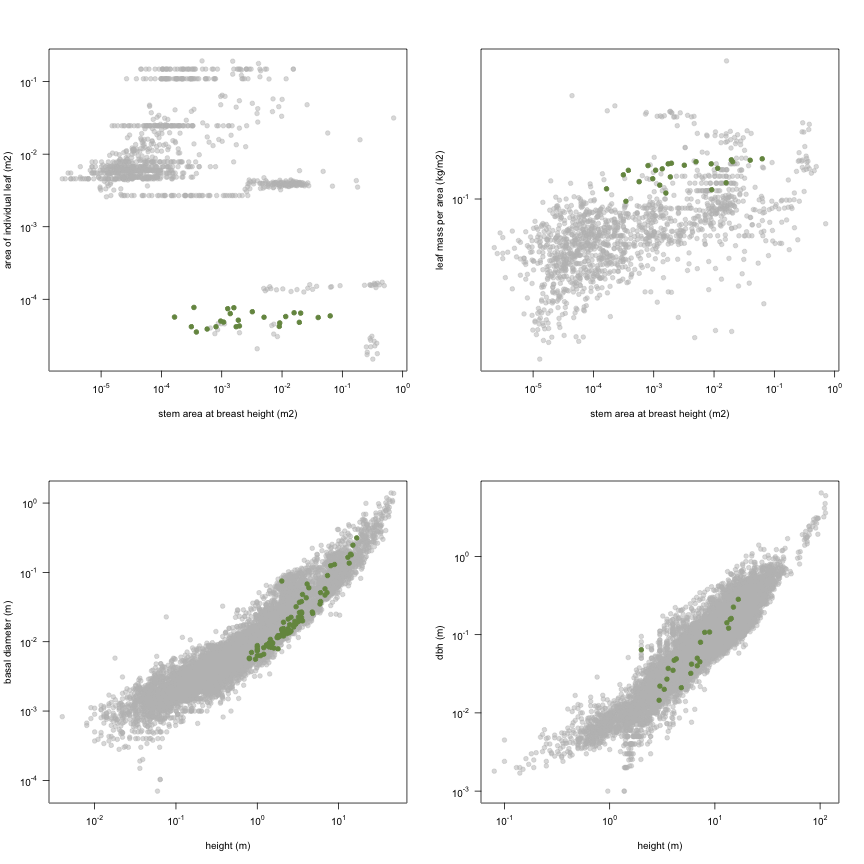
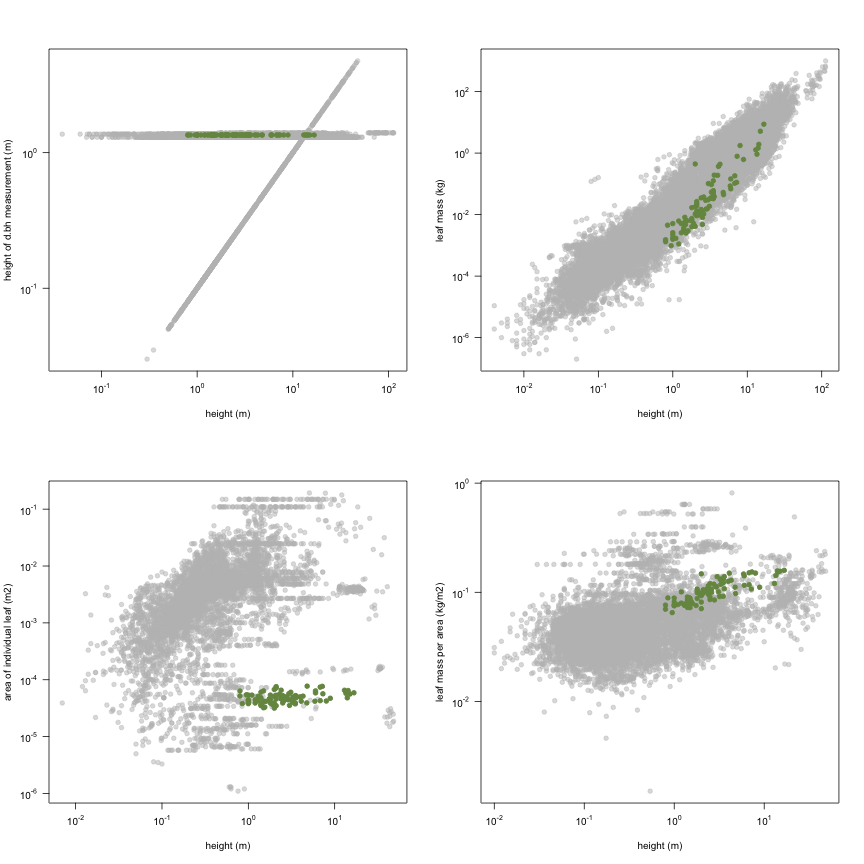
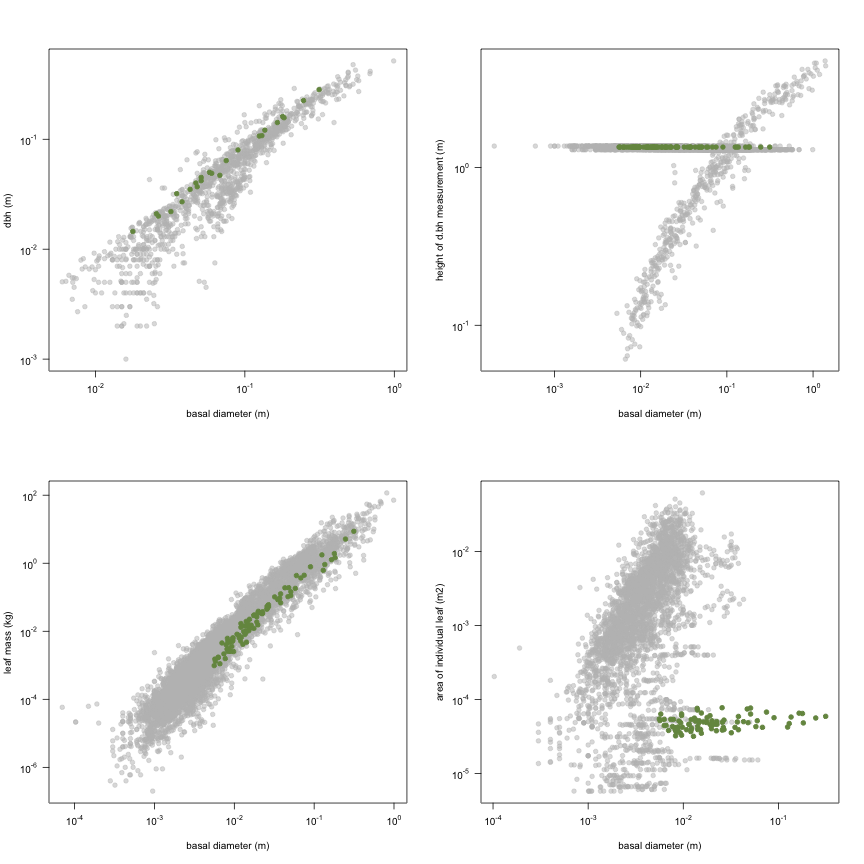
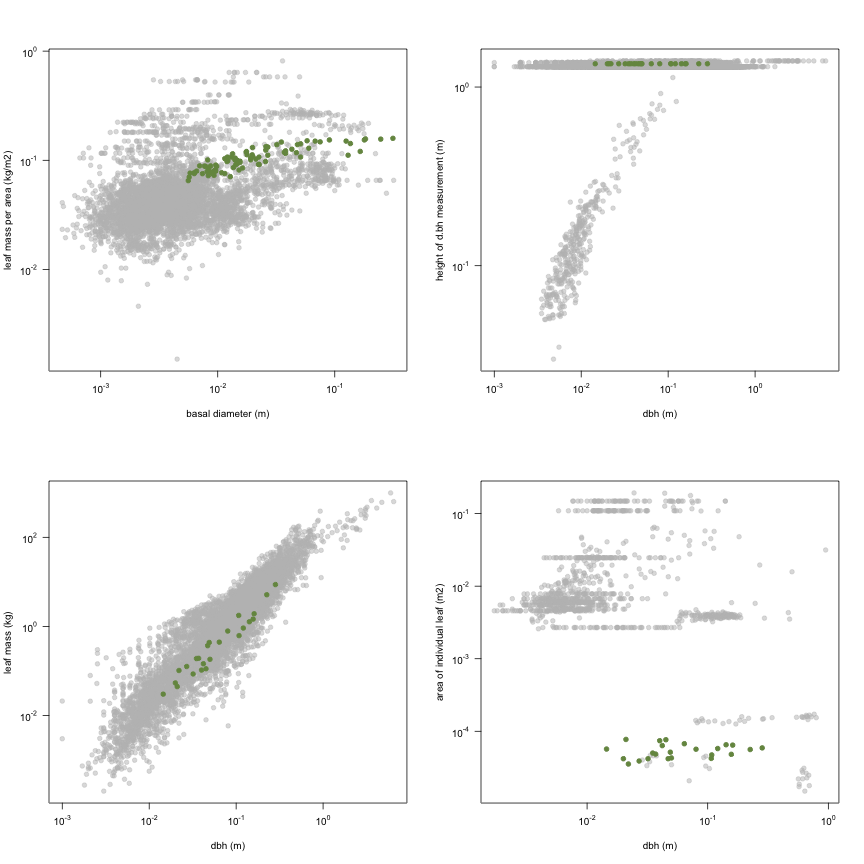
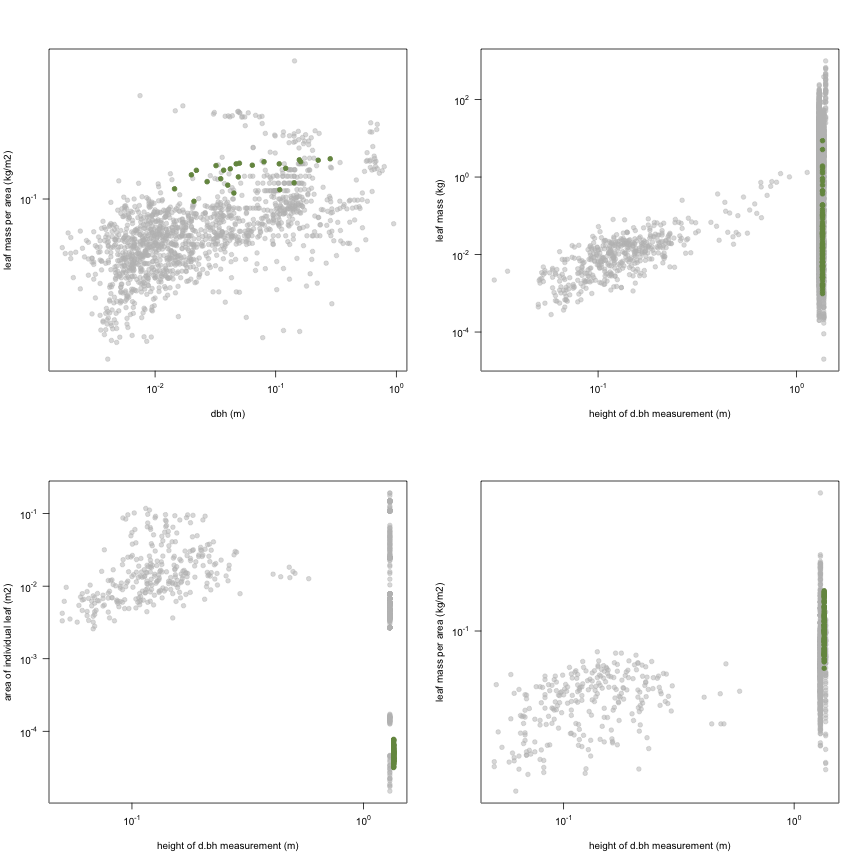
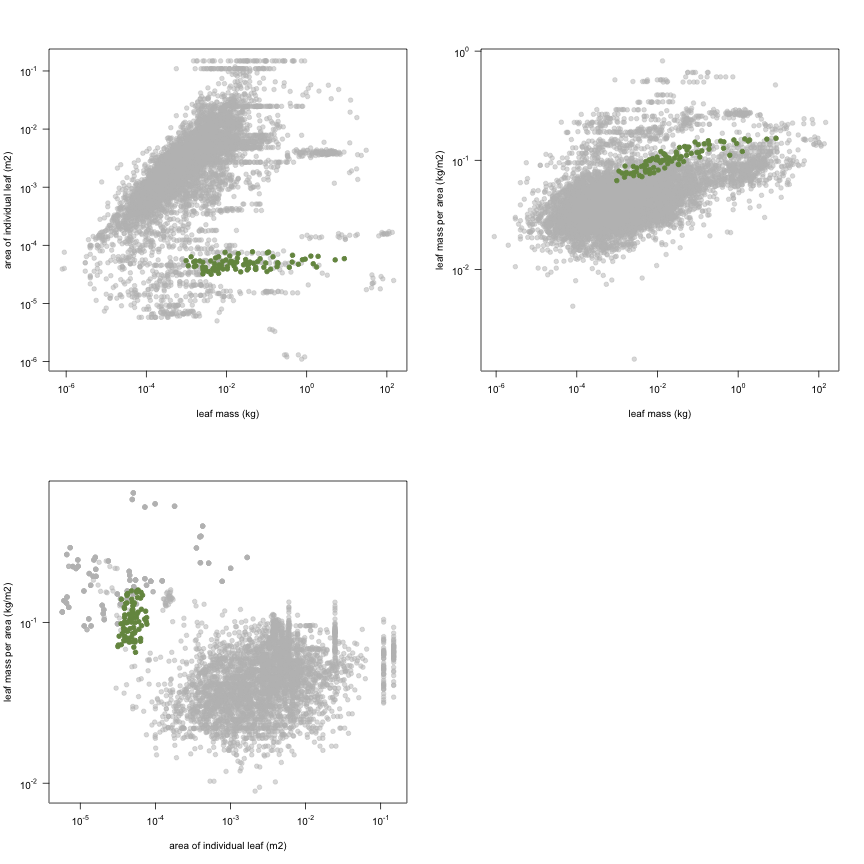
This is how the study Holdaway2008 fits in the entire dataset (grey). each colour represents a species. A legend of species names with colours is included at the end for reports with 1 < n < 20 species.