Domec2012
Data contributor: Jean-Christophe Domec
Email: [email protected]
Address:
- Bordeaux Sciences Agro, INRA ISPA UMR 1391, F‒33175, Gradignan, France
Citation: Domec J, Lachenbruch B, Pruyn M and Spicer R (2012). 'Effects of age-related increases in sapwood area, leaf area, and xylem conductivity on height-related hydraulic costs in two contrasting coniferous species.' Annals of Forest Science, 69(1), pp. 17-27.
DOI: 10.1007/s13595-011-0154-3
Abstract: Introduction Knowledge of vertical variation in hydraulic parameters would improve our understanding of individual trunk functioning and likely have important implications for modeling water movement to the leaves. Specifically, understanding how foliage area ( A l ), sapwood area ( A s ), and hydraulic specific conductivity ( k s ) vary with canopy position to affect leaf-specific conductivity ({LSC)} and whole-tree leaf-specific hydraulic conductance ( K l ) may explain some of the contrasting patterns of A l / A s reported in the literature. Objective The general aim of the study was to characterize and compare the aboveground relationships between cumulative A l , A s , and k s for two Pacific Northwest coniferous species with contrasting sapwood areas to give insight into size-related design of trees for water transport through changes in {LSC} and K l . Results The 230-year-old ponderosa pine ( Pinus ponderosa ) trees had slightly smaller basal diameters than the 102-year-old Douglas-fir ( Pseudostuga menziesii ) trees, but contained 85% sapwood at the base compared to 30% in Douglas-fir. At the tree base, there was no evidence that A l / A s decreased with tree age or with tree size. In both species, A l / A s of branches was significantly higher than A l / A s at the tree base, but it was not different from A l / A s measured in the trunks at the top of the tree. Douglas-fir had higher A l / A s at the base than did ponderosa pine (0.42 vs. 0.24 m 2 cm -2 ), similar patterns of change in A l / A s with height, and similar values of k s , such that {LSC} in Douglas-fir was 77% the value of {LSC} in ponderosa pine. Compensating changes to increase {LSC} between short and tall trees occurred through an increased in k s in tall trees but not through a reduction in A l . {LSC} increased logarithmically with branch path length or trunk path length whereas K l decreased significantly from top to base of old trees, but not between sections from old and young trees of similar cambial age. Conclusions Even though ponderosa pine had three times more sapwood than Douglas-fir, this study revealed a common relationship of declining K l with increasing tree height and diameter between the two species, within age classes and among trees. There was no compensating decrease in A l / A s as trees got taller, which showed that a homeostasis in K l was not maintained during growth. The trend of higher allocation of biomass to sapwood over leaves in ponderosa pine is consistent with this species' tendency to inhabit drier sites than Douglas-fir.
The dataset includes records for 53 individuals from 2 species belonging to 1 family(ies), presenting 1 functional type(s), growing in 1 condition(s) within 1 major type(s) of habitat, with data included for the following variables:
| Variable | Label | Units | N | Min | Median | Max |
|---|---|---|---|---|---|---|
| latitude | Latitude | deg | 53 | 41 | 43 | 45 |
| longitude | Longitude | deg | 53 | -123 | -123 | -120 |
| age | Age | yr | 53 | 5 | 72 | 314 |
| a.lf | Leaf area | m2 | 52 | 1.1 | 82 | 972 |
| a.ssbh | Sapwood area at breast height | m2 | 53 | 0.0006 | 0.037 | 0.33 |
| a.shbh | Heartwood area at breast height | m2 | 53 | 0 | 0.0017 | 0.2 |
| a.stbh | Stem area at breast height | m2 | 53 | 0.00065 | 0.064 | 0.49 |
| h.t | Height | m | 53 | 0.76 | 13 | 48 |
| h.c | Height to crown base | m | 53 | 0.12 | 3 | 37 |
| d.bh | Dbh | m | 53 | 0.029 | 0.28 | 0.79 |
| h.bh | Height of d.bh measurement | m | 53 | 1.3 | 1.3 | 1.3 |
| c.d | Crown depth | m | 53 | 0.28 | 7.6 | 17 |
| m.lf | Leaf mass | kg | 52 | 0.15 | 11 | 148 |
| a.ilf | Area of individual leaf | m2 | 53 | 0.000015 | 0.00013 | 0.00017 |
| ma.ilf | Leaf mass per area | kg m-2 | 53 | 0.089 | 0.14 | 0.24 |
| r.ss | Sapwood density | kg m-3 | 53 | 300 | 410 | 590 |
| r.sh | Heartwood density | kg m-3 | 53 | 310 | 370 | 500 |
And locally within the country:

The sites sampled are:
| Location | Longitude | Latitude | Vegetation |
|---|---|---|---|
| eastern side of the Oregon Cascade Range, USA on a private forestland (Crown Pacific Co.) | -122.72 | 43.53 | Temperate forest |
| eastern side of the Oregon Cascade Range, USA on a private forestland (Crown Pacific Co.) | -121.68 | 43.58 | Temperate forest |
| eastern side of the Oregon Cascade Range, USA on a private forestland (Crown Pacific Co.) | -120.07 | 42.23 | Temperate forest |
| Coast Range Oregon, USA | -123.35 | 42.95 | Temperate forest |
| Coast Range Roseburg Oregon, USA | -123.21 | 41.18 | Temperate forest |
| Coastal Range Corvallis Oregon, USA | -123.23 | 44.65 | Temperate forest |
The growing conditions of sampled plants was:
| Location | growingCondition |
|---|---|
| eastern side of the Oregon Cascade Range, USA on a private forestland (Crown Pacific Co.) | field wild |
| Coast Range Oregon, USA | field wild |
| Coast Range Roseburg Oregon, USA | field wild |
| Coastal Range Corvallis Oregon, USA | field wild |
| Species | Family | Pft |
|---|---|---|
| Pinus ponderosa | Pinaceae | evergreen gymnosperm |
| Pseudotsuga menziesii | Pinaceae | evergreen gymnosperm |
Sampling strategy: Five age classes of Douglas-fir and 4 age classes of ponderosa pine were studied. Locations with different impacts (natal regeneration, planted thinned, planted) across the state of Oregon were sampled. Trees were felled and had the center of the internodes marked. Internodes were just distal to branch whorls at increasing number of nodes.
Leaf area: Out of >250-600 trees (depending on the age class), 12 trees by age class were randomly selected for destructive sampling of leaf area. Foliage attached to and distal to each segment was collected to determine leaf dry mass, and subsampled to determine leaf area/dry mass conversions (specific leaf area). Total leaf area was then calculated from the total dry mass and the specific leaf area. For the old-growth trees we kept 25% of the mass in all zones and for the saplings, intermediate and younger trees we saved 100% of the mass in all zones, but processed the samples identically to the old trees
Stem cross sectional area: NA
Height: After the trees were felled, total tree heights and base of the live crown heights were measured as the vertical distance from the ground.
Traits: Specific leaf area: For Douglas-fir needles, the projected area of fresh foliage samples was determined using a video camera and NIH Image version 1.52 (public domain software). The projected area of each ponderosa pine needle was measured using a digital caliper, and assuming that all three needles of each fascicle represent a cylinder. The samples were then dried and weighed to establish the specific leaf area (SLA = the inverse of leaf mass per area) corresponding to fresh area to dry mass ratios.
Year collected: 1998-2000
Acknowledgements: This work was funded by the Department of Energy TES Program and by Department of Agriculture AFRI-NIFA program
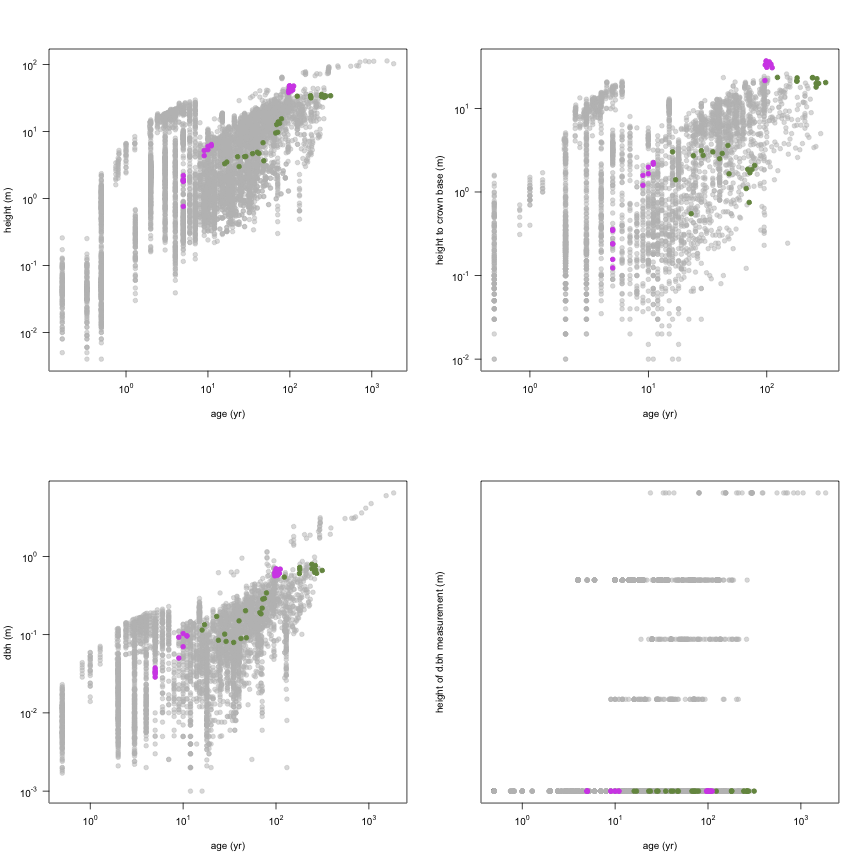
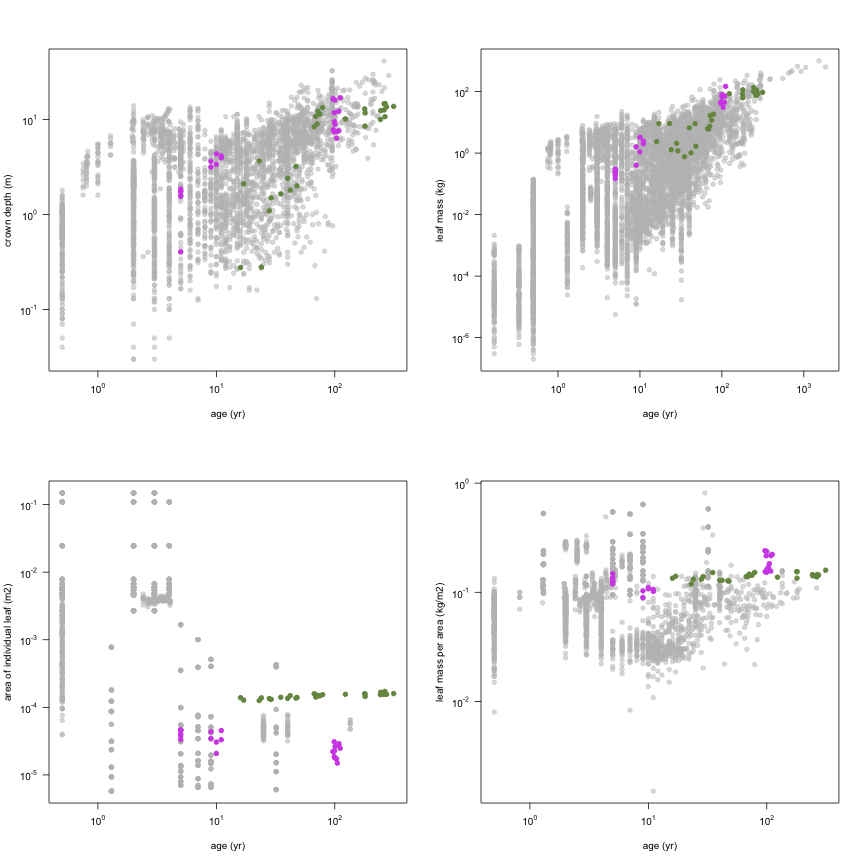
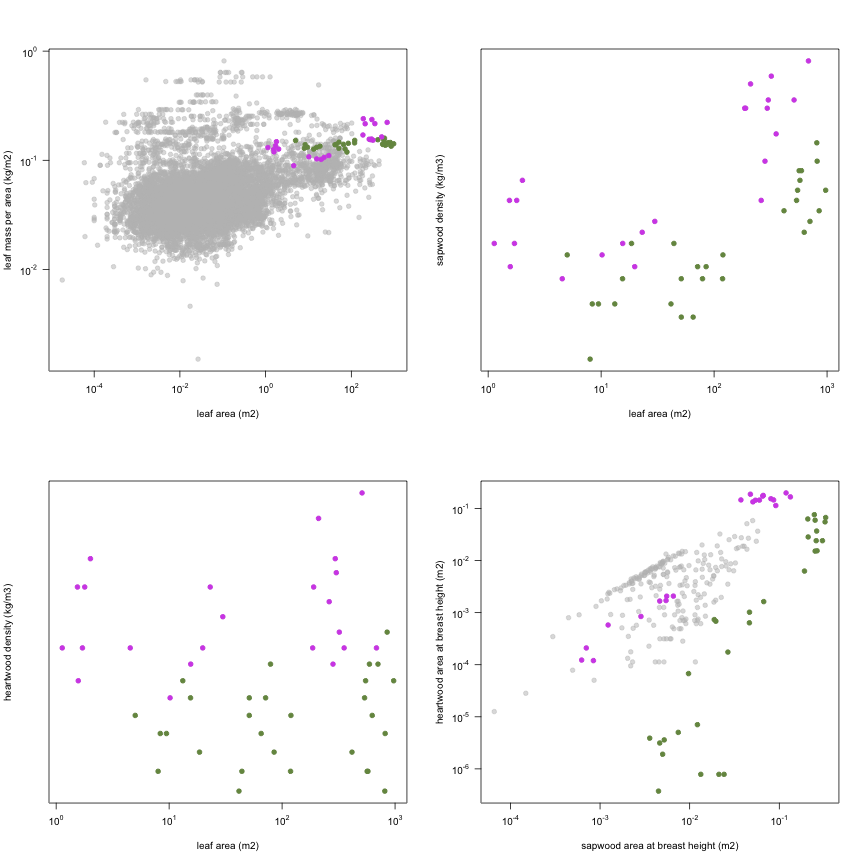
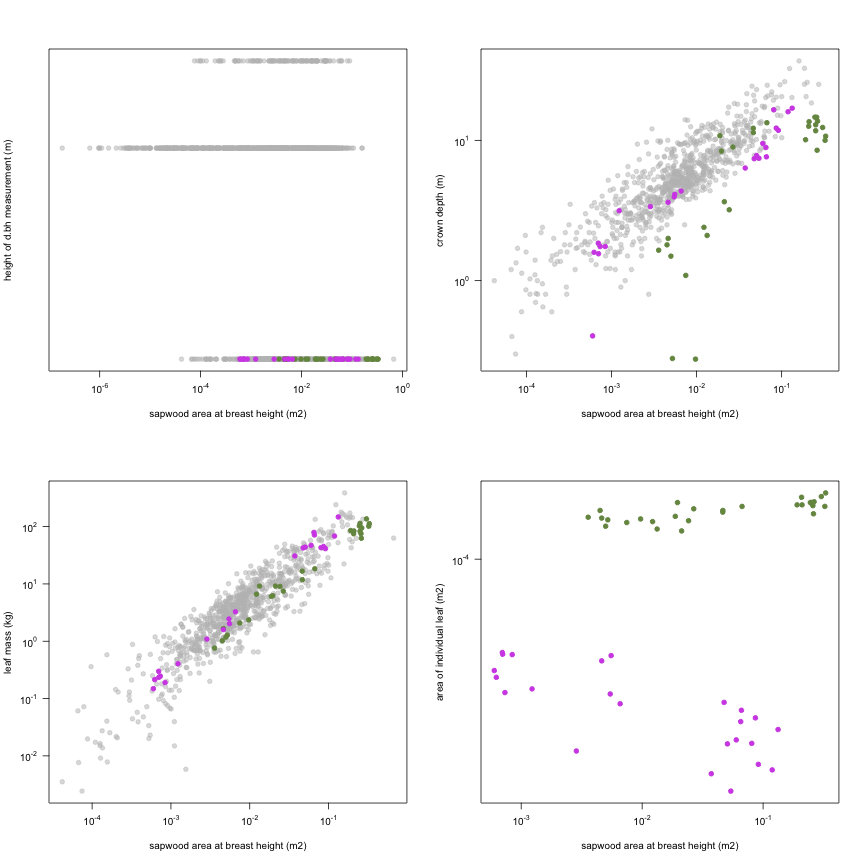
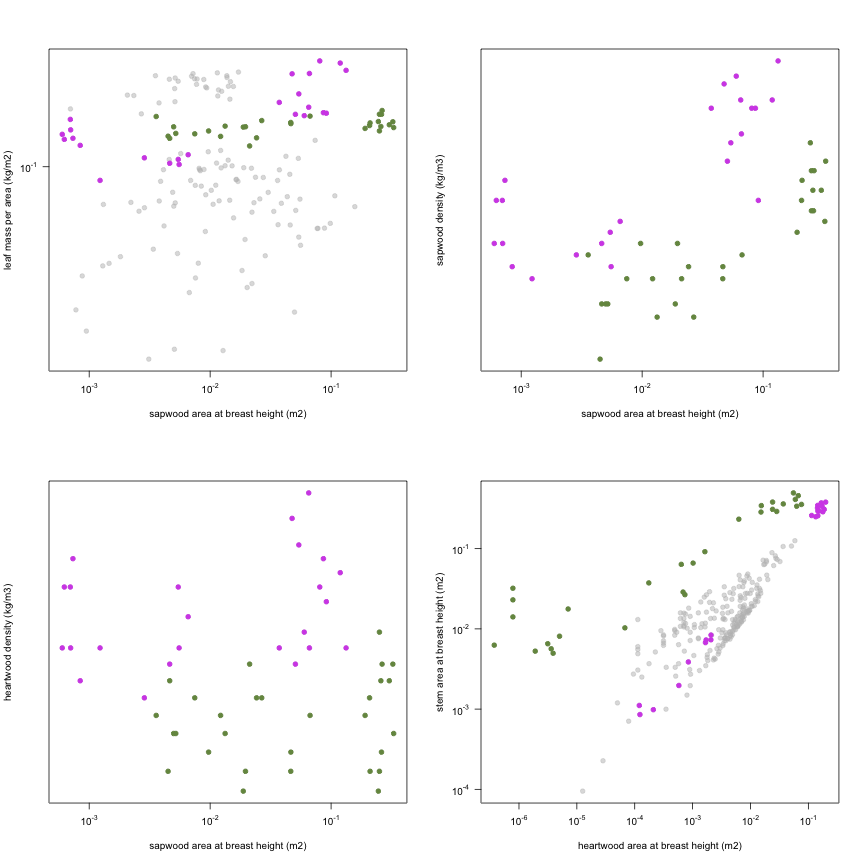
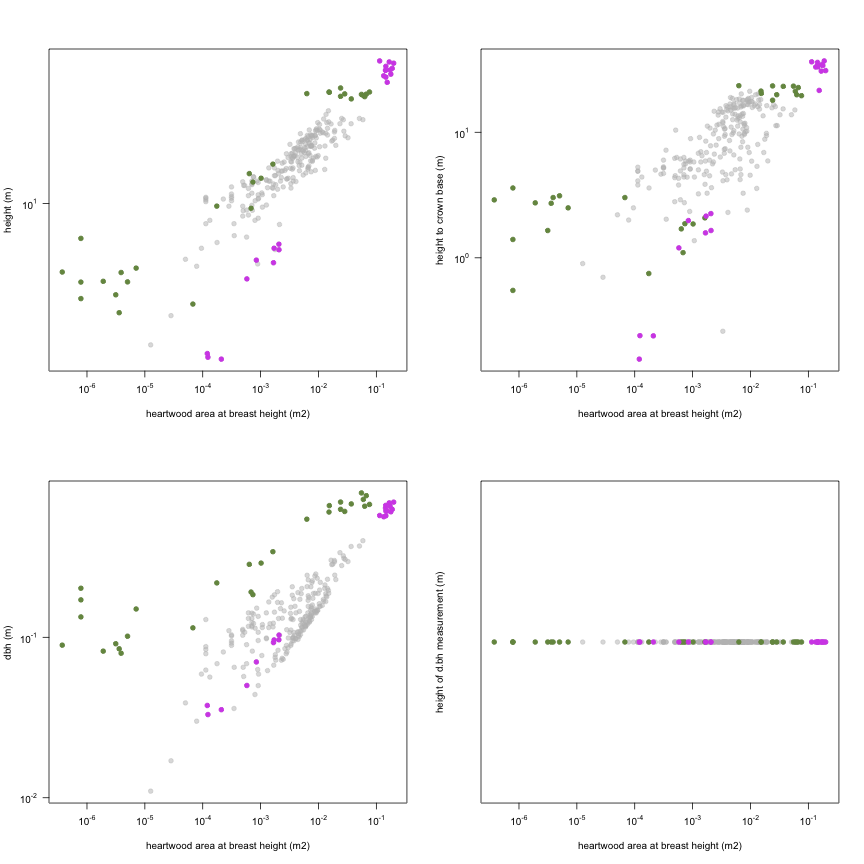
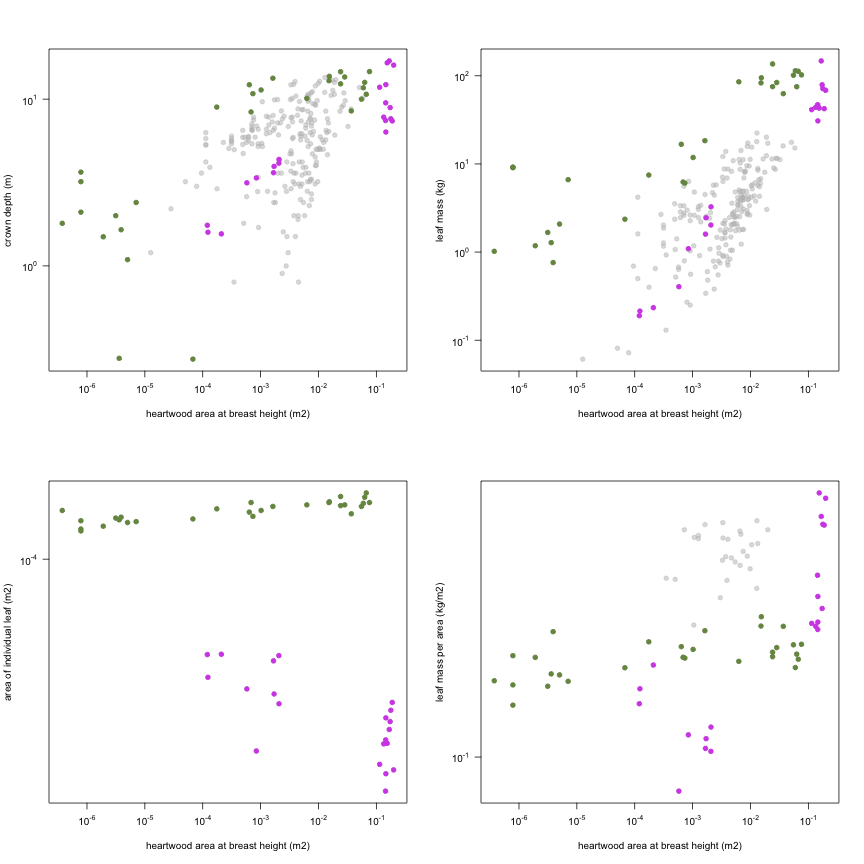
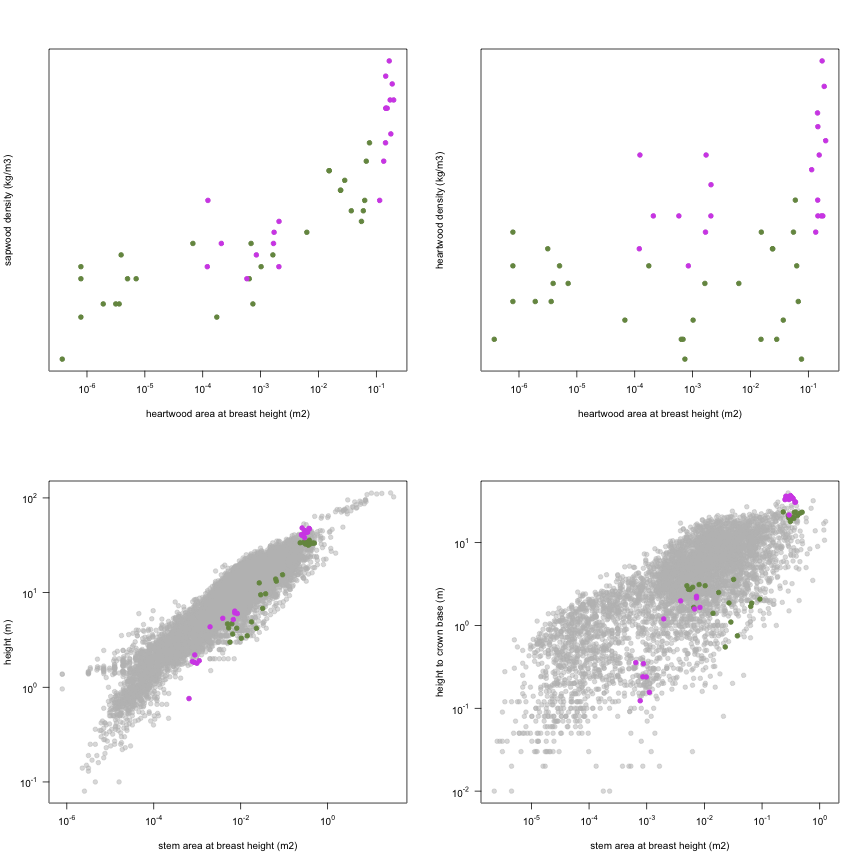
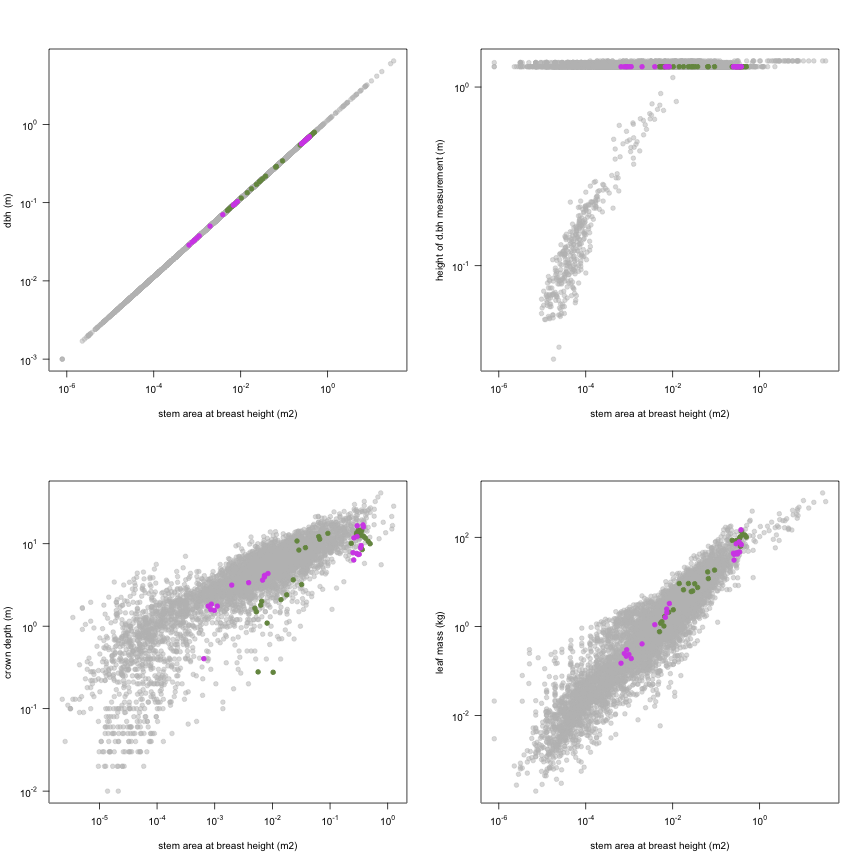
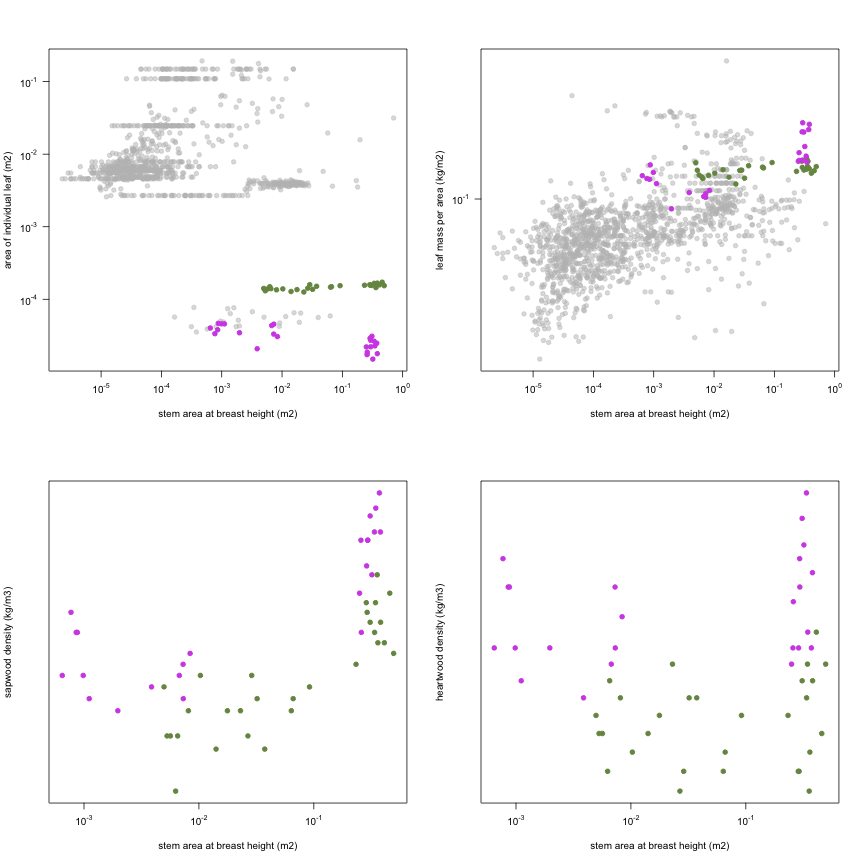
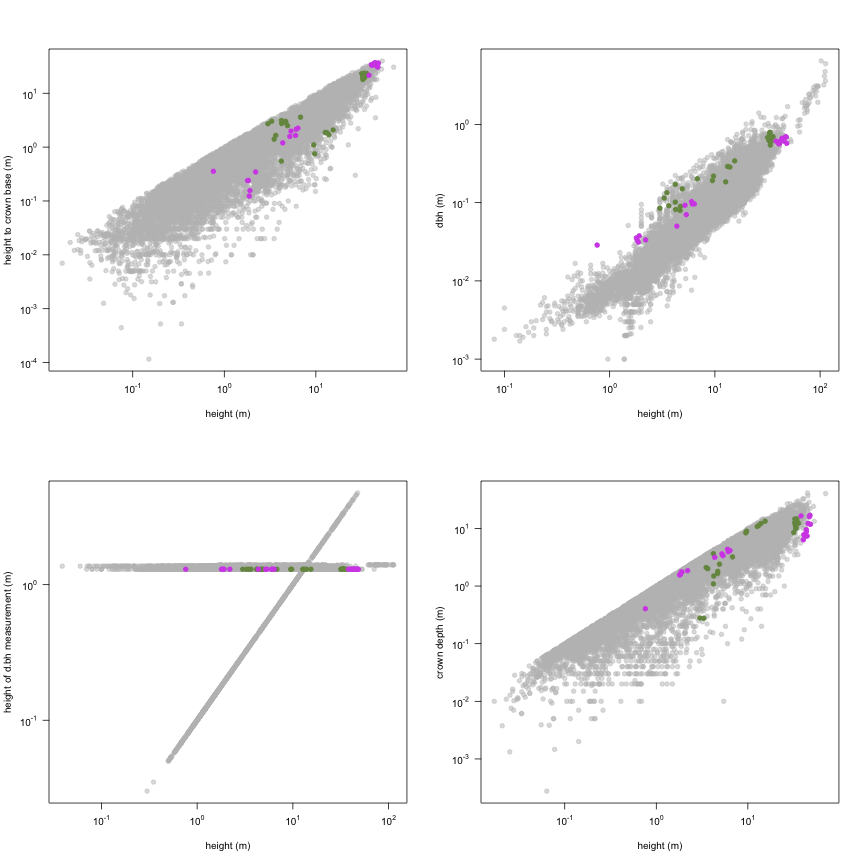
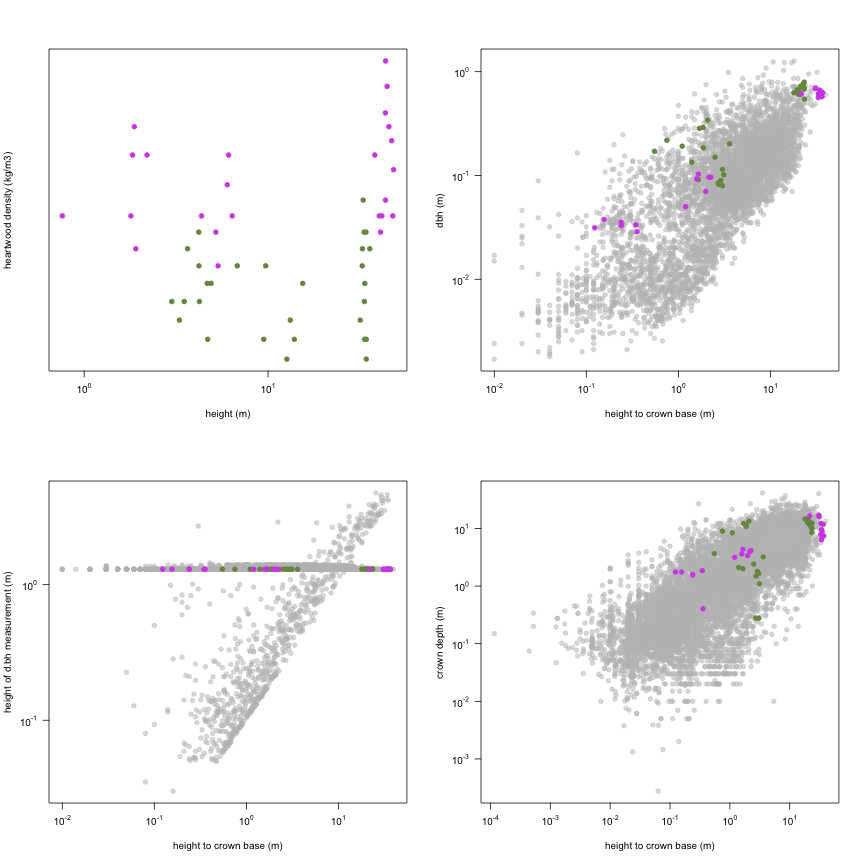
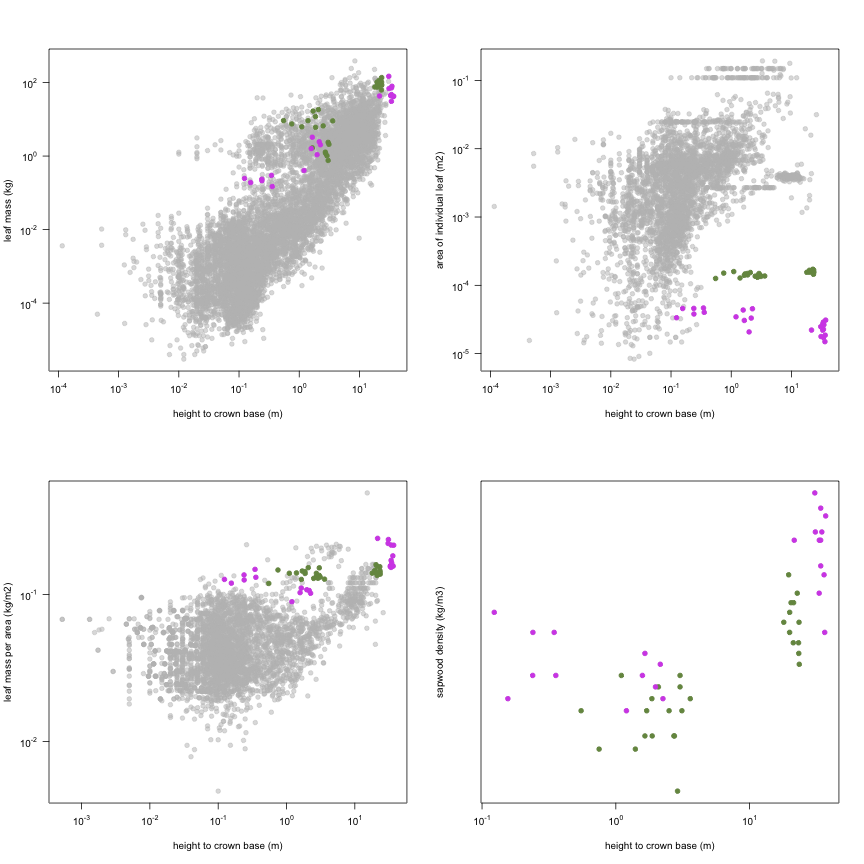
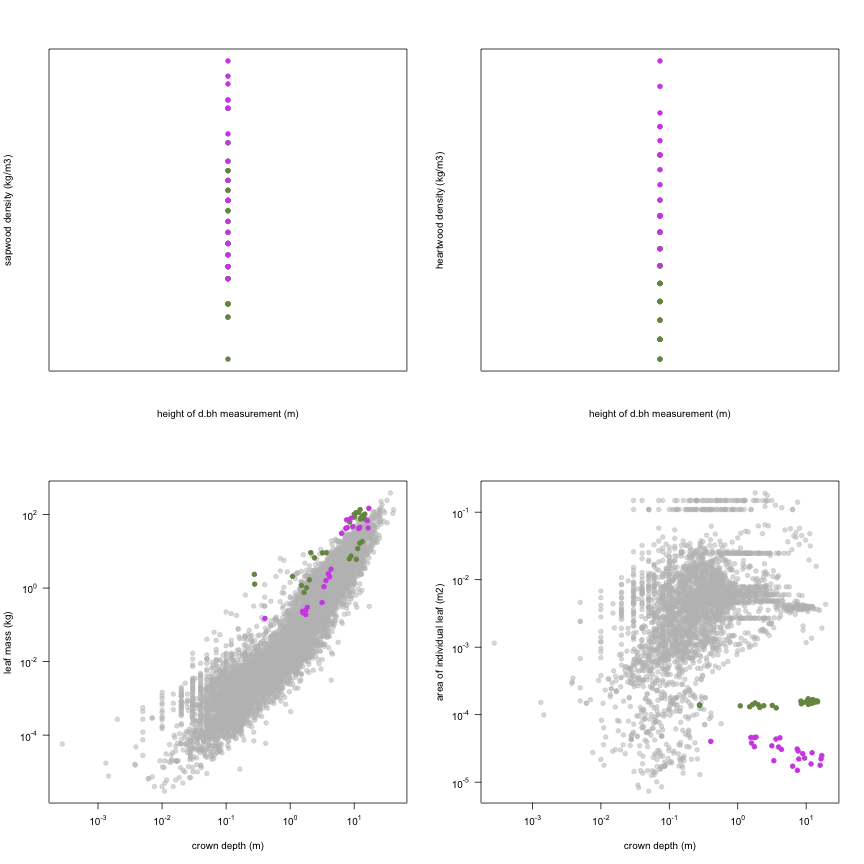
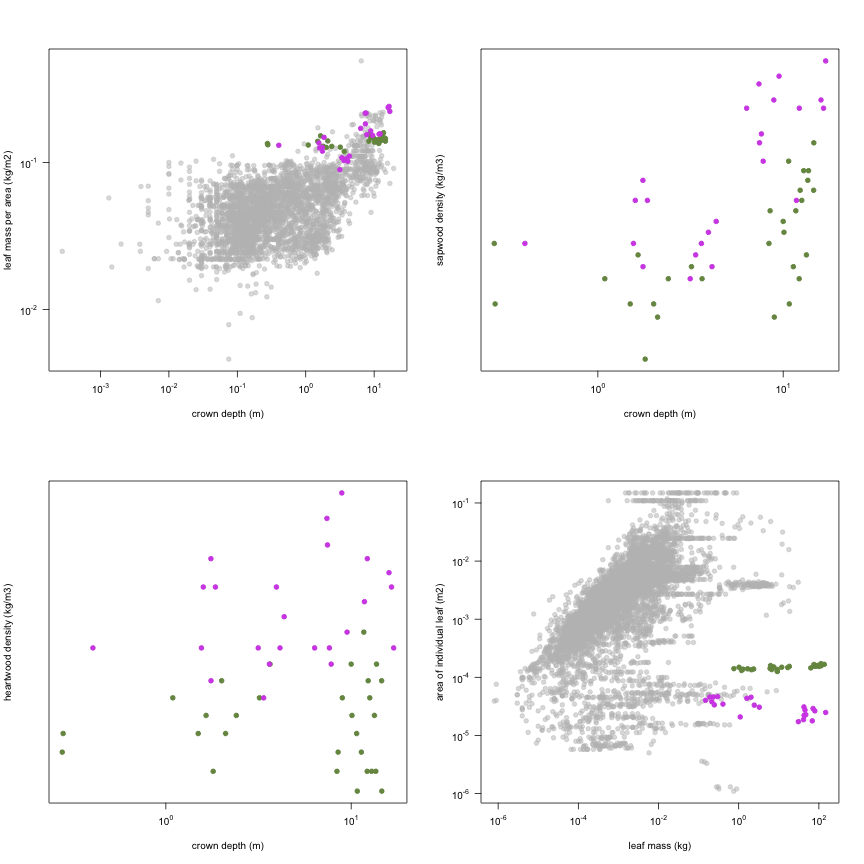
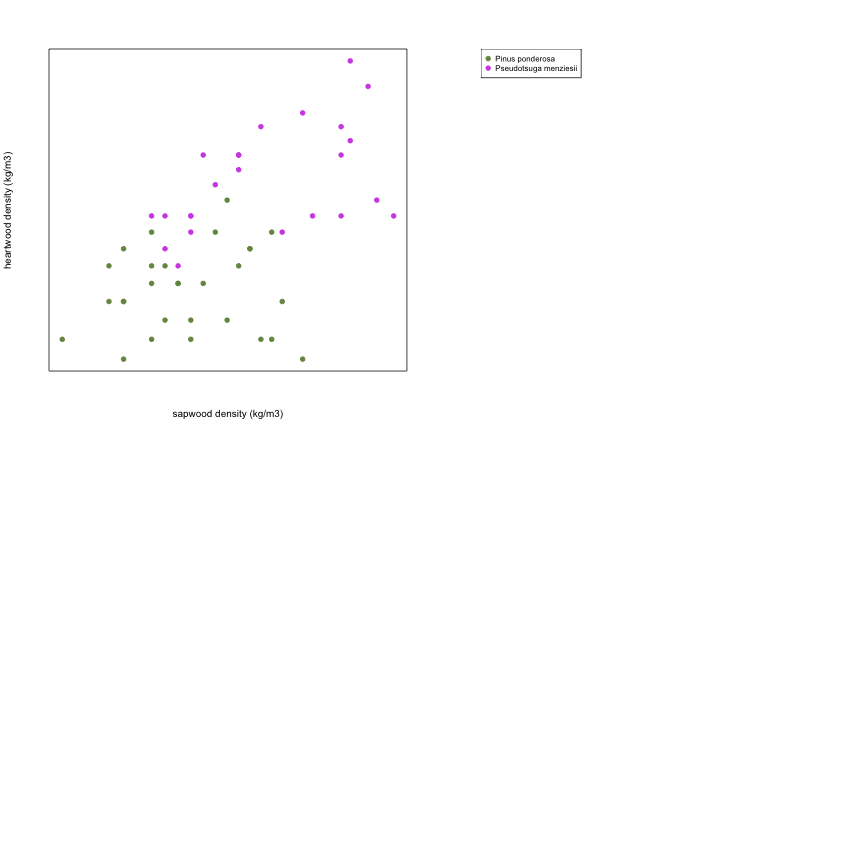
This is how the study Domec2012 fits in the entire dataset (grey). each colour represents a species. A legend of species names with colours is included at the end for reports with 1 < n < 20 species.