Lusk2013
Data contributor: Christopher H. Lusk
Email: [email protected]
Address:
- School of Science, University of Waikato, Private 3105, Hamilton, New Zealand
Citation: Lusk CH, Kaneko T, Grierson E and Clearwater M (2013). 'Correlates of tree species sorting along a temperature gradient in New Zealand rain forests: seedling functional traits, growth and shade tolerance.' Journal of Ecology, 101(6), pp. 1531-1541.
Abstract: * It is widely believed that species sorting on environmental gradients reflects trade-offs between competitive ability and physiological tolerance of stresses such as frost and desiccation. One specific expression of this general idea is the hypothesis that tree species sorting on temperature gradients in temperate regions involves a trade-off between growth rate and frost resistance, because adaptations to frost reduce light interception and carbon gain potential. * We measured seedling growth of 17 New Zealand rain forest angiosperm trees in a glasshouse, as well as biomass partitioning, gas exchange and hydraulic traits. We then related these variables to the mean July (winter) minimum temperatures most frequently experienced throughout the range of each species. * Species associated with mild winters on average had wider vessels and more conductive stems and were leafier (i.e. developed more foliage area per unit sapwood area) than species from frostier sites. Species' positions on the temperature gradient were not significantly correlated with relative growth rates of seedlings; they were, however, negatively correlated with two measures of species light requirements in the field: the light compensation point for growth, and low-light mortality rates obtained from the literature. * Synthesis. Although seedling growth rates of warm- and cool-temperate New Zealand angiosperm trees were similar on average, the former are more shade tolerant. Competitive hierarchies associated with tree species sorting on temperature gradients thus probably involve a shift in the relationship between shade tolerance and growth rate, rather than a simple trade-off of growth with cold tolerance. This shift is associated with variation in light interception potential per unit of seedling biomass, possibly reflecting a trade-off between stem conductivity and resistance to freeze-thaw embolism.
The dataset includes records for 134 individuals from 17 species belonging to 13 family(ies), presenting 1 functional type(s), growing in 1 condition(s) within 1 major type(s) of habitat, with data included for the following variables:
| Variable | Label | Units | N | Min | Median | Max |
|---|---|---|---|---|---|---|
| latitude | Latitude | deg | 134 | -38 | -38 | -38 |
| longitude | Longitude | deg | 134 | 175 | 175 | 175 |
| a.lf | Leaf area | m2 | 134 | 0.0028 | 0.045 | 0.22 |
| a.stba | Stem area at base | m2 | 47 | 0.000011 | 0.000031 | 0.00013 |
| a.cp | Crown area | m2 | 47 | 0.021 | 0.093 | 0.3 |
| a.cs | Crown surface area | m2 | 47 | 0.061 | 0.36 | 1.2 |
| h.t | Height | m | 134 | 0.16 | 0.39 | 1 |
| h.c | Height to crown base | m | 47 | 0 | 0.064 | 0.31 |
| d.ba | Basal diameter | m | 47 | 0.0038 | 0.0063 | 0.013 |
| d.cr | Crown width | m | 47 | 0.16 | 0.34 | 0.62 |
| c.d | Crown depth | m | 47 | 0.16 | 0.41 | 1 |
| m.lf | Leaf mass | kg | 134 | 0.00031 | 0.0039 | 0.013 |
| m.st | Total stem mass | kg | 134 | 0.00031 | 0.0027 | 0.013 |
| m.so | Aboveground mass | kg | 134 | 0.00087 | 0.0069 | 0.026 |
| m.rt | Total root mass | kg | 43 | 0.00037 | 0.0011 | 0.015 |
| m.to | Total mass | kg | 43 | 0.0013 | 0.0034 | 0.04 |
| a.ilf | Area of individual leaf | m2 | 47 | 0.000071 | 0.00088 | 0.0038 |

And locally within the country:

The sites sampled are:
| Location | Longitude | Latitude | Vegetation |
|---|---|---|---|
| Glasshouse in New Zealand | 175.3139 | -37.7869 |
The growing conditions of sampled plants was:
| Location | growingCondition |
|---|---|
| Glasshouse in New Zealand | glasshouse |
| Species | Family | Pft |
|---|---|---|
| Beilschmiedia tarairi | Lauraceae | evergreen angiosperm |
| Beilschmiedia tawa | Lauraceae | evergreen angiosperm |
| Dysoxylum spectabile | Meliaceae | evergreen angiosperm |
| Elaeocarpus dentatus | Elaeocarpaceae | evergreen angiosperm |
| Griselinia littoralis | Cornaceae | evergreen angiosperm |
| Knightia excelsa | Proteaceae | evergreen angiosperm |
| Laurelia novaezelandiae | Atherospermataceae | evergreen angiosperm |
| Litsea calicaris | Lauraceae | evergreen angiosperm |
| Melicytus ramiflorus | Violaceae | evergreen angiosperm |
| Metrosideros umbellata | Myrtaceae | evergreen angiosperm |
| Nestegis cunninghamii | Oleaceae | evergreen angiosperm |
| Nothofagus menziesii | Nothofagaceae | evergreen angiosperm |
| Nothofagus solandri var cliffortioides | Nothofagaceae | evergreen angiosperm |
| Nothofagus truncata | Nothofagaceae | evergreen angiosperm |
| Vitex lucens | Verbenaceae | evergreen angiosperm |
| Weinmannia racemosa | Cunionaceae | evergreen angiosperm |
| Weinmannia silvicola | Cunionaceae | evergreen angiosperm |
Sampling strategy: We obtained 200 - 350 mm tall seedlings from commercial sources and grew them in a glasshouse for 105 days. Crown architecture of each seedling was recorded using a using a FASTRAK 3D-digitizer (Polhemus, Colchester, VT, USA), in conjunction with the software package FLORADIG (CSIRO Entomology, Brisbane, Australia). YPCONVERT, developed by Daniel Falster, was used to convert architecture files to a format compatible with YPLANT.
Leaf area: The total foliage area of each plant was measured using a LI-3100 leaf Area Meter
Stem cross sectional area: Basal stem diameter (immediately above any root flanges) was measured on two orthogonal axis, using electronic callipers.
Height: Height was measured as the length of the longest stem, from the ground to the apex.
Crown area: Crown area was computed from the plant architecture data obtained using the 3D digitizer.
Biomass: Only aboveground biomass was harvested. Plants were divided into stem and leaf fractions and then dried to a constant weight. Petioles of simple leaves were included in total leaf mass. Petioles of compound leaves were included in the stem fraction.
Traits: Note that only aboveground biomass was harvested.
Growth environment: Nursery-sourced plants grown in glasshouse with ~ 20% light.
Other variables: Relative growth rates of stem height and volume were measured. Transverse sections were taken from base of each stem to measure vessel diameters and densities. Theoretical sapwood conductivity was then computed from the xylem anatomy data. Actual measurements of sapwood conductivity were also carried out.
Year collected: 2011-2012
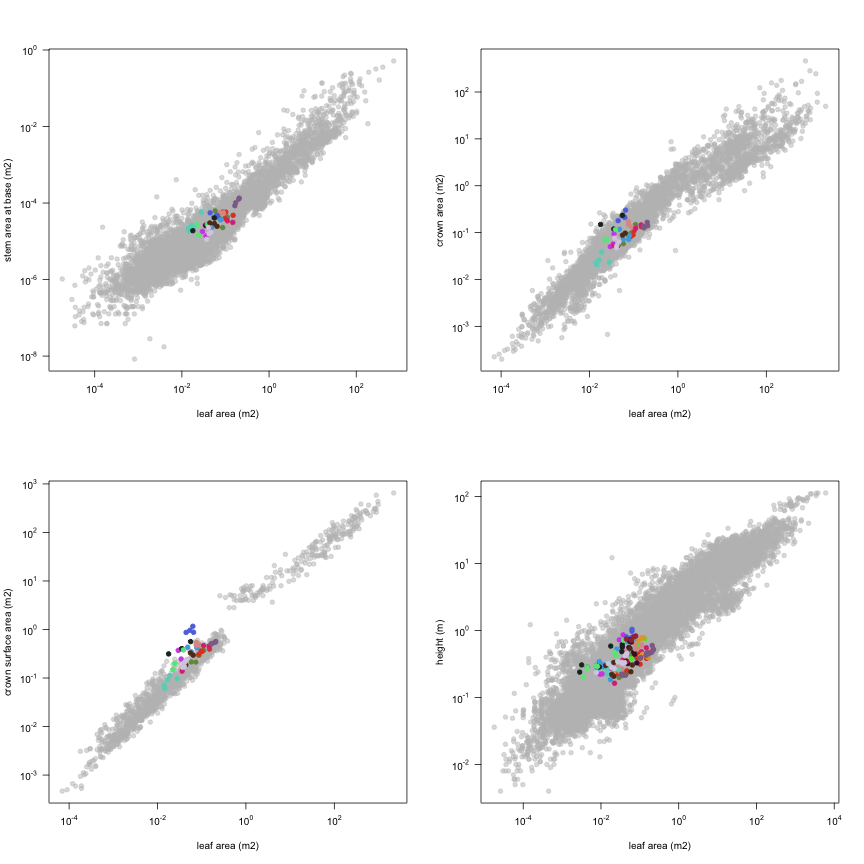
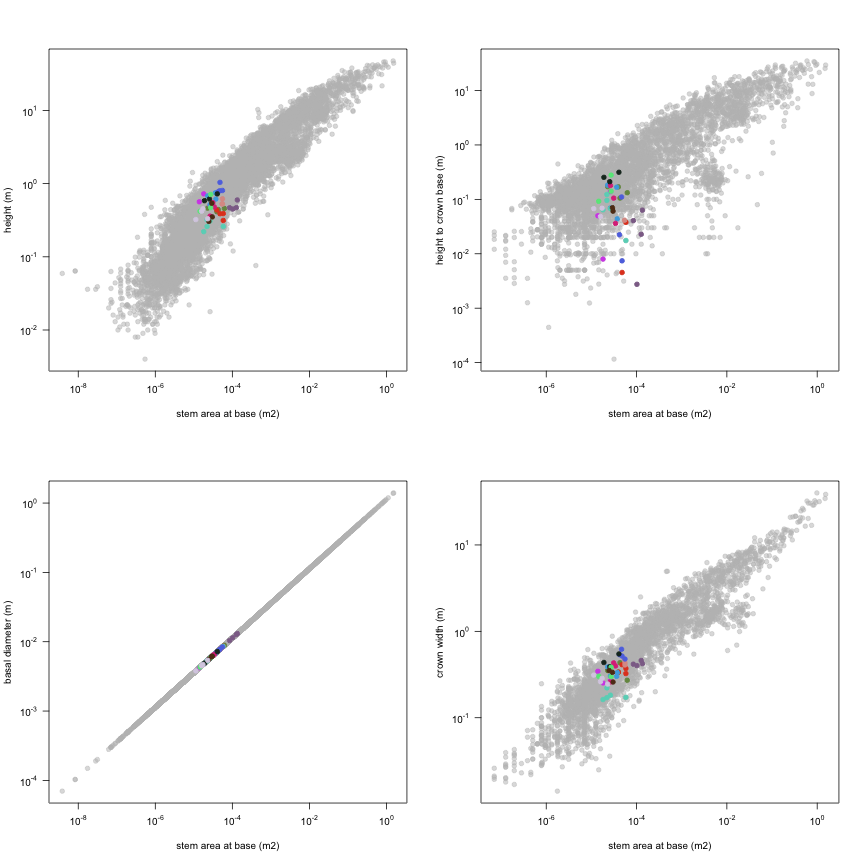
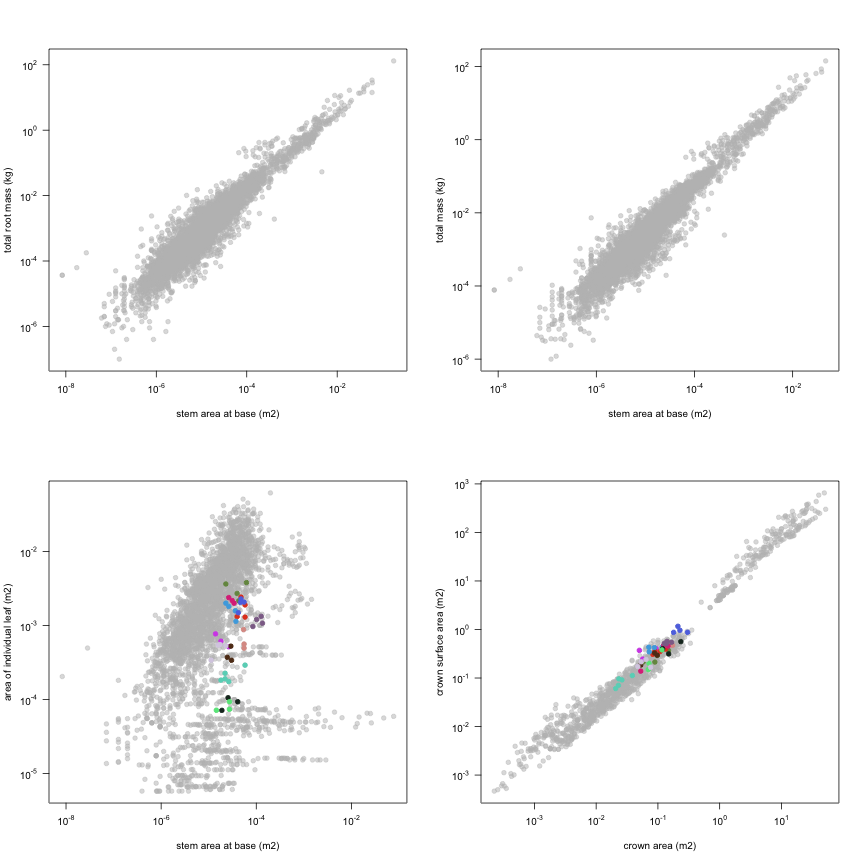
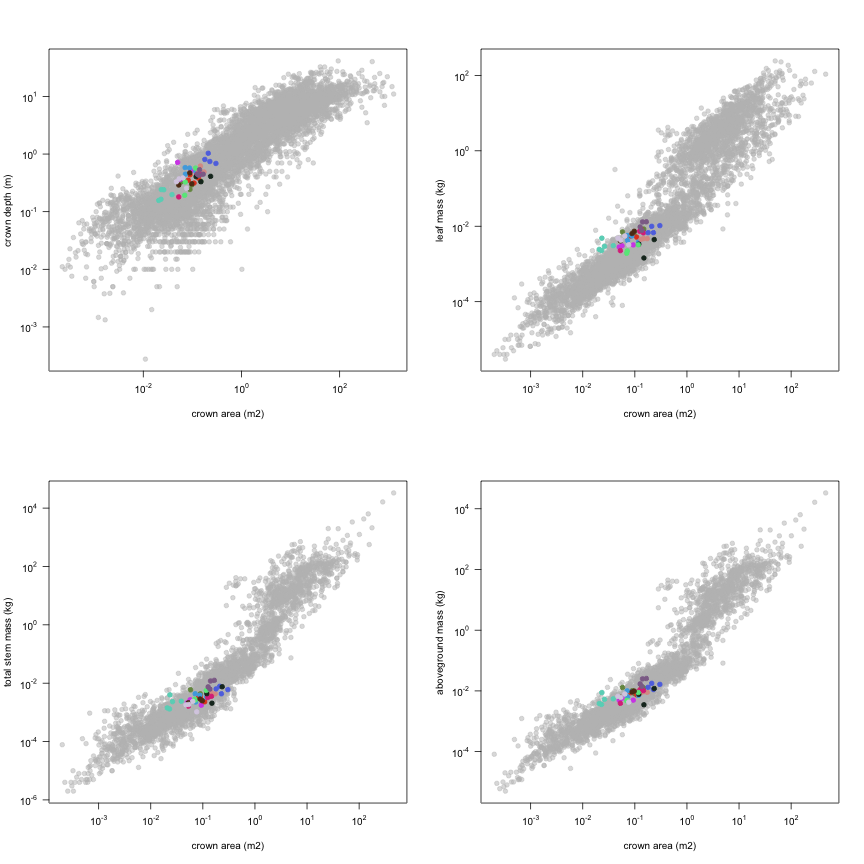
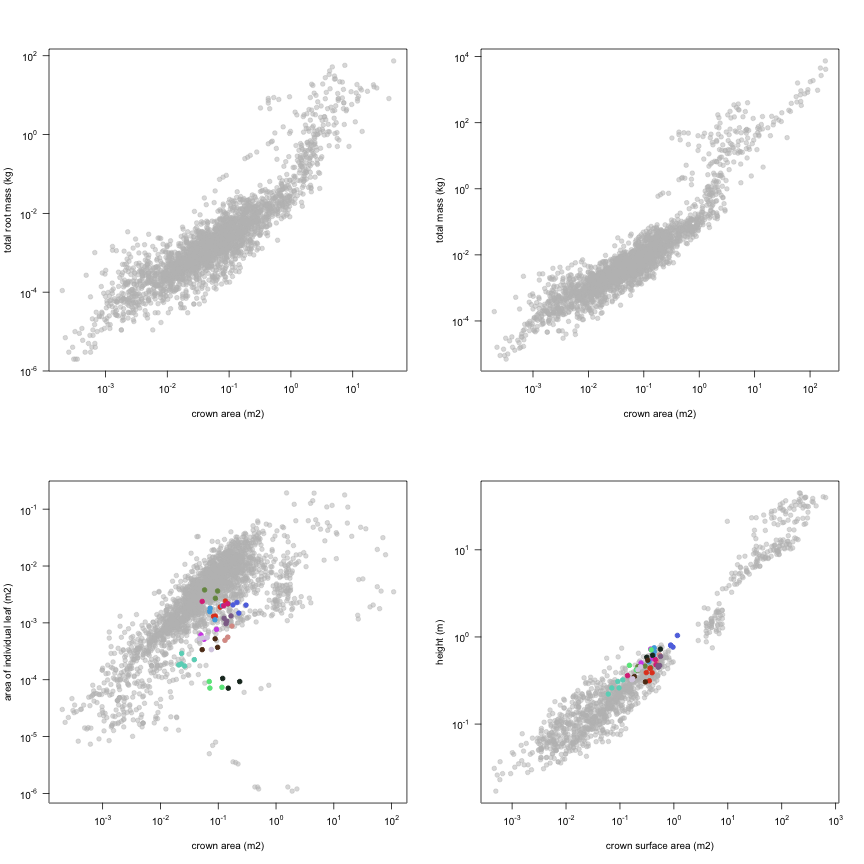
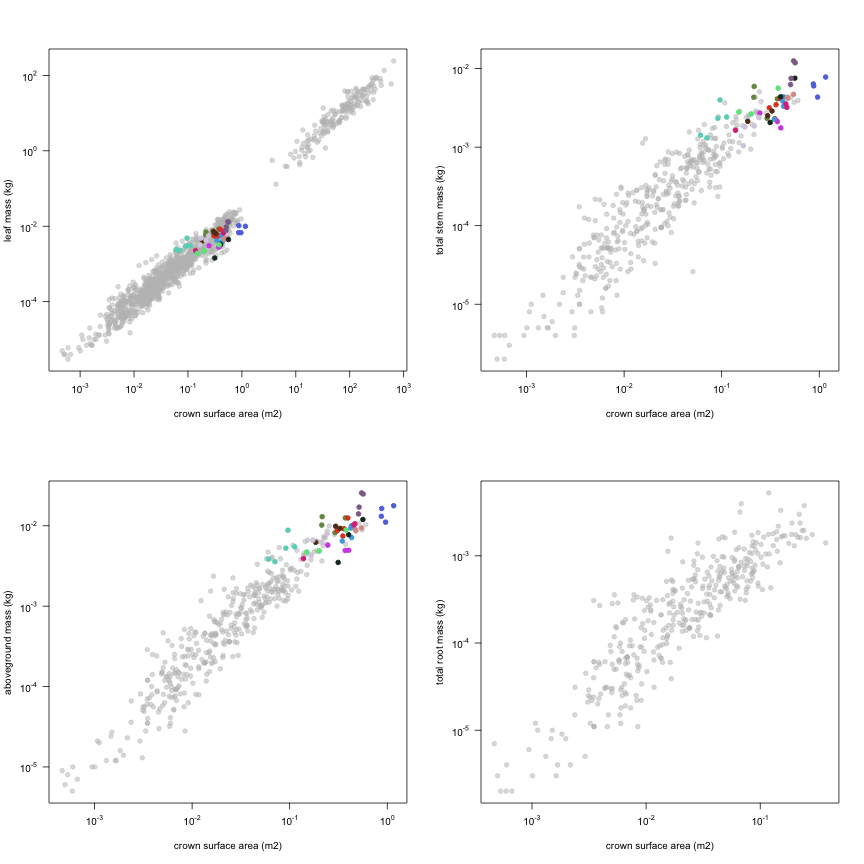
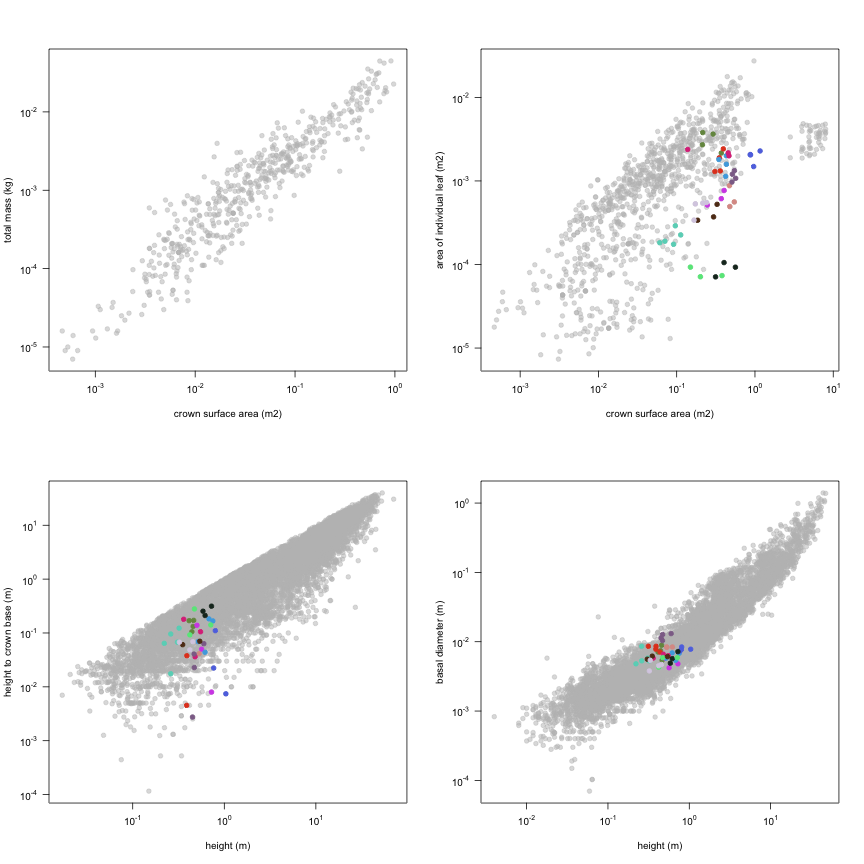
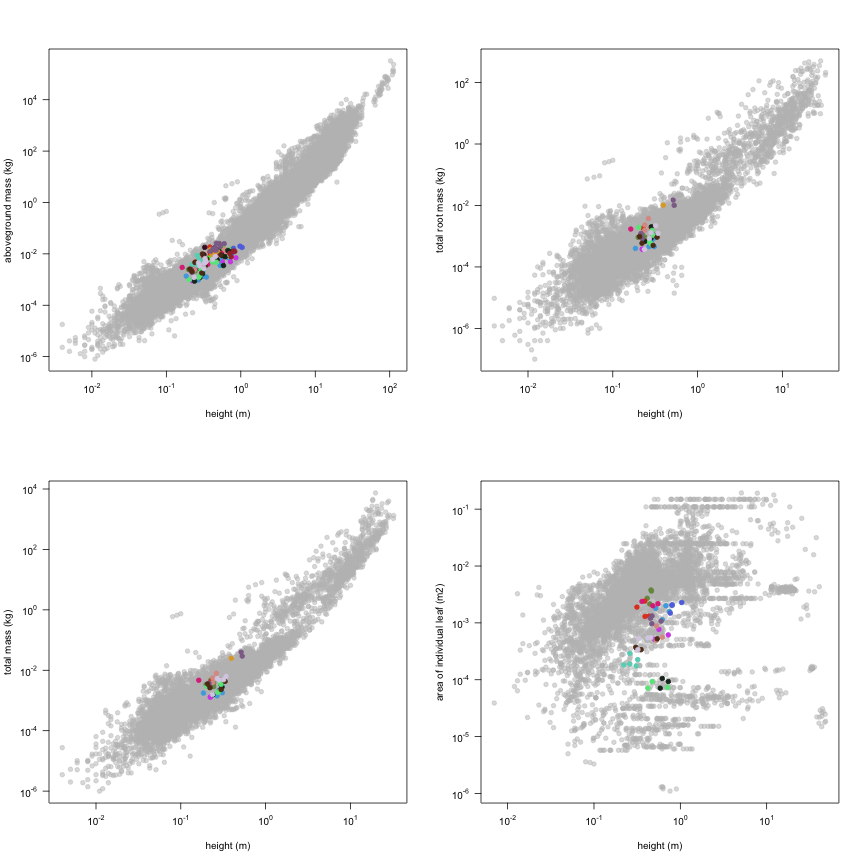
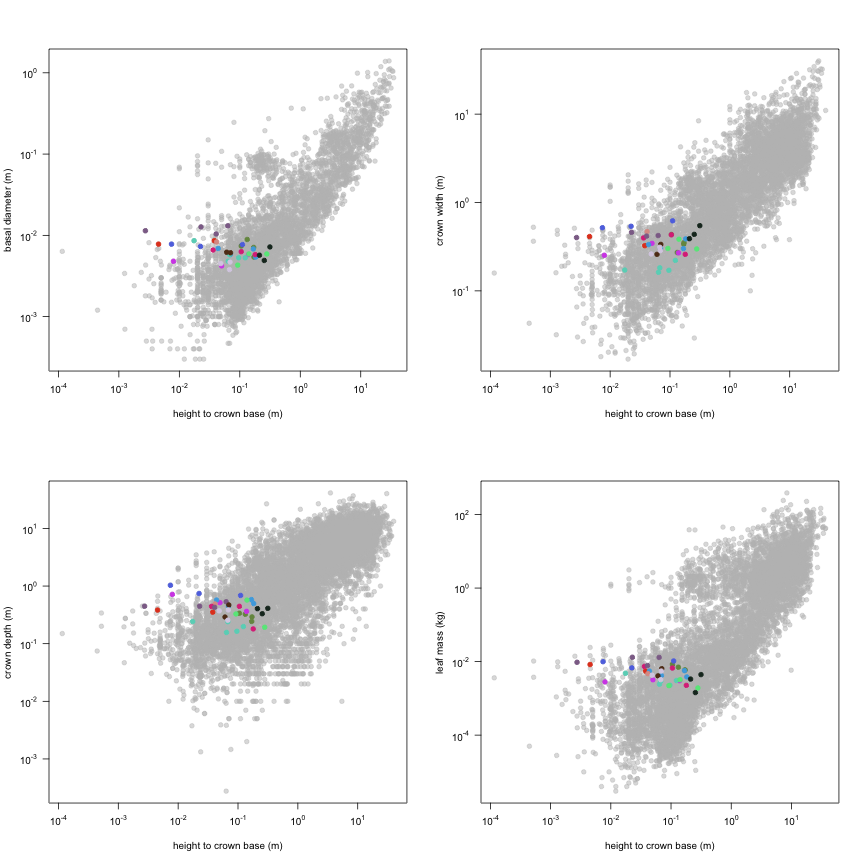
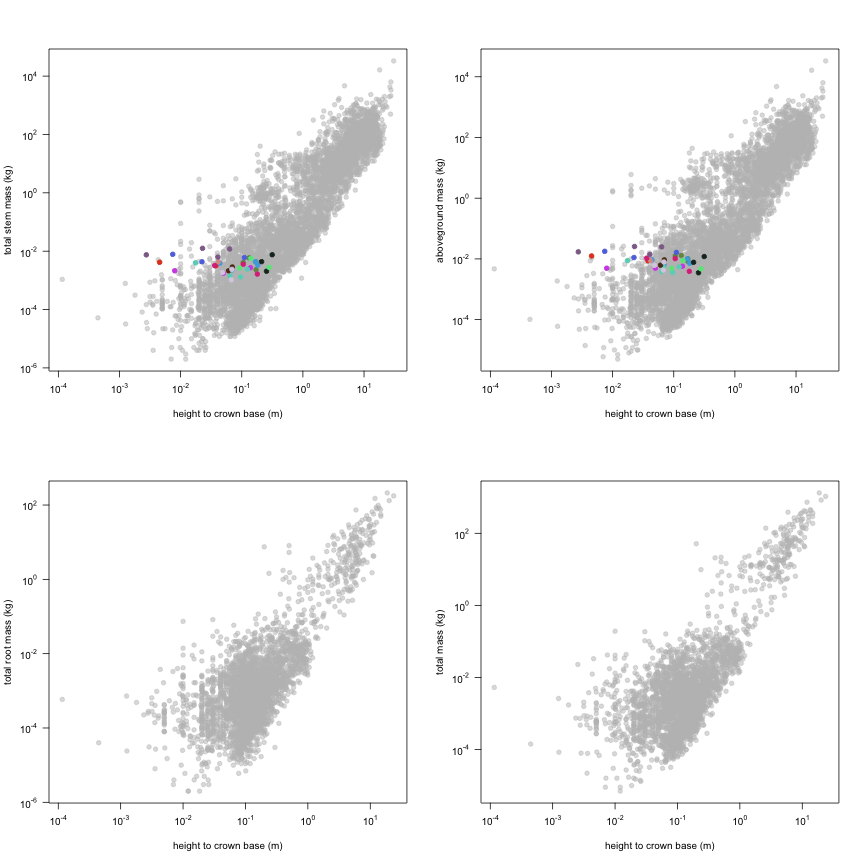
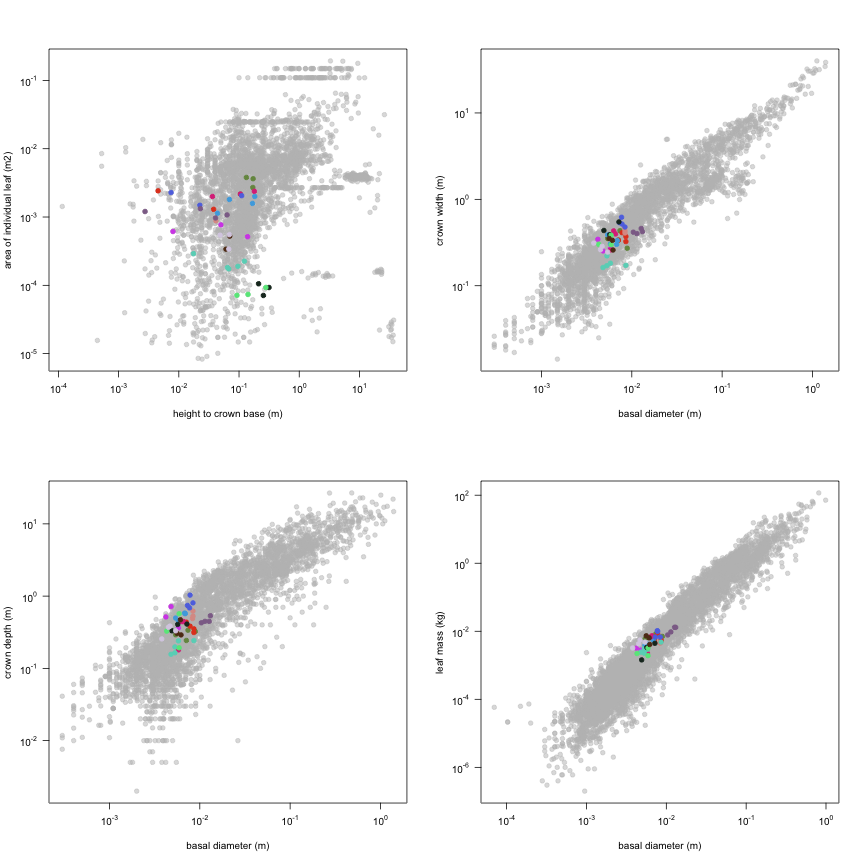
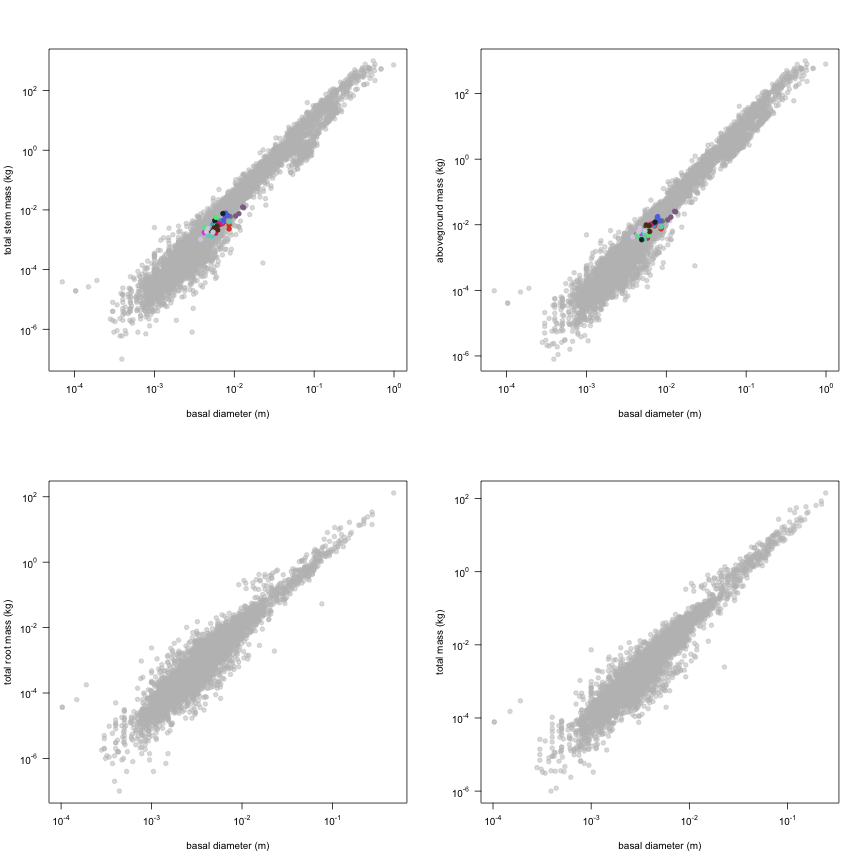
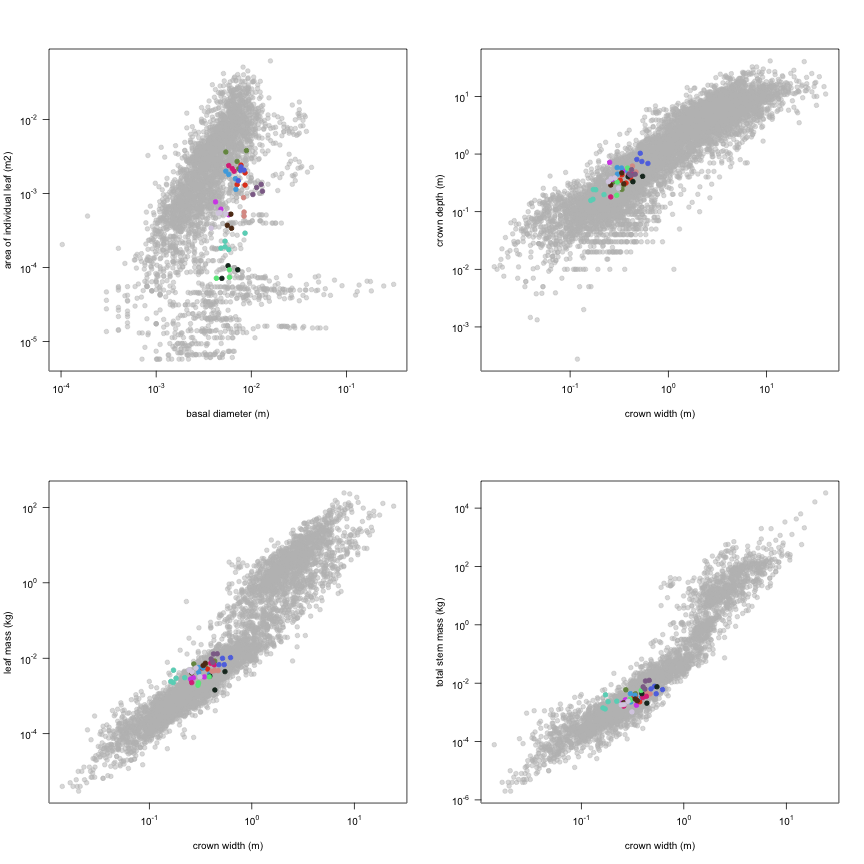
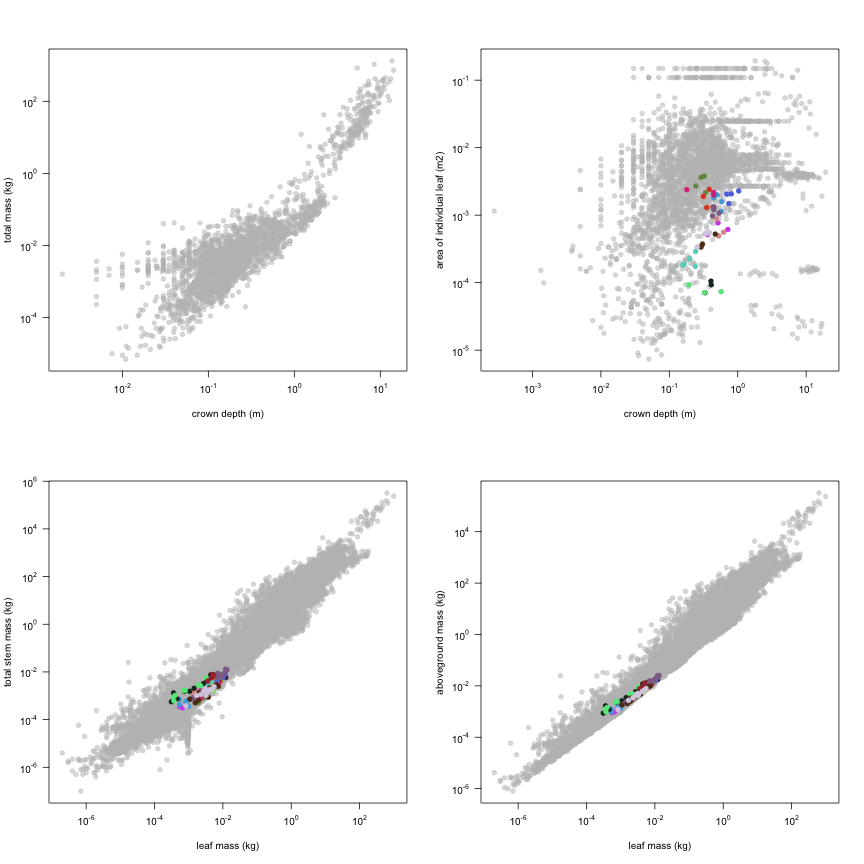
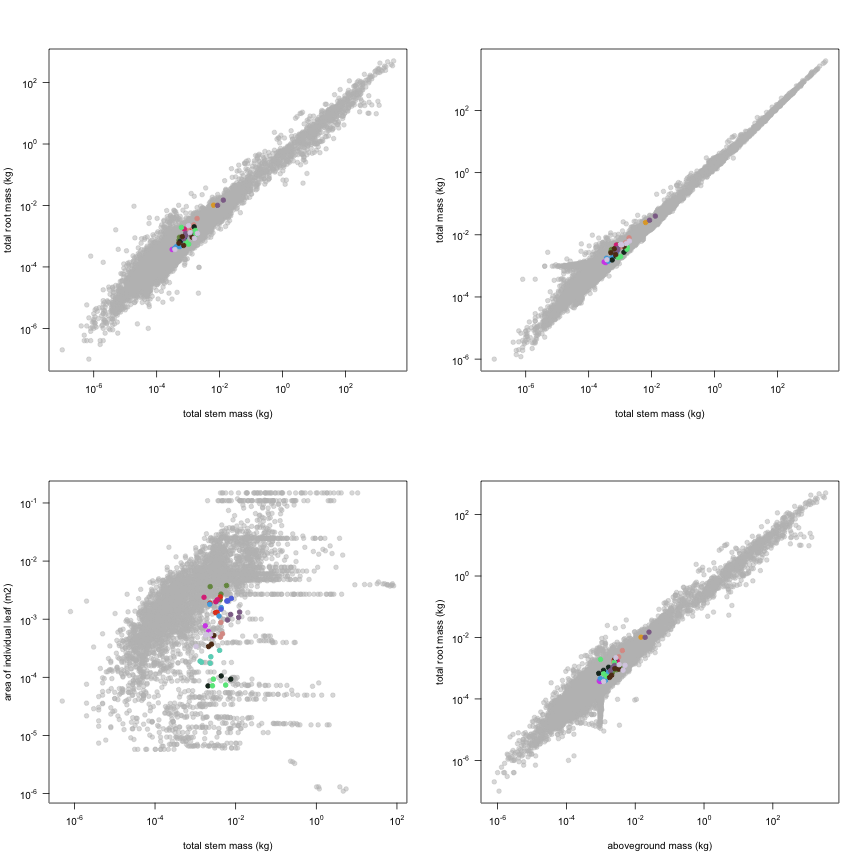
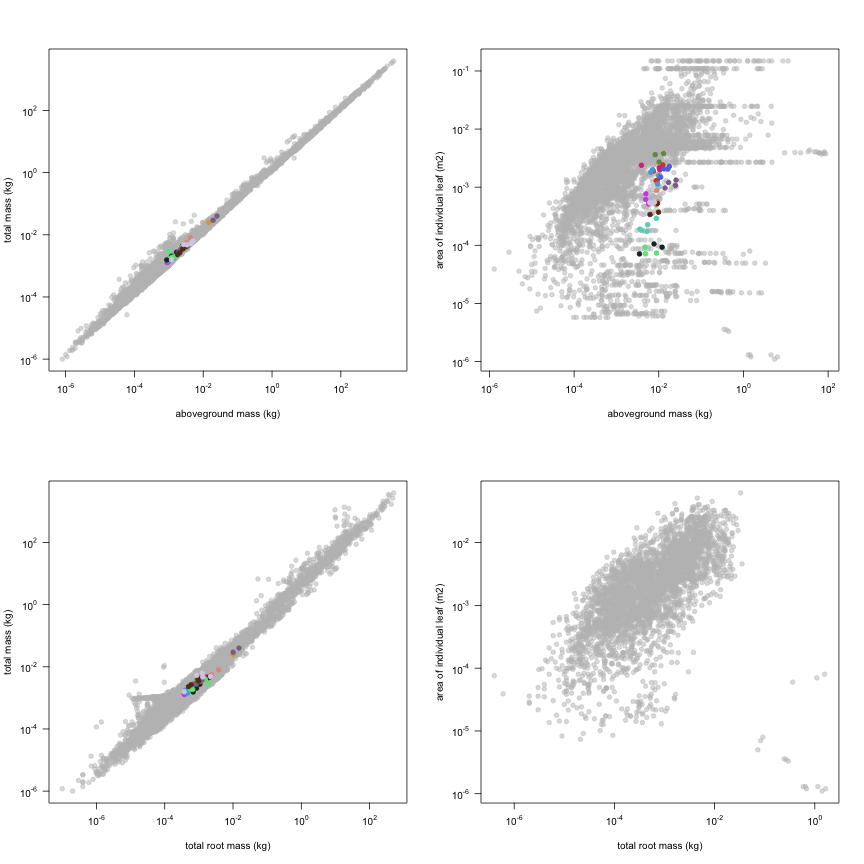
This is how the study Lusk2013 fits in the entire dataset (grey). each colour represents a species. A legend of species names with colours is included at the end for reports with 1 < n < 20 species.