Wang1995
Data contributor: Jian R. Wang
Email: [email protected]
Address:
- Faculty of Natural Resources Management, Lakehead University, Thunder Bay, ON P7B 5E1, Canada
Citation: Wang J, Zhong A, Comeau P, Tsze M and Kimmins J (1995). 'Aboveground biomass and nutrient accumulation in an age sequence of aspen (Populus tremuloides) stands in the Boreal White and Black Spruce Zone, British Columbia.' Forest Ecology and Management, 78(1-3), pp. 127-138.
DOI: 10.1016/0378-1127(95)03590-0
Abstract: A chronosequence of Populus tremuloides Michx. stands ranging from 5 to 95 years of age was measured to document changes on aboveground biomass and nutrient (N, P, K, Ca, Mg) contents for three site classes (good, medium and poor) in the Boreal White and Black Spruce ({BWBS)} zone in northeastern British Columbia. Allometric equations relating dry weights of stemwood, branches and leaves to tree diameter at breast height were developed to estimate aboveground tree biomass. Total aboveground tree biomass increased with stand age from 34.8 t ha-1 in the 5-year-old stand to 359.7 t ha-1 in the 95-year-old stand on good sites, and from 8.3 t ha-1 to 267.7 t ha-1, respectively, on medium sites. On poor sites, the total aboveground tree biomass ranged from 33.9 t ha-1 in a 15-year-old stand to 245.4 t ha-1 in a 95-year-old stand. As stands aged, an increasing proportion of the aboveground biomass was allocated to stems.
Nutrient accumulation in aboveground tree biomass increased with stand age and was in the order of N > Ca > K > Mg > P. Temporal patterns of nutrient accumulation followed the pattern of aboveground biomass accumulation. The nutrient concentrations in different tree tissues decreased in the order leaf > branch > stembark > stemwood, except for K. Understory vegetation contributed little to the nutrient pool of aspen ecosystems. Mineral soil contained the greatest proportion of nutrient capital of the various ecosystem components.
The dataset includes records for 50 individuals from 1 species belonging to 1 family(ies), presenting 1 functional type(s), growing in 1 condition(s) within 1 major type(s) of habitat, with data included for the following variables:
| Variable | Label | Units | N | Min | Median | Max |
|---|---|---|---|---|---|---|
| latitude | Latitude | deg | 50 | 54 | 54 | 54 |
| longitude | Longitude | deg | 50 | -125 | -125 | -125 |
| a.stbh | Stem area at breast height | m2 | 50 | 0.000038 | 0.003 | 0.079 |
| h.t | Height | m | 50 | 0.8 | 8.9 | 26 |
| d.bh | Dbh | m | 50 | 0.007 | 0.061 | 0.32 |
| h.bh | Height of d.bh measurement | m | 50 | 1.3 | 1.3 | 1.3 |
| m.lf | Leaf mass | kg | 50 | 0.011 | 0.34 | 7.8 |
| m.sb | Bark mass | kg | 50 | 0.0038 | 1.1 | 96 |
| m.st | Total stem mass | kg | 50 | 0.027 | 6.7 | 525 |
| m.so | Aboveground mass | kg | 50 | 0.039 | 7.3 | 533 |
| m.br | Branch mass | kg | 50 | 0.0089 | 1 | 50 |

And locally within the country:

The sites sampled are:
| Location | Longitude | Latitude | Vegetation |
|---|---|---|---|
| Dawson Creek, Forest District of northeastern British Columbia, CA | -125 | 53.5 | Boreal forest |
The growing conditions of sampled plants was:
| Location | growingCondition |
|---|---|
| Dawson Creek, Forest District of northeastern British Columbia, CA | field wild |
| Species | Family | Pft |
|---|---|---|
| Populus tremuloides Michx. | Salicaceae | deciduous angiosperm |
Sampling strategy: Sample trees are collected from an age chronosequency of Populus tremuloides natural stands. The sampled stands represent the whole range of site conditions of the species distribution; i.e. from poor to medium and good site productivity. All sample trees were dominant trees.
Leaf area: Leaf area was not measured. However, we can calculate the leaf area by using specific leaf area of Populus tremuloides to convert the leaf biomass data into leaf area data.
Stem cross sectional area: We can calculate stem cross sectional area by using the diameter at breast height.
Biomass: After felling all branches were weighed fresh in the field. Subsamples of the crown (10% of crown for all trees >5 cm DBH and 100% for trees <5 cm DBH) was dried at 70degC for 48h to obtain the dry to fresh weight ratio.
Height: Because all sample trees were at different ages, they have different height.
Year collected: 1991-1992
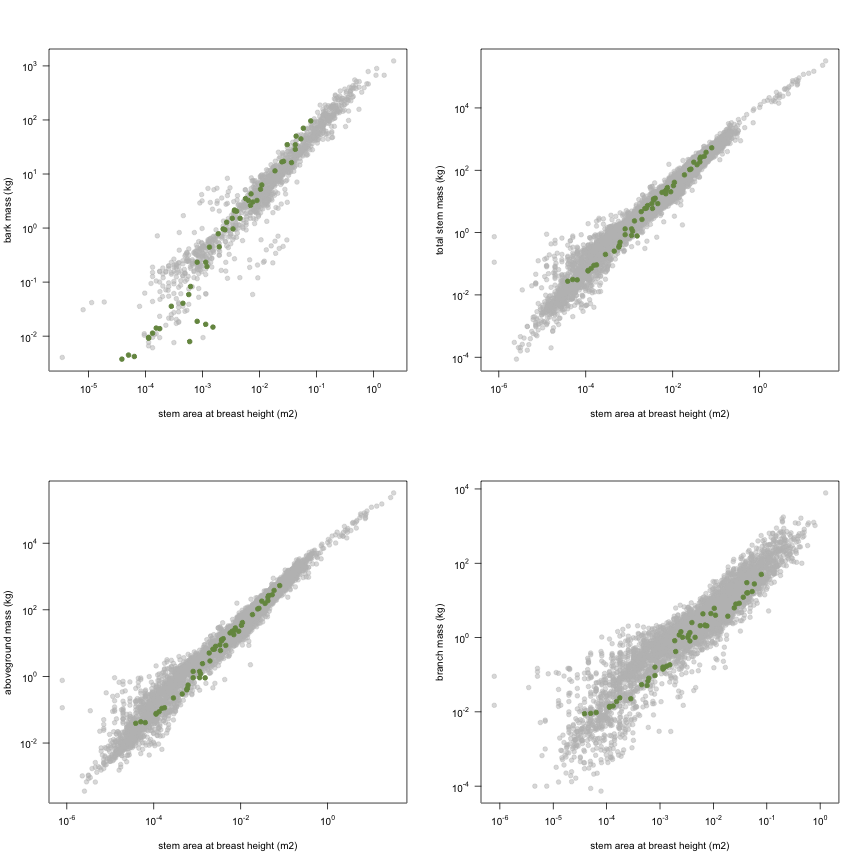
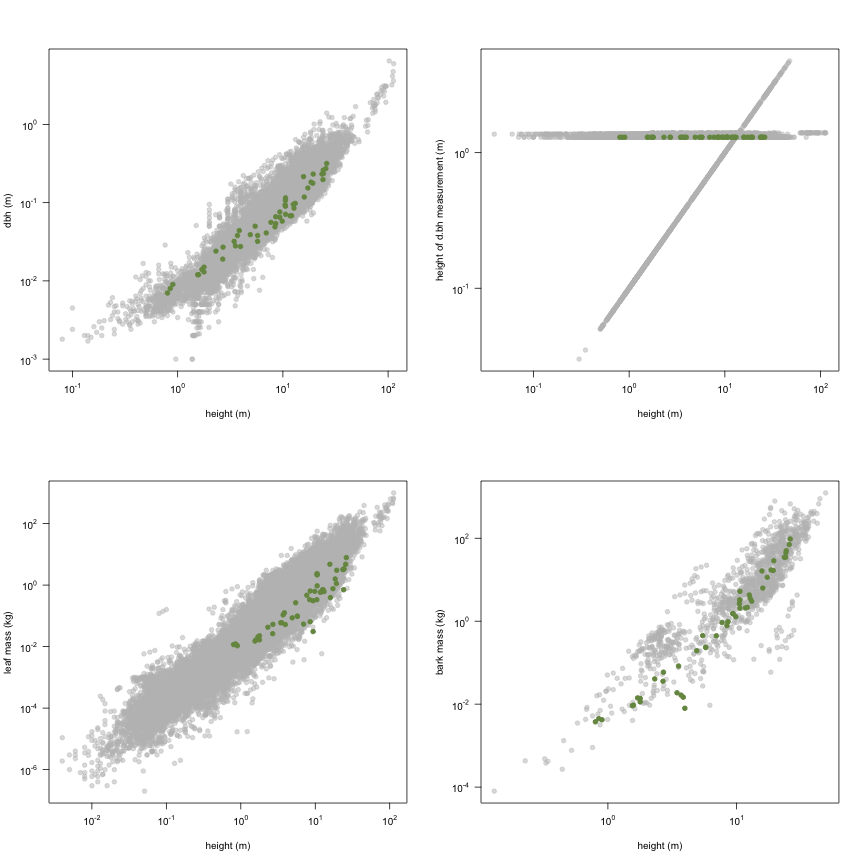
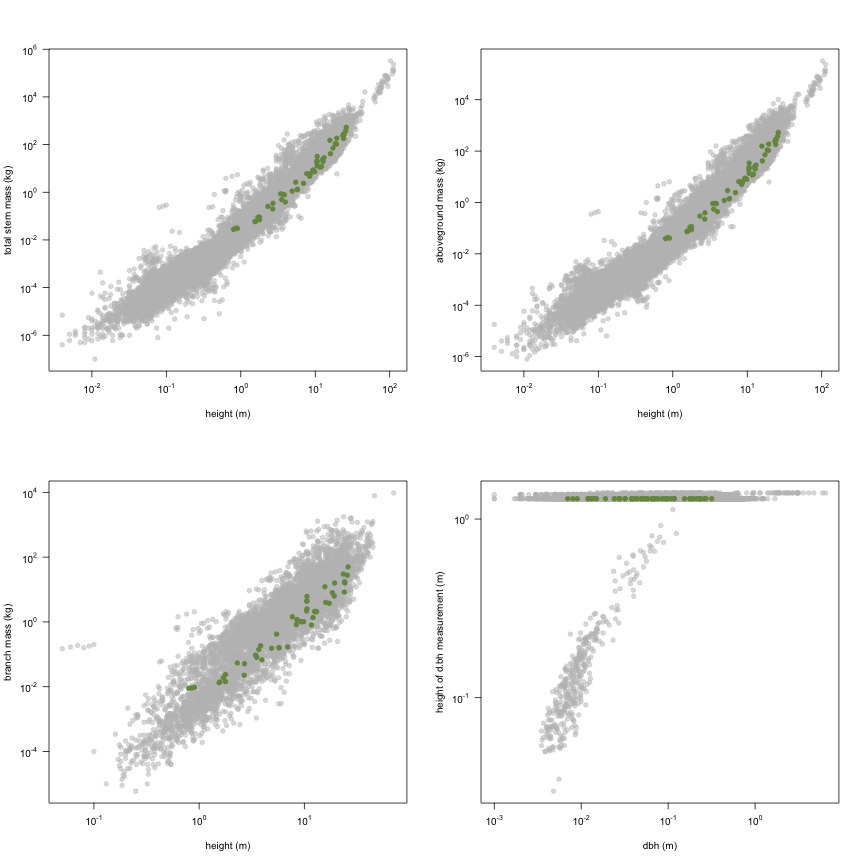
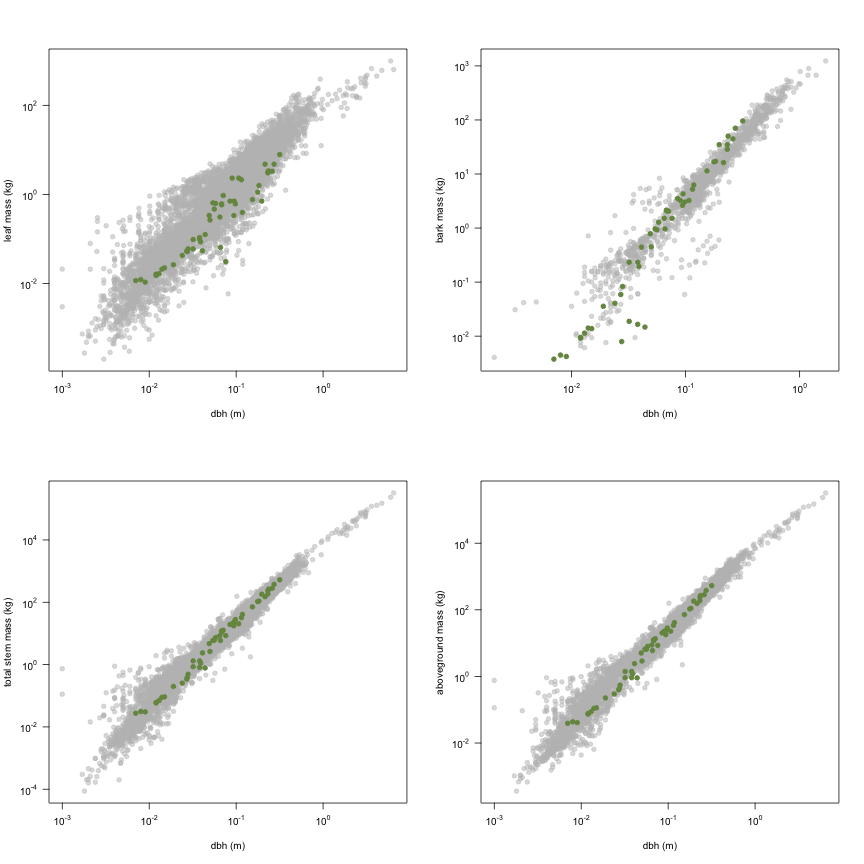
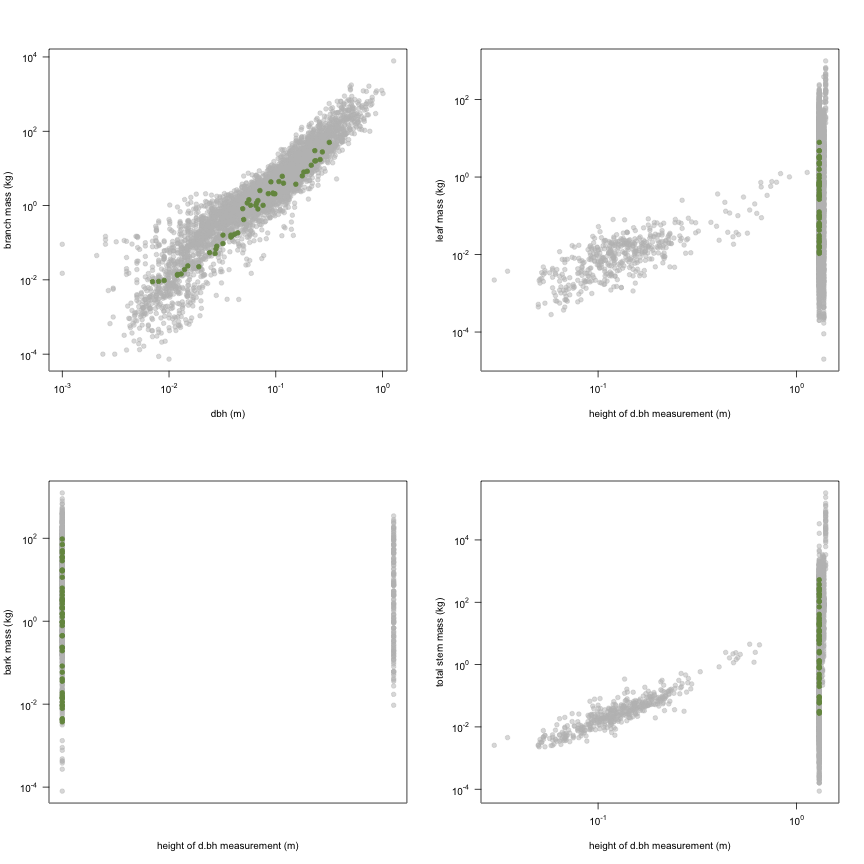
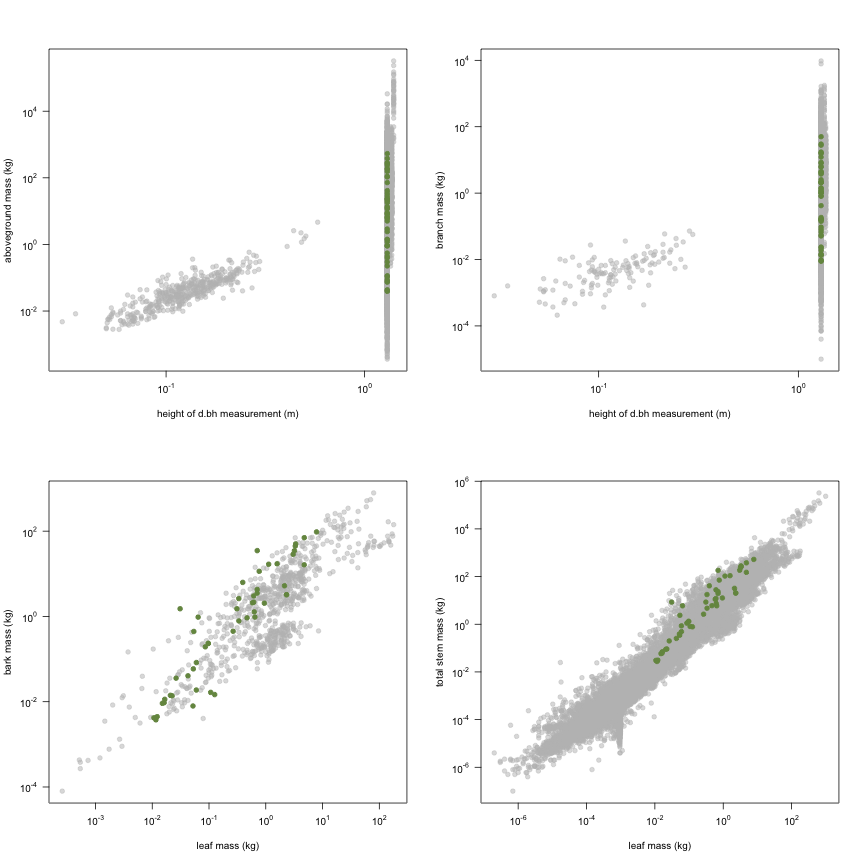
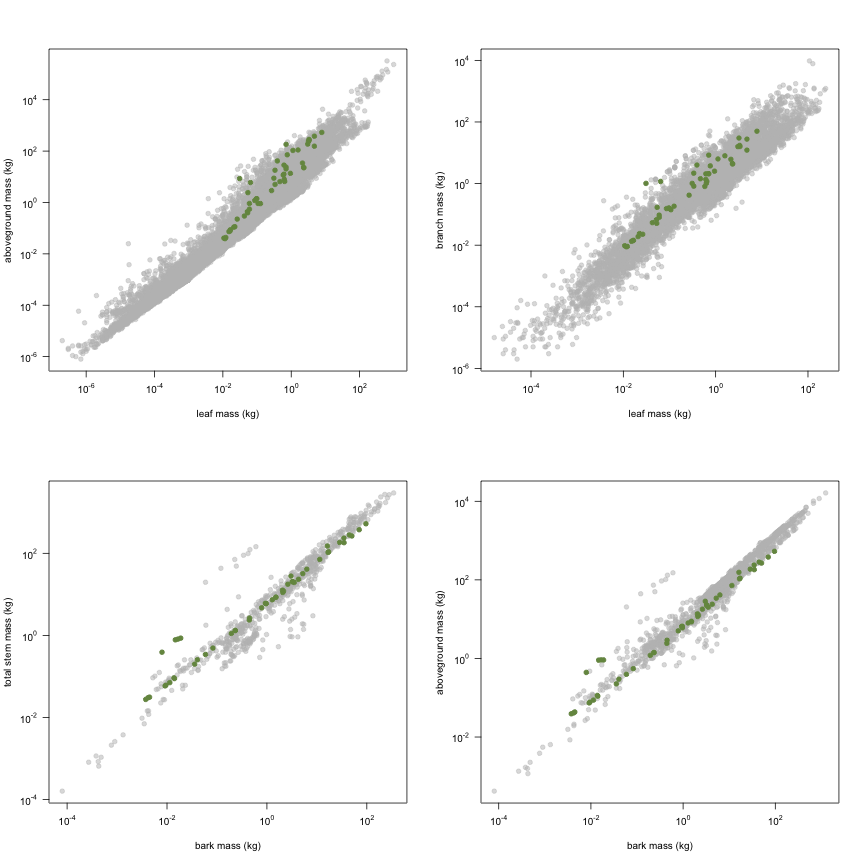
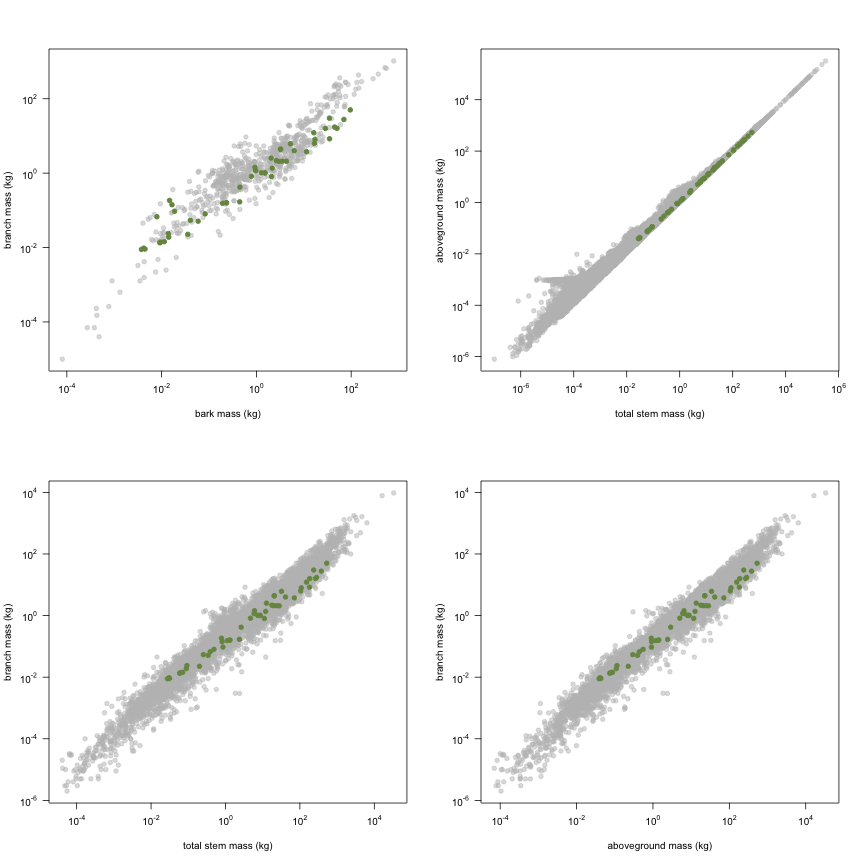
This is how the study Wang1995 fits in the entire dataset (grey). each colour represents a species. A legend of species names with colours is included at the end for reports with 1 < n < 20 species.