Salazar2010
Data contributor: Ignacio Santa-Regina
Email: [email protected]
Address:
- Institute of Natural Resources and Agrobiology of Salamanca, IRNASA-CSIC, Spain
Citation: Salazar S, Sanchez LE, Galindo P and Santa-Regina I (2010). 'Above-ground tree biomass equations and nutrient pools for a paraclimax chestnut stand and for a climax oak stand in the Sierra de Francia Mountains, Salamanca, Spain.' Scientific Research and Essays, 5(11), pp. 1294-1301.
DOI:
Abstract: Above-ground tree biomass and total amounts of nutrients in biomass were estimated at two plots: the first in a Castanea sativa Mill. paraclimax coppice and the second in a Quercus pyrenaica (Wild.) climax forest, both of them located in the south of the Salamanca (Spain), by harvesting 10 trees at each plot. In order to obtain the best fit possible, for these analyses, four regression equations were applied: linear, logarithmic, potential and exponential. In the chestnut coppice, the best fits were obtained using the exponential regression, while for the oak plot the best fit was obtained with the linear regression. A parametric analysis was also performed for each fraction of the tree biomass between both plots. This revealed that, total biomass and that of the trunks, branches and leaves at the chestnut coppice were significantly greater than those found at the oak plot. At the chestnut coppice for the nutrients (except carbon) significant differences were observed between leaves, branches and trunks, the highest concentrations being found in the leaves, followed by the branches and the trunks. This order was also observed at the oak plot, with the exception of calcium, which did not reveal significant differences between the branches and the trunks.
The dataset includes records for 21 individuals from 2 species belonging to 1 family(ies), presenting 1 functional type(s), growing in 1 condition(s) within 1 major type(s) of habitat, with data included for the following variables:
| Variable | Label | Units | N | Min | Median | Max |
|---|---|---|---|---|---|---|
| latitude | Latitude | deg | 21 | 41 | 41 | 41 |
| longitude | Longitude | deg | 21 | -6 | -6 | -6 |
| a.stbh | Stem area at breast height | m2 | 21 | 0.002 | 0.01 | 0.04 |
| h.t | Height | m | 21 | 4.9 | 8.7 | 14 |
| d.bh | Dbh | m | 21 | 0.051 | 0.11 | 0.23 |
| h.bh | Height of d.bh measurement | m | 21 | 1.3 | 1.3 | 1.3 |
| m.lf | Leaf mass | kg | 21 | 0.05 | 0.33 | 2.8 |
| m.st | Total stem mass | kg | 21 | 7.5 | 38 | 162 |
| m.so | Aboveground mass | kg | 21 | 7.6 | 39 | 164 |
| m.br | Branch mass | kg | 21 | 1.4 | 8.7 | 50 |
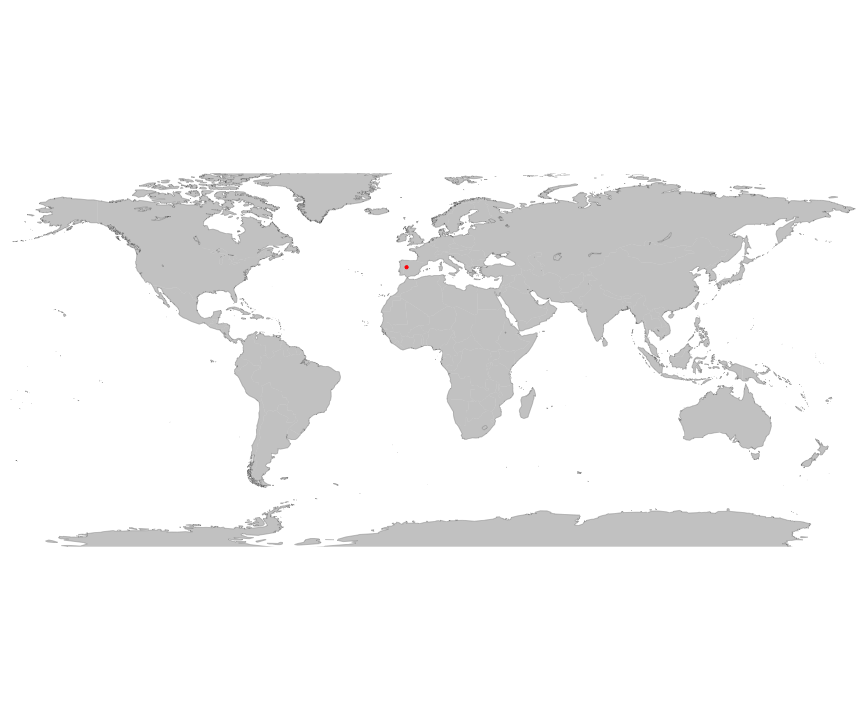
And locally within the country:

The sites sampled are:
| Location | Longitude | Latitude | Vegetation |
|---|---|---|---|
| La Honfria, Linares de Riofrio, Salamanca, Spain | -5.953 | 40.5761 | Woodland |
The growing conditions of sampled plants was:
| Location | growingCondition |
|---|---|
| La Honfria, Linares de Riofrio, Salamanca, Spain | field wild |
| Species | Family | Pft |
|---|---|---|
| Castanea sativa | Fagaceae | deciduous angiosperm |
| Quercus pyrenaica | Fagaceae | deciduous angiosperm |
Sampling strategy: Fourteen representative trees of different diameter classes were felled to establish their aboveground biomass: seven Fagus sylvatica trees and seven Pinus sylvestris trees. Each tree thud hsrvested was divided into trunk, branches and leaves.
Leaf area: Leaf area was not measured
Stem cross sectional area: The DBH of all trees in 1 ha surface on each experimental plot was measured.
Height: The height of all trees in 1 ha surface was measured for each tree species using a measuring tape.
Crown area:
Biomass: Tree compartments (trunk, branches and leaves) were partitioned and then dried to be weighted. The trunks were separated into sections, according to their height (0-1.30 m, 1.30-3 m, 3-5 m, 5-7 m).
traits: Representative biomass and litter samples were ground for chemical analyses. Total carbon and nitrogen were determined using a Wosthoff carmograph and Macro-N Heraeus analyzer, respectively.
Growth environment: Individuals are naturally regenerated individuals in gaps or in the understory. The Fagus sylvatica is a climacic species, whereas Pinus sylvestris is a disclimacic species.
Other variables:
Year collected: 2001-2005
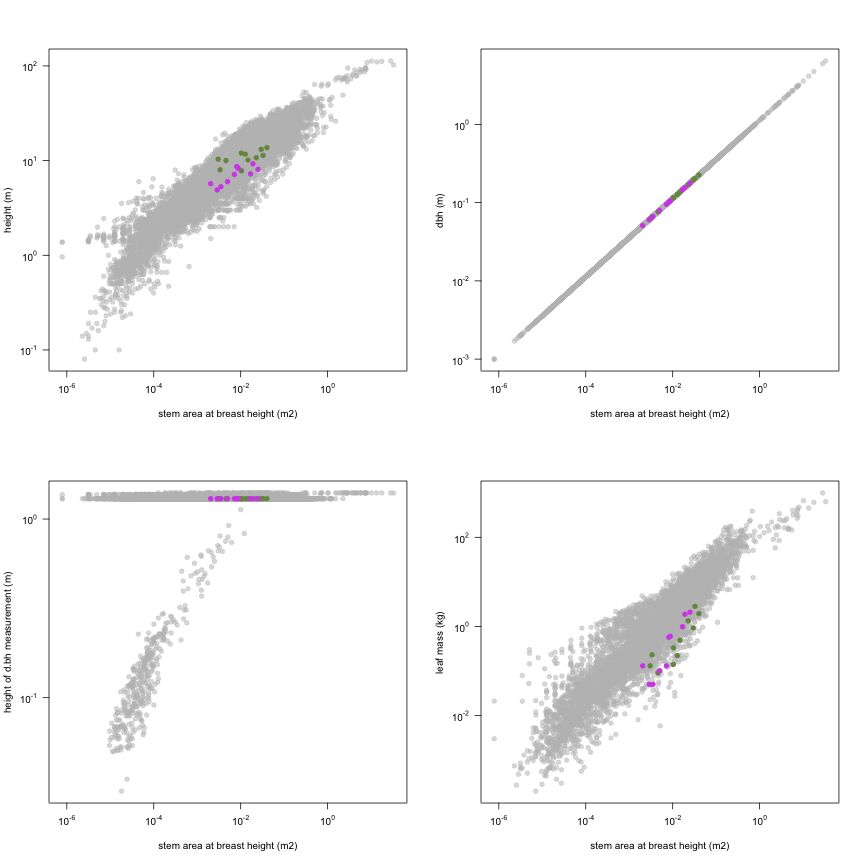
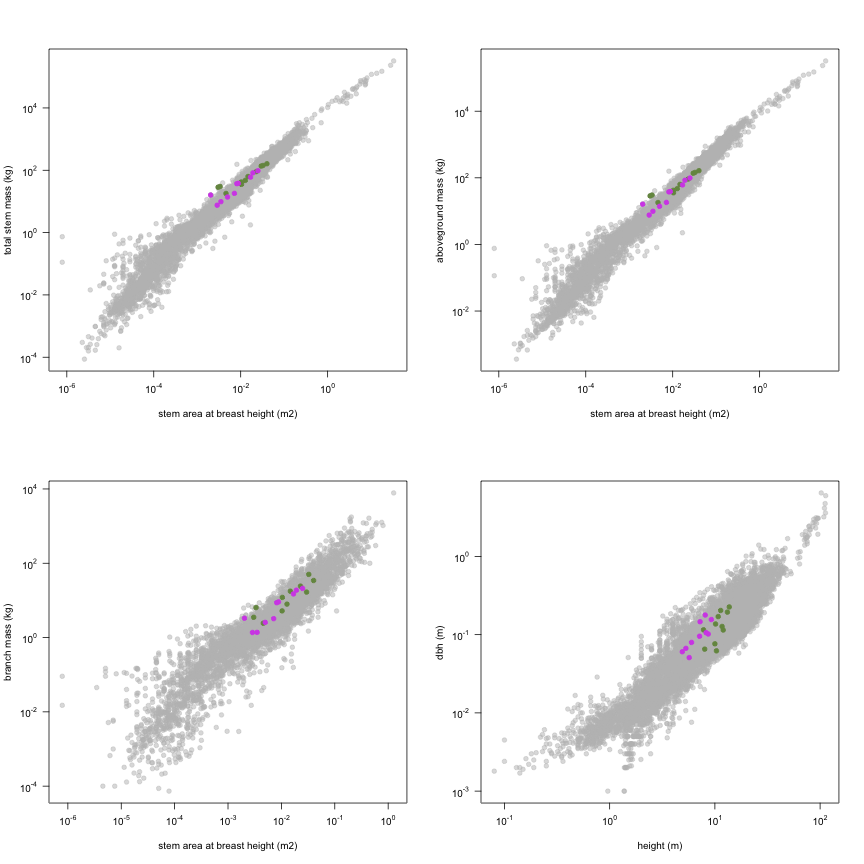
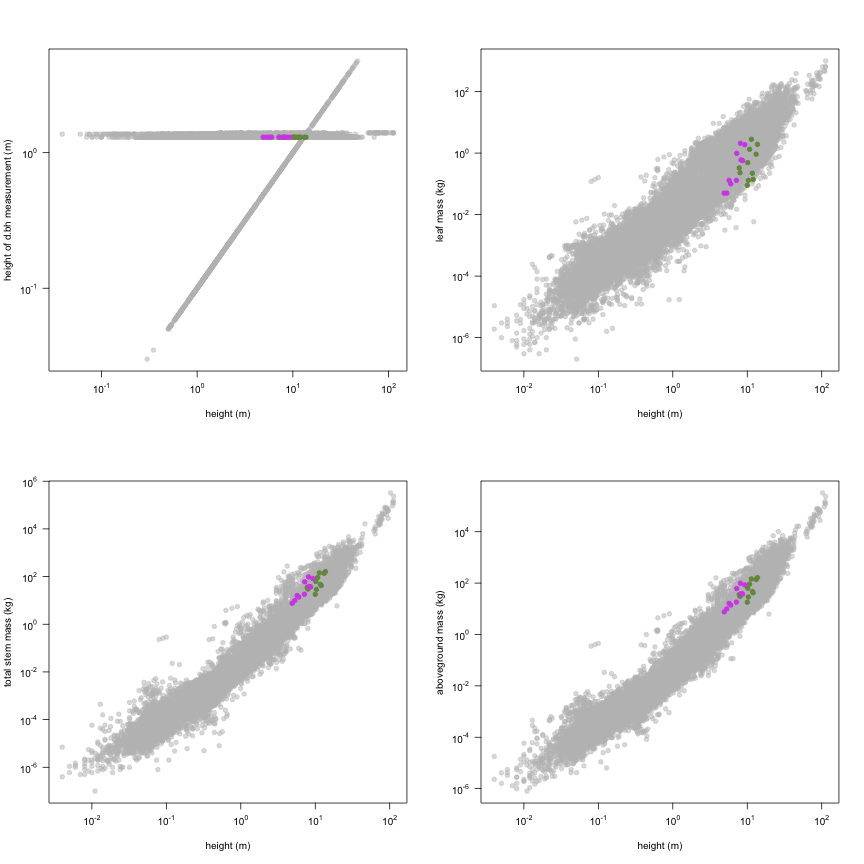
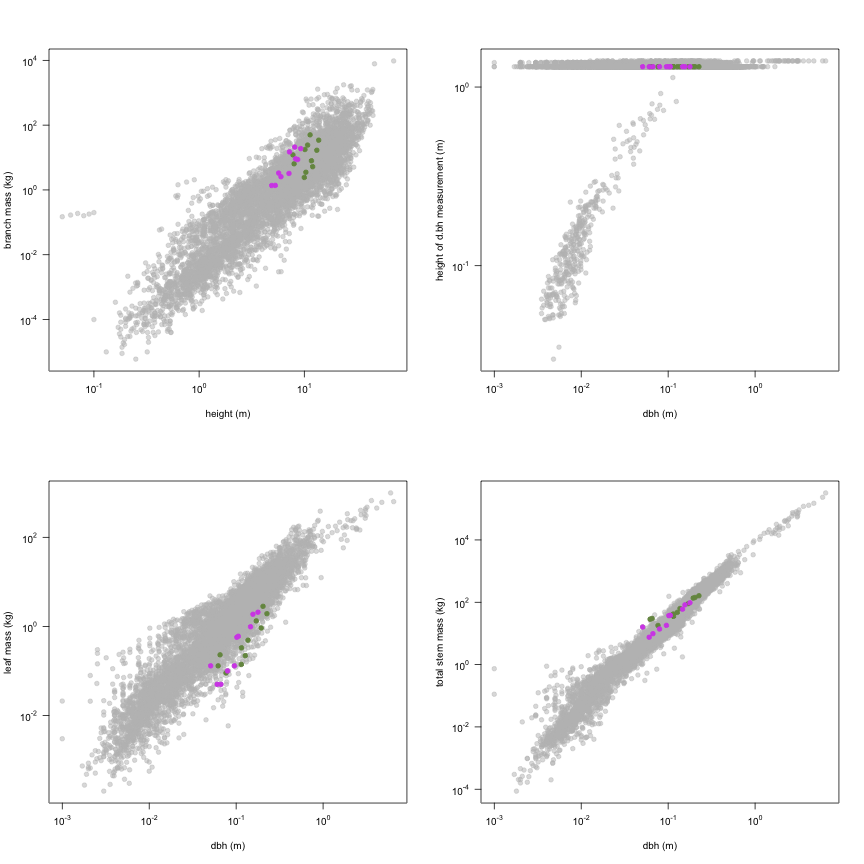
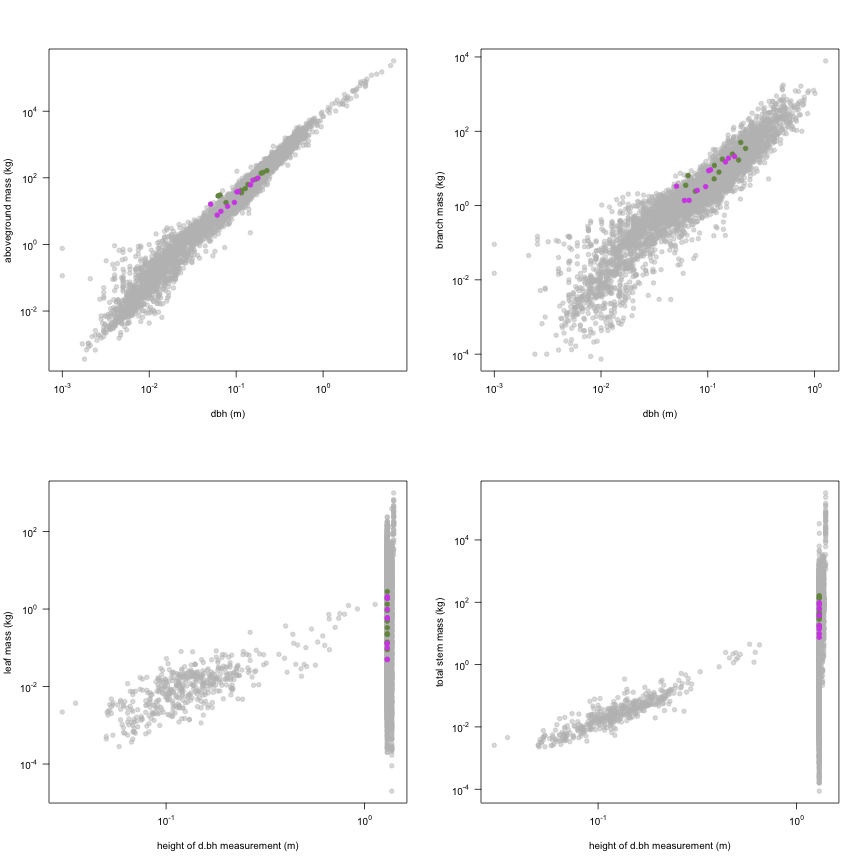
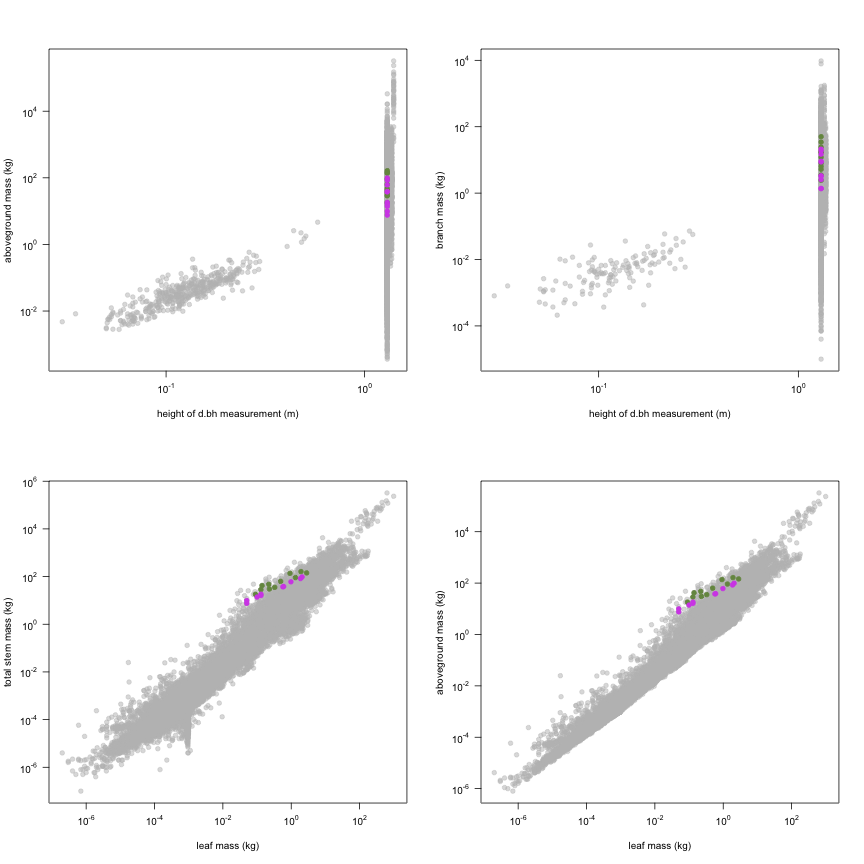
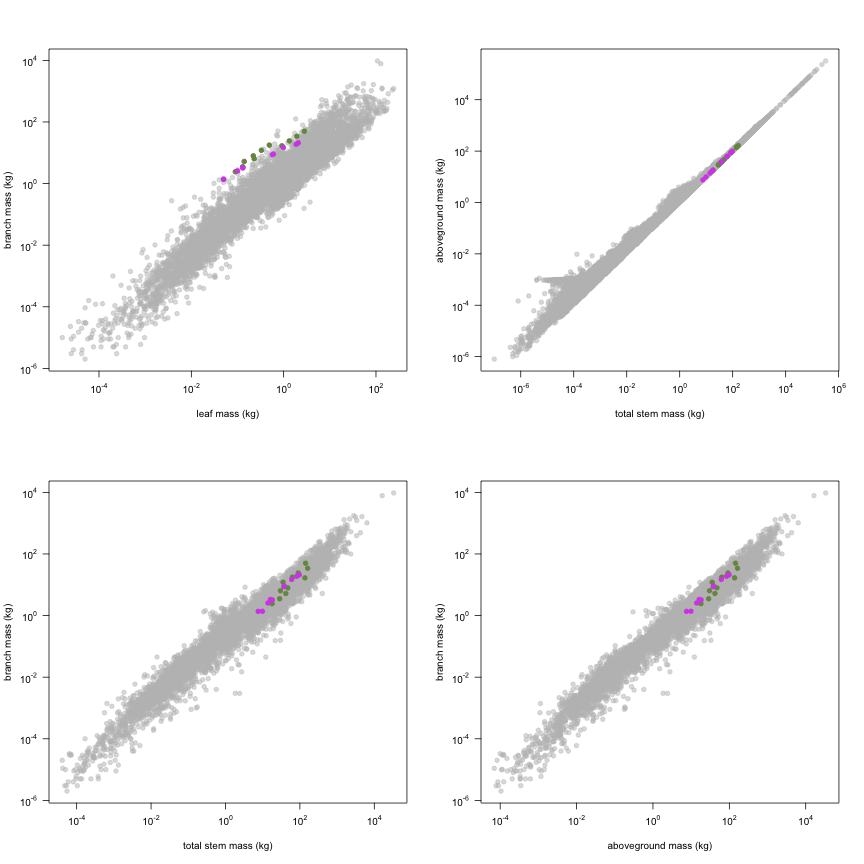
This is how the study Salazar2010 fits in the entire dataset (grey). each colour represents a species. A legend of species names with colours is included at the end for reports with 1 < n < 20 species.