Martin1998
Data contributor: Brian D. Kloeppel
Email: [email protected]
Address:
- Department of Geosciences and Natural Resources, Western Carolina University, 331 Stillwell Building, Cullowhee, NC 28723, USA
Citation: Martin JG, Kloeppel BD, Schaefer TL, Kimbler DL and McNulty SG (1998). 'Aboveground biomass and nitrogen allocation of ten deciduous southern Appalachian tree species.' Canadian Journal of Forest Research, 28, pp. 1648-1659.
DOI: 10.1139/x98-146
Abstract: Abstract: Allometric equations were developed for mature trees of 10 deciduous species (Acer rubrum L., Betula lenta L., Carya spp., Comus florida L., Liriodendron tulipifera L., Oxydendrum arboreum (L.) {DC.}, Quercus alba L., Quercus coccinea Muenchh., Quercus prinus L., and Quercus rubra L.) at the Coweeta Hydrologic Laboratory in western North Carolina, {U.S.A.} These equations included the following dependent variables: stem wood mass, stem bark mass, branch mass, total wood mass, foliage mass, total biomass, foliage area, stem surface area, sapwood volume, and total tree volume. High correlation coefficients (R2) were observed for all variables versus stem diameter, with the highest being for total tree biomass, which ranged from 0.981 for Oxydendrum arboreum to 0.999 for Quercus coccinea. Foliage area had the lowest Rz values, ranging from 0.555 for Quercus alba to 0.962 for Betula lenta. When all species were combined, correlation coefficients ranged from 0.822 for foliage area to 0.986 for total wood mass, total tree biomass, and total tree volume. Species with ring versus diffuse/semiring porous wood anatomy exhibited higher leaf area with a given cross-sectional sapwood area as well as lower total sapwood volume. Liriodendron tulipifera contained one of the highest foliar nitrogen concentrations and had consistently low branch, bark, sapwood, and heartwood nitrogen contents. For a tree diameter of 50 cm, Carya spp. exhibited the highest total nitrogen content whereas Liriodendron tulipifera exhibited the lowest.
The dataset includes records for 87 individuals from 10 species belonging to 7 family(ies), presenting 1 functional type(s), growing in 1 condition(s) within 1 major type(s) of habitat, with data included for the following variables:
| Variable | Label | Units | N | Min | Median | Max |
|---|---|---|---|---|---|---|
| latitude | Latitude | deg | 87 | 35 | 35 | 35 |
| longitude | Longitude | deg | 87 | -83 | -83 | -83 |
| age | Age | yr | 84 | 21 | 71 | 264 |
| a.lf | Leaf area | m2 | 87 | 3.9 | 51 | 444 |
| a.ssbh | Sapwood area at breast height | m2 | 87 | 0.00078 | 0.013 | 0.16 |
| a.stbh | Stem area at breast height | m2 | 87 | 0.0011 | 0.043 | 0.31 |
| h.t | Height | m | 87 | 4.6 | 20 | 40 |
| d.bh | Dbh | m | 87 | 0.038 | 0.23 | 0.63 |
| h.bh | Height of d.bh measurement | m | 87 | 1.4 | 1.4 | 1.4 |
| m.lf | Leaf mass | kg | 87 | 0.12 | 4 | 44 |
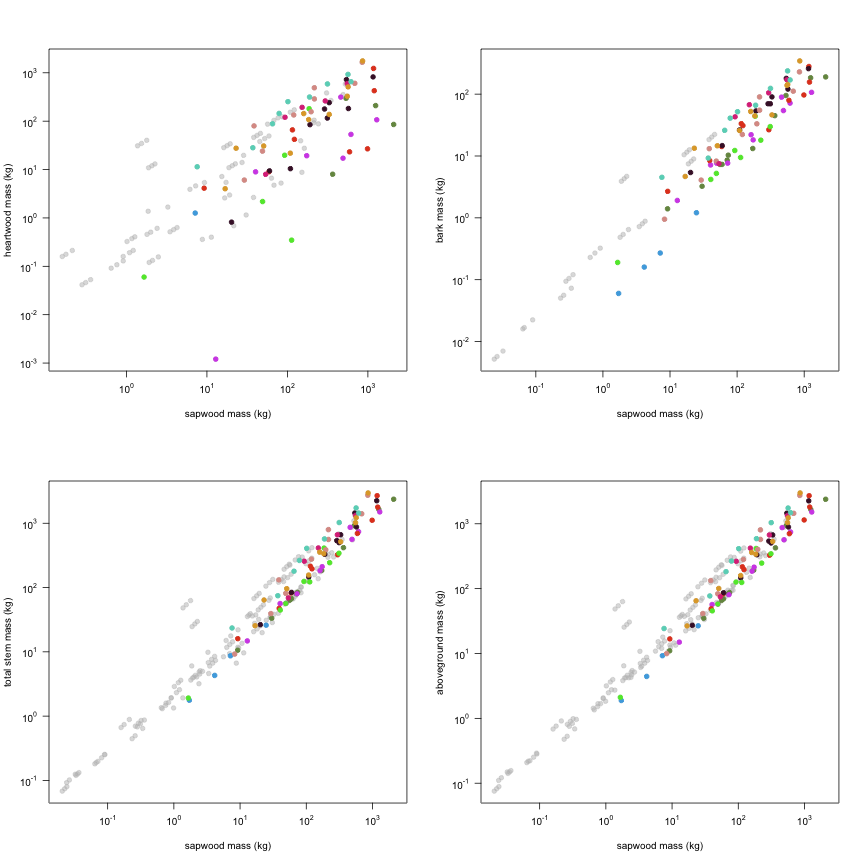
| m.ss | Sapwood mass | kg | 87 | 1.7 | 152 | 2089 |
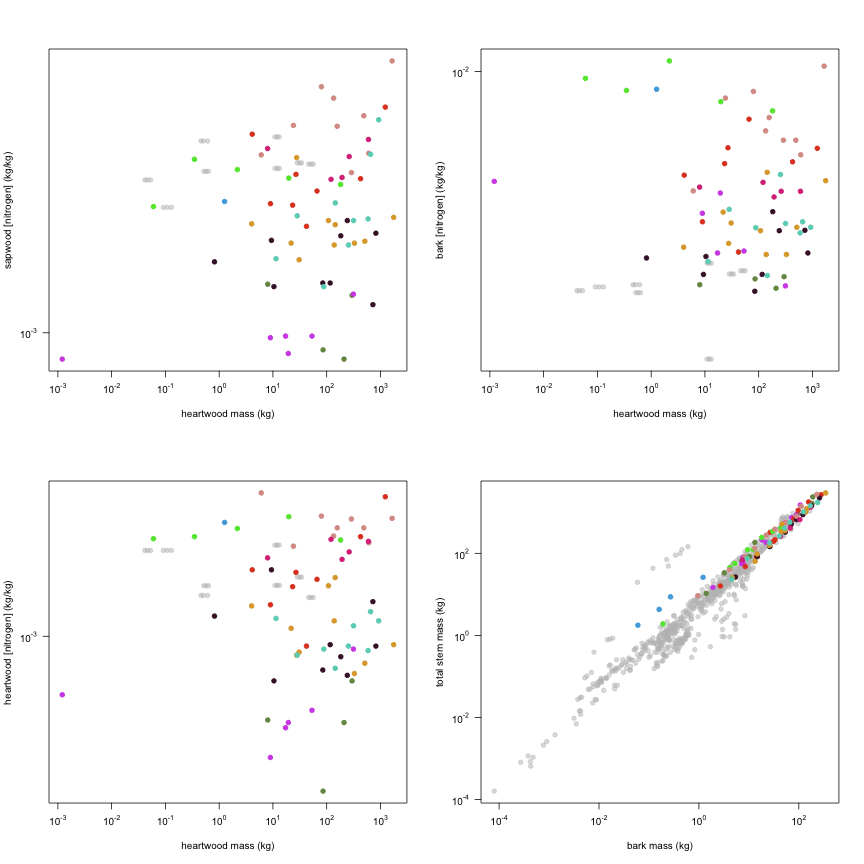
| m.sh | Heartwood mass | kg | 87 | 0 | 28 | 1759 |
| m.sb | Bark mass | kg | 87 | 0.06 | 30 | 344 |
| m.st | Total stem mass | kg | 87 | 1.8 | 257 | 2962 |
| m.so | Aboveground mass | kg | 87 | 1.9 | 264 | 2990 |
| ma.ilf | Leaf mass per area | kg m-2 | 87 | 0.02 | 0.074 | 0.12 |
| r.st | Wood density | kg m-3 | 86 | 263 | 500 | 688 |
| n.lf | Leaf [nitrogen] | kg kg-1 | 87 | 0.009 | 0.024 | 0.036 |
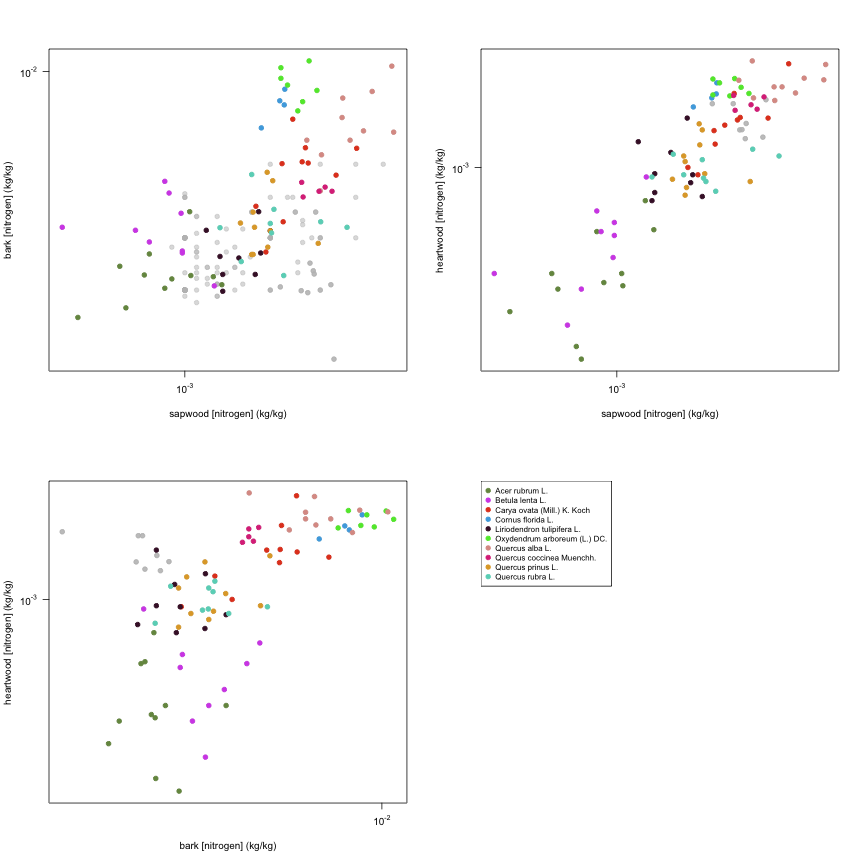
| n.ss | Sapwood [nitrogen] | kg kg-1 | 84 | 0.00037 | 0.002 | 0.0054 |
| n.sb | Bark [nitrogen] | kg kg-1 | 84 | 0.0026 | 0.0046 | 0.011 |
| n.sh | Heartwood [nitrogen] | kg kg-1 | 84 | 0.00015 | 0.0011 | 0.0029 |

And locally within the country:

The sites sampled are:
| Location | Longitude | Latitude | Vegetation |
|---|---|---|---|
| Coweeta LTER, USA | -83 | 35 | Temperate forest |
The growing conditions of sampled plants was:
| Location | Grouping | growingCondition |
|---|---|---|
| Coweeta LTER, USA | Filter = 0 | field wild |
| Coweeta LTER, USA | Filter = 1 | field wild |
| Species | Family | Pft |
|---|---|---|
| Acer rubrum L. | Aceraceae | deciduous angiosperm |
| Betula lenta L. | Betulaceae | deciduous angiosperm |
| Carya ovata (Mill.) K. Koch | Juglandaceae | deciduous angiosperm |
| Cornus florida L. | Cornaceae | deciduous angiosperm |
| Liriodendron tulipifera L. | Magnoliaceae | deciduous angiosperm |
| Oxydendrum arboreum (L.) DC. | Ericaceae | deciduous angiosperm |
| Quercus alba L. | Fagaceae | deciduous angiosperm |
| Quercus coccinea Muenchh. | Fagaceae | deciduous angiosperm |
| Quercus prinus L. | Fagaceae | deciduous angiosperm |
| Quercus rubra L. | Fagaceae | deciduous angiosperm |
Sampling strategy: Trees were sampled in the southern Appalachian Mountains in western North Carolina at the Coweeta Hydrologic Laboratory (35˚N, 83˚W) as well as in an area 4 km to the south; both areas are on the Nantahala National Forest. All trees were selected from mature stands (i.e., >80 years old). Trees used in this study were selected by species, size, and location and were harvested between June and August. The range of species and sizes was selected to represent the distribution observed in over 400 permanent plots across the Coweeta Basin. Trees were selected using a stratified random design so that sample trees would represent a wide diameter range. In total, 87 individuals spanning a dbh of 3.8 to 63 cm were selected.
Leaf area: The crown was divided into 3 sections. Within each section, we selected 10 representative leaves from each of the canopy section subsamples and separated the petioles from the leaf blades. The total area of the leaf blades was measured using a leaf area meter (LI-COR 3100, LI-COR, Inc., Lincoln, Nebr.); the blades and petioles were dried (65degC) and weighed to determine SLA and the ratio of leaf blade mass to total leaf mass.
Stem cross sectional area: Diameter of stems were measured at breast height (1.37 m). 4 cm disks were cut at base, at DBH and at crown base to determine the sapwood/heartwood area using potassium iodide to determine sapwood/heartwood boundaries.
Height: Height was measured as the vertical distance from the ground to the highest apex and crown base.
Crown area: Crown width was measured at right angles including the widest width. Projected area and volume were estimated by assuming an ellipse/ellipsoid.
Biomass: Stems were divided into 1- or 2-m sections and weighed fresh. The crown was divided into thirds. Branches from each third were weighed separately and a sample branch from each third was collected for foliage mass ratio measurements. 4 cm disks were cut from the base of each log section for determination of water content as well as the bark/wood mass ratio. Samples were then dried to a constant mass at 65degC and weighed to determine moisture content.
Traits: The ratio of leaf blade mass to total leaf mass was used to compute leaf mass per area for each crown third. Nitrogen concentration was measured on 50 leaves from each crown subsample. Branch nitrogen concentration was determined on a representative branch from each crown position subsample. For stem tissue nitrogen analysis, bark, sapwood and a 10˚ wedge from the remaining wood were sampled from the stem disks.
Growth environment: Field, wild.
Year collected: 1997
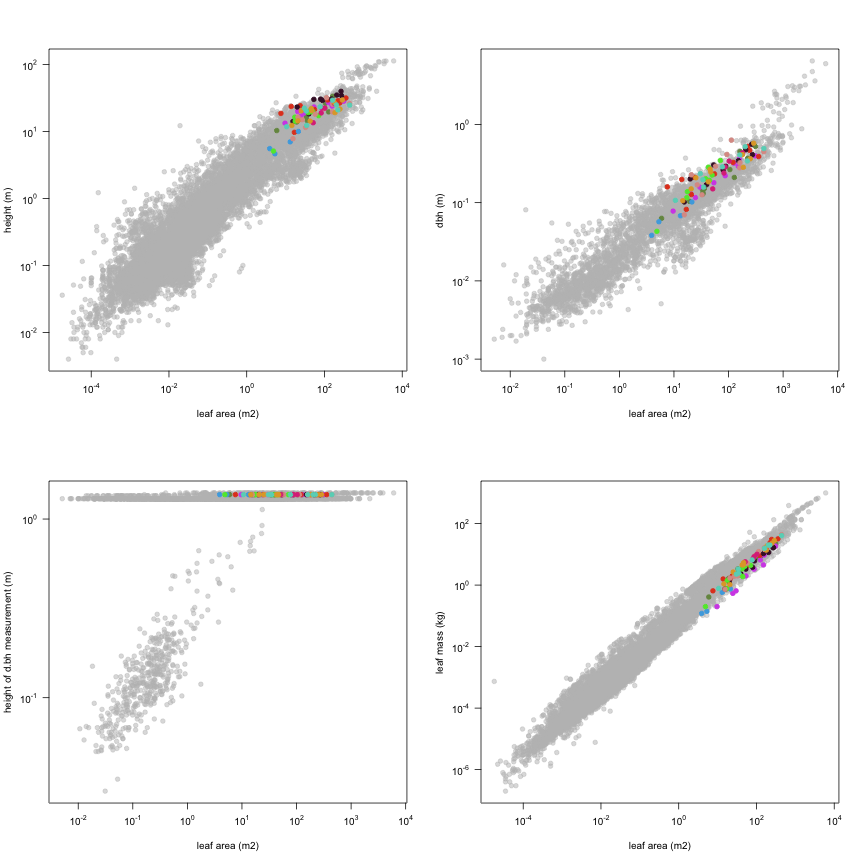
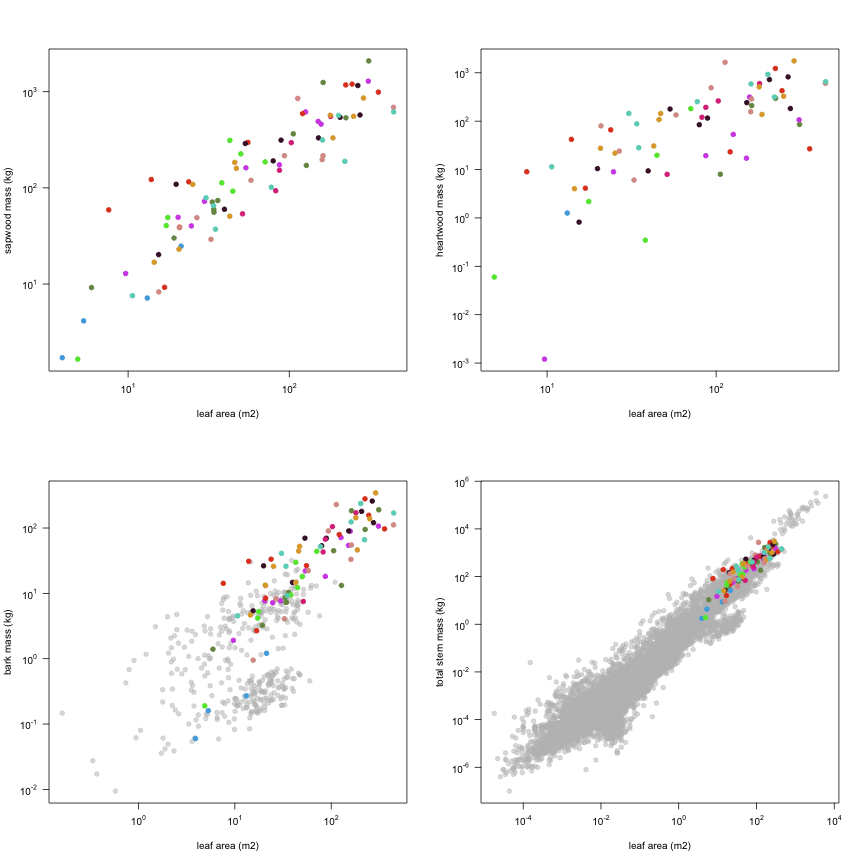
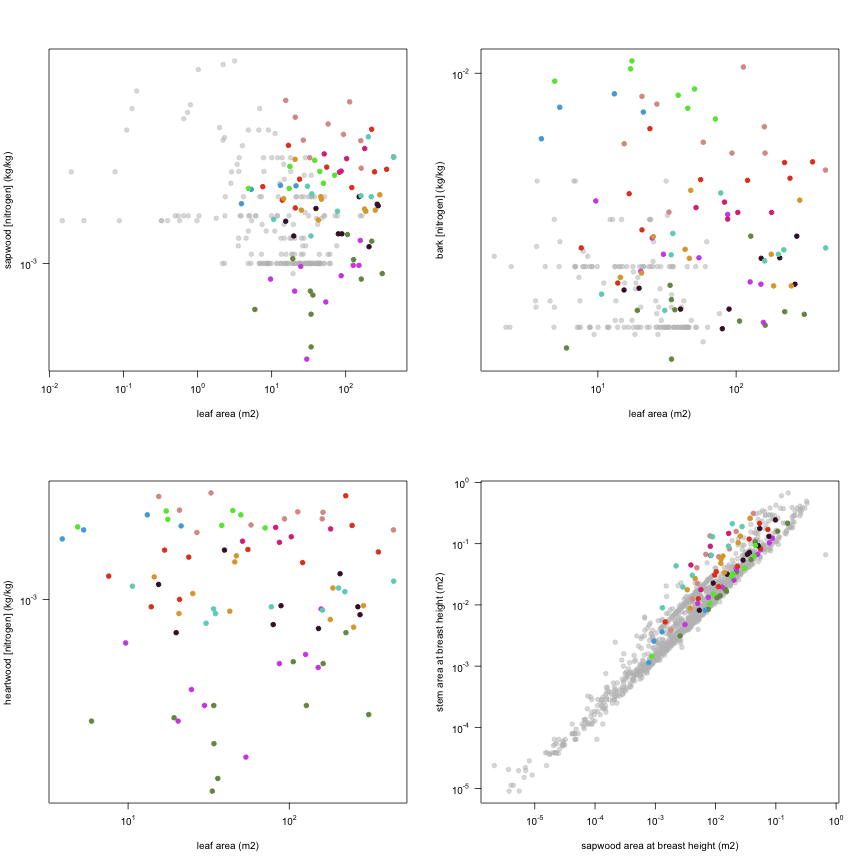
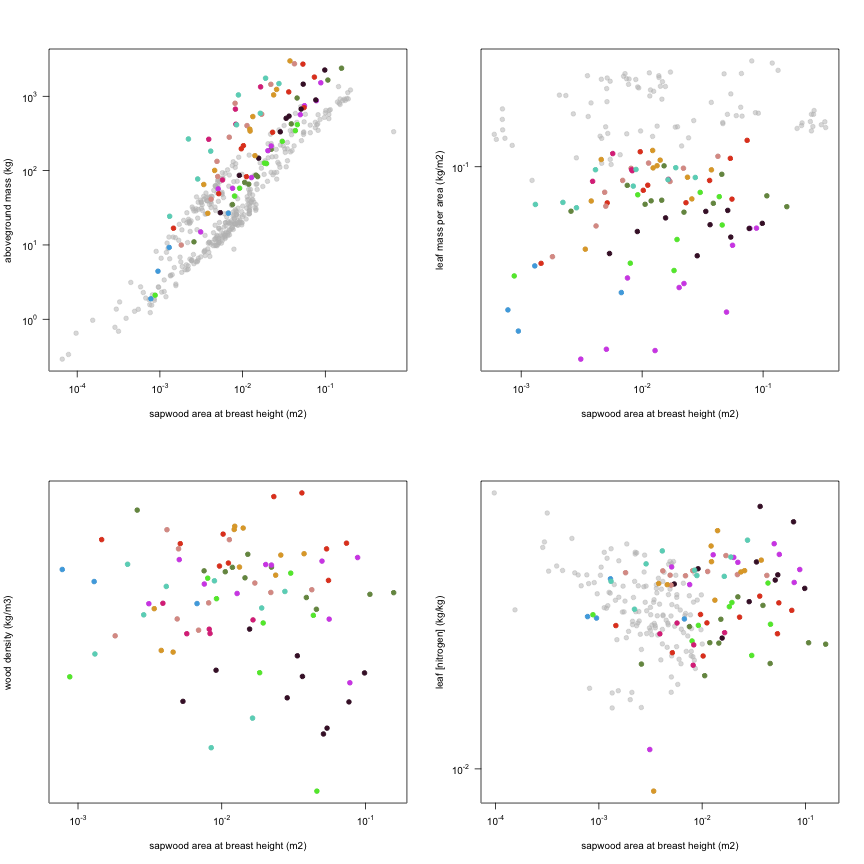
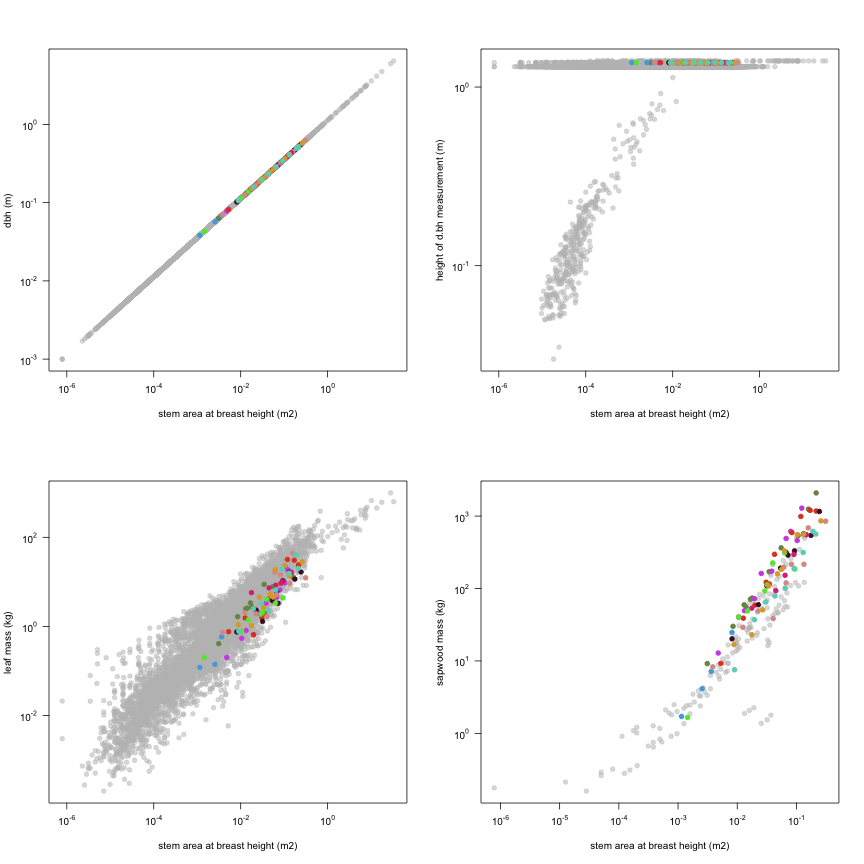
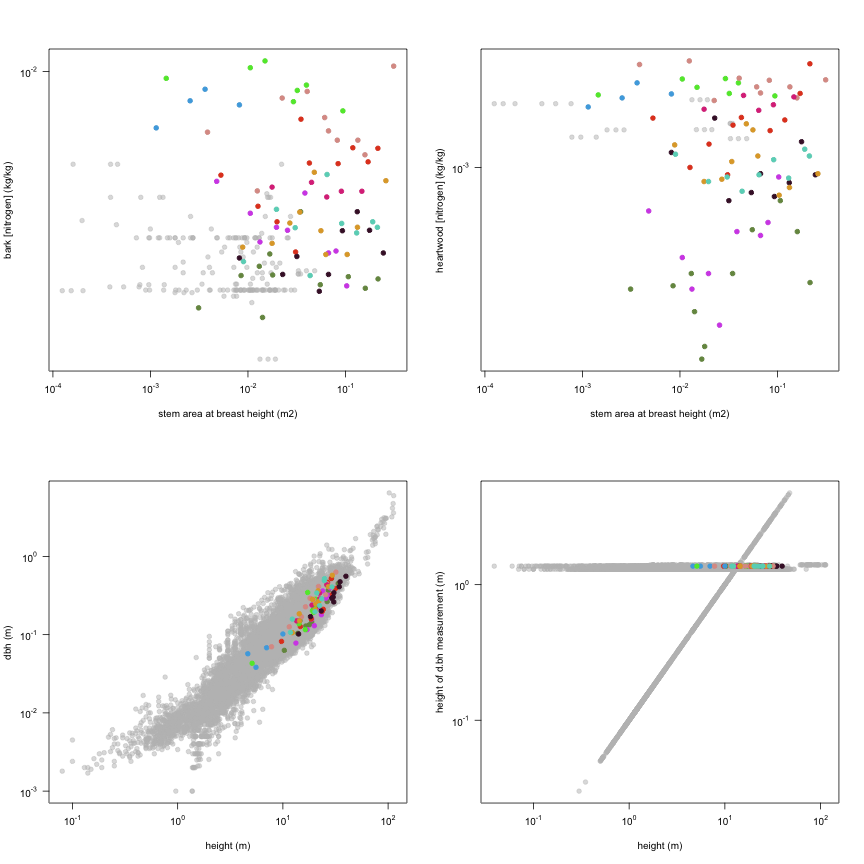
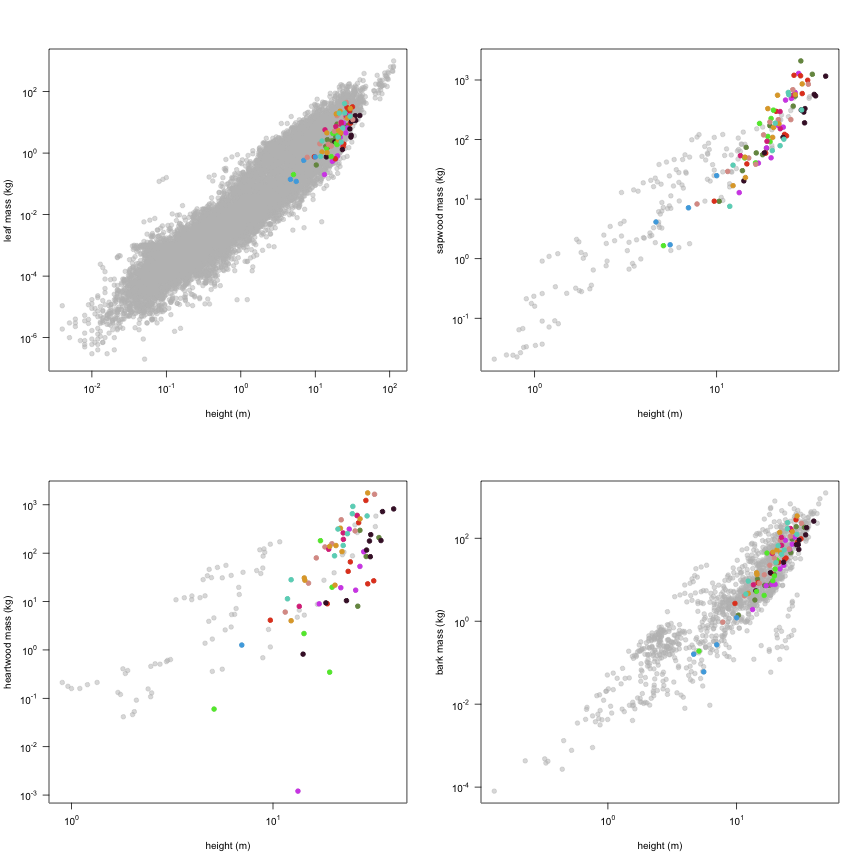
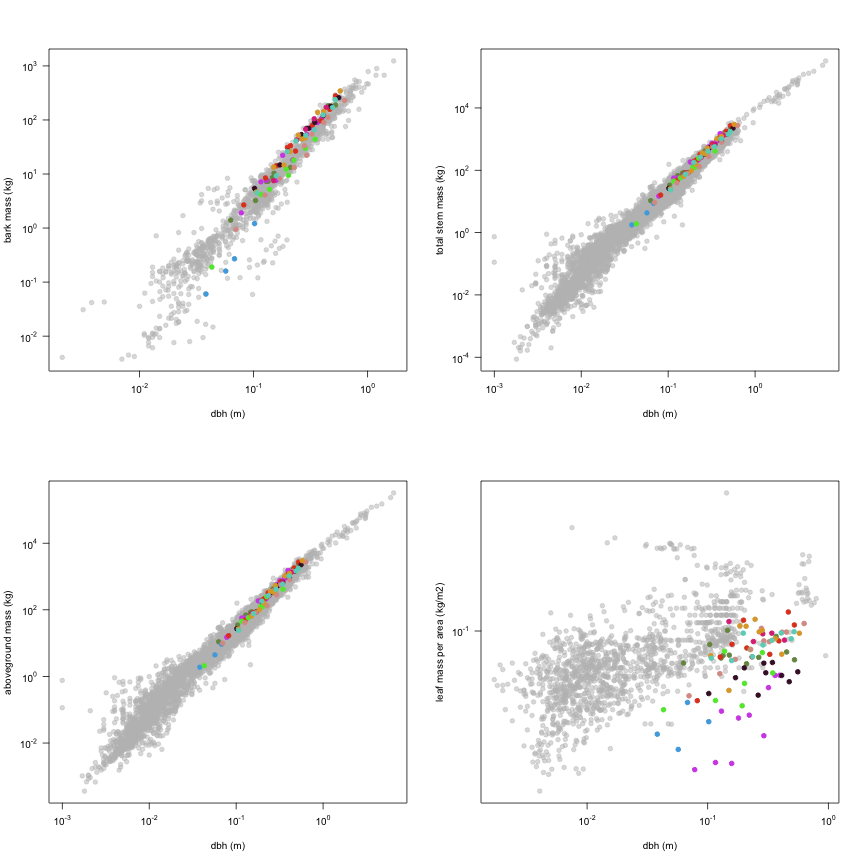
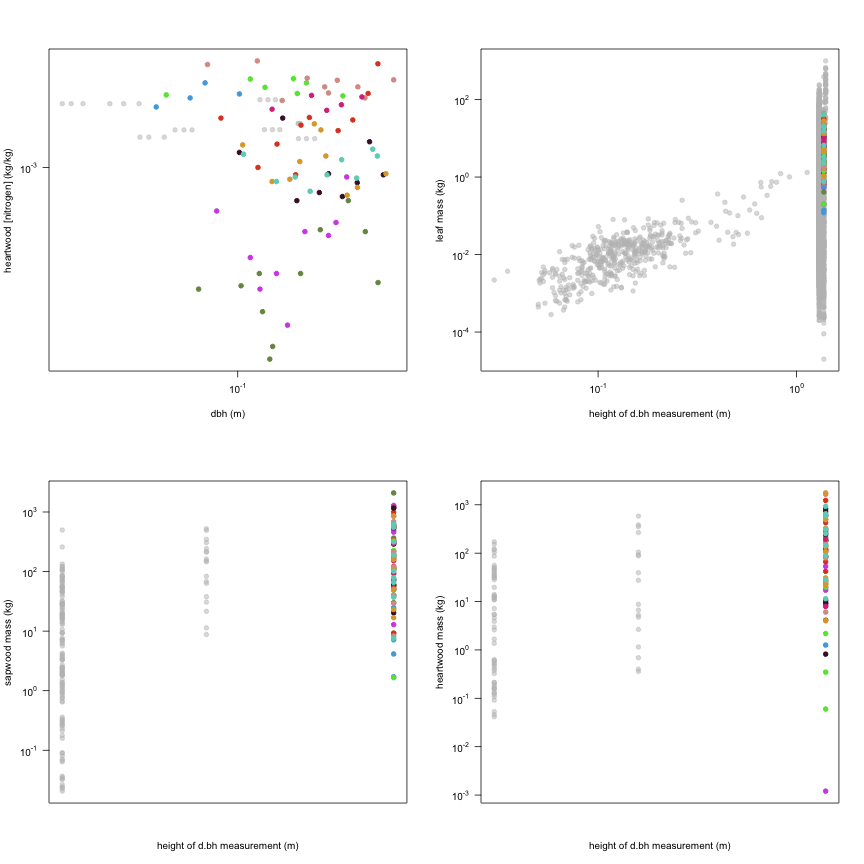
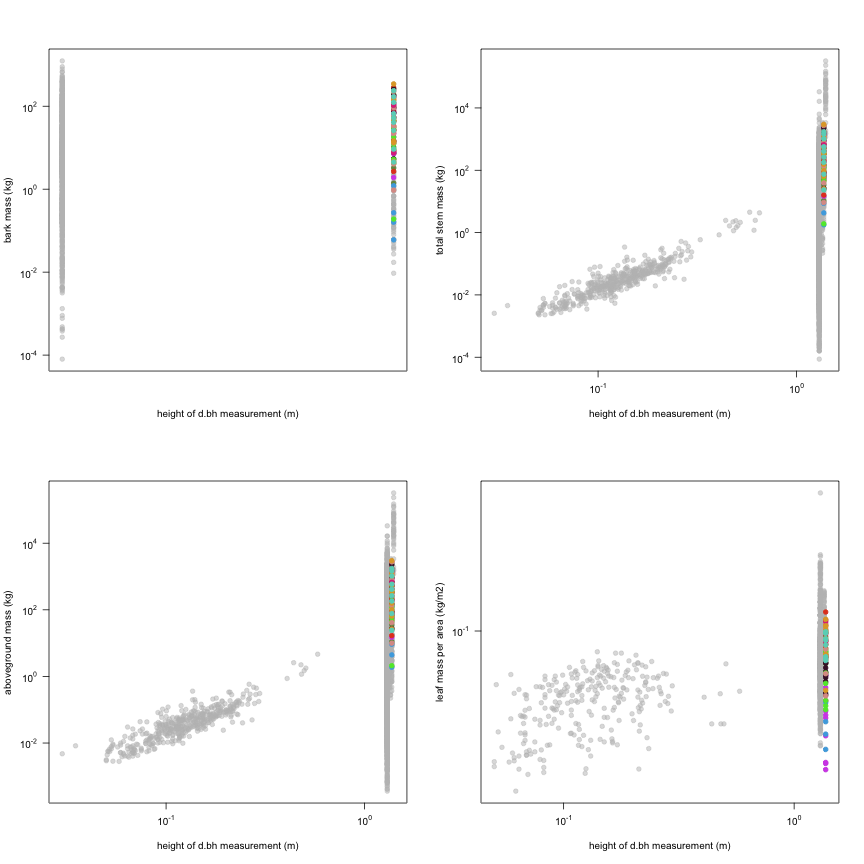
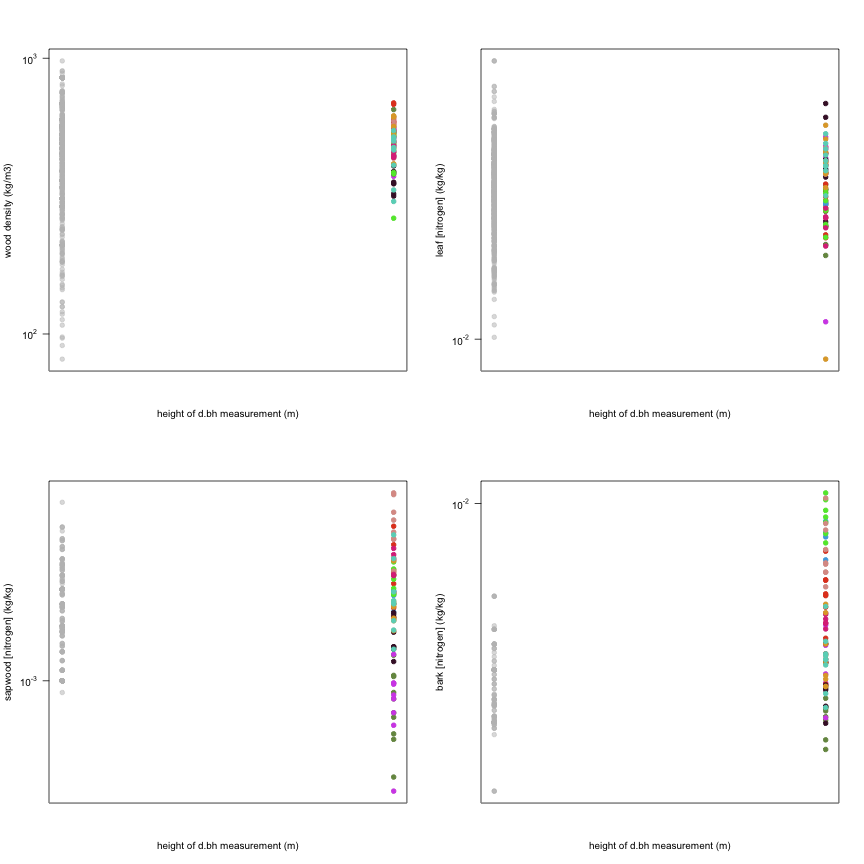
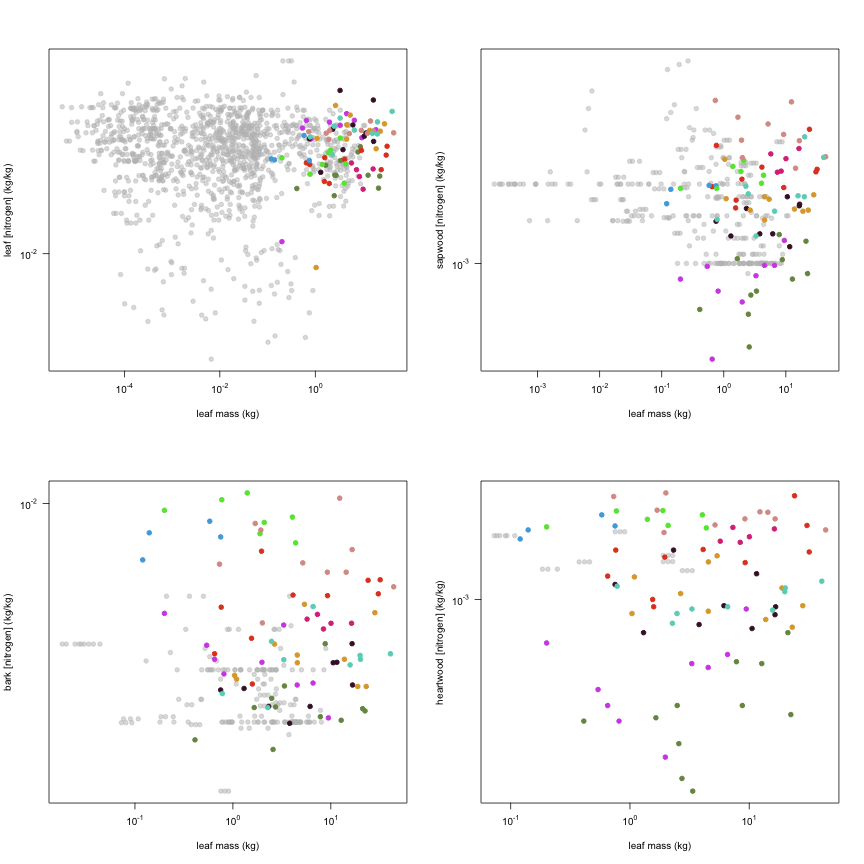
This is how the study Martin1998 fits in the entire dataset (grey). each colour represents a species. A legend of species names with colours is included at the end for reports with 1 < n < 20 species.