Williams2005
Data contributor: Richard Williams, Lindsay Hutley
Email: [email protected], [email protected]
Address:
- CSIRO Ecosystem Sciences - Darwin, 564 Vanderlin Drive, Berrimah NT 0828, Australia
- School of Environmental and Life Sciences, Charles Darwin University, Darwin NT 0909, Australia
Citation: Williams R, Zerihun A, Montagu K, Hoffman M, Hutley L and Chen X (2005). 'Allometry for estimating aboveground tree biomass in tropical and subtropical eucalypt woodlands: towards general predictive equations.' Aust. J. Bot., 53(7), pp. 607-619.
DOI:
Abstract: A fundamental tool in carbon accounting is tree-based allometry, whereby easily measured variables can be used to estimate aboveground biomass ({AGB).} To explore the potential of general allometry we combined raw datasets from 14 different woodland species, mainly eucalypts, from 11 sites across the Northern Territory, Queensland and New South Wales. Access to the raw data allowed two predictor variables, tree diameter (at 1.3-m height; D) and tree height (H), to be used singly or in various combinations to produce eight candidate models. Following natural log (ln) transformation, the data, consisting of 220 individual trees, were re-analysed in two steps: first as 20 species--site-specific {AGB} equations and, second, as a single general {AGB} equation. For each of the eight models, a comparison of the species--site-specific with the general equations was made with the Akaike information criterion ({AIC).} Further model evaluation was undertaken by a leave-one-out cross-validation technique. For each of the model forms, the species--site-specific equations performed better than the general equation. However, the best performing general equation, ln({AGB)} = --2.0596 + 2.1561 ln(D) + 0.1362 (ln(H))2, was only marginally inferior to the species--site-specific equations. For the best general equation, back-transformed predicted v. observed values (on a linear scale) were highly concordant, with a slope of 0.99. The only major deviation from this relationship was due to seven large, hollow trees (more than 35% loss of cross-sectional stem area at 1.3 m) at a single species--site combination. Our best-performing general model exhibited remarkable stability across species and sites, when compared with the species--site equations. We conclude that there is encouraging evidence that general predictive equations can be developed across sites and species for Australia's woodlands. This simplifies the conversion of long-term inventory measurements into {AGB} estimates and allows more resources to be focused on the extension of such inventories.
The dataset includes records for 220 individuals from 14 species belonging to 3 family(ies), presenting 1 functional type(s), growing in 1 condition(s) within 2 major type(s) of habitat, with data included for the following variables:
| Variable | Label | Units | N | Min | Median | Max |
|---|---|---|---|---|---|---|
| latitude | Latitude | deg | 220 | -31 | -15 | -12 |
| longitude | Longitude | deg | 220 | 131 | 133 | 151 |
| a.lf | Leaf area | m2 | 48 | 0.8 | 9.2 | 110 |
| a.stbh | Stem area at breast height | m2 | 220 | 0.00062 | 0.017 | 0.58 |
| h.t | Height | m | 220 | 2.9 | 9.7 | 26 |
| h.c | Height to crown base | m | 48 | 1.6 | 4.9 | 11 |
| d.bh | Dbh | m | 220 | 0.028 | 0.15 | 0.86 |
| h.bh | Height of d.bh measurement | m | 220 | 1.3 | 1.3 | 1.3 |
| c.d | Crown depth | m | 48 | 1.6 | 4.2 | 9.7 |
| m.lf | Leaf mass | kg | 106 | 0.16 | 2.7 | 57 |
| m.sb | Bark mass | kg | 48 | 0.6 | 5.4 | 32 |
| m.st | Total stem mass | kg | 106 | 1 | 56 | 1536 |
| m.so | Aboveground mass | kg | 220 | 1.6 | 83 | 3696 |
| m.br | Branch mass | kg | 106 | 0 | 17 | 1293 |
And locally within the country:
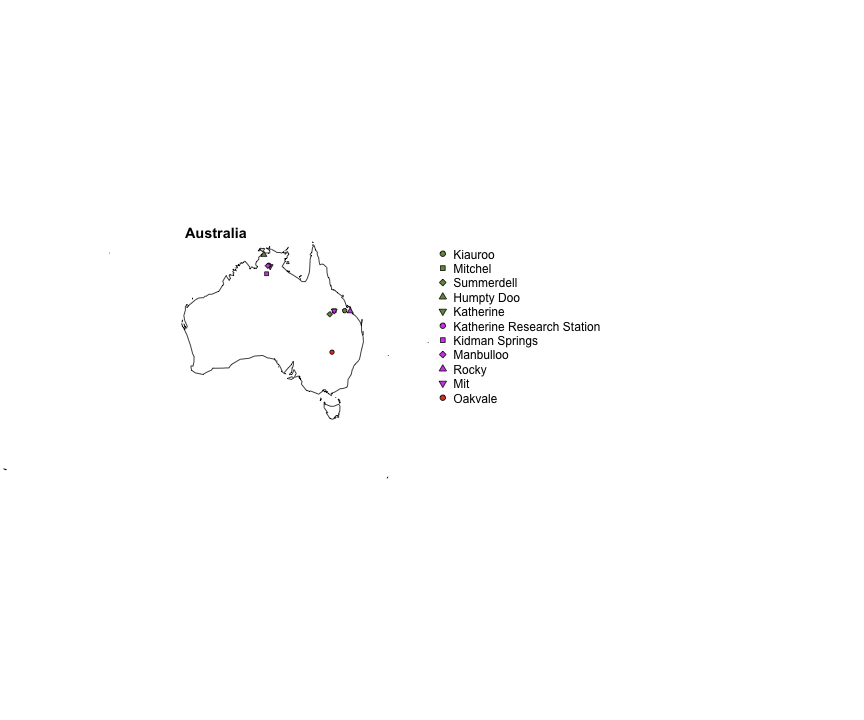
The sites sampled are:
| Location | Longitude | Latitude | Vegetation |
|---|---|---|---|
| Kiauroo | 149.33 | -23.08 | Woodland, Savannah |
| Mitchel | 147.00 | -23.10 | Woodland, Savannah |
| Summerdell | 146.00 | -23.75 | Woodland, Savannah |
| Humpty Doo | 131.30 | -12.50 | Woodland, Savannah |
| Katherine | 132.70 | -14.70 | Woodland, Savannah |
| Katherine Research Station | 132.40 | -14.50 | Woodland, Savannah |
| Kidman Springs | 131.90 | -16.10 | Woodland, Savannah |
| Manbulloo | 132.20 | -14.60 | Woodland, Savannah |
| Rocky | 150.56 | -23.17 | Woodland, Savannah |
| Mit | 147.00 | -23.10 | Woodland, Savannah |
| Oakvale | 146.50 | -30.92 | Woodland, Savannah |
The growing conditions of sampled plants was:
| Location | growingCondition |
|---|---|
| Kiauroo | field wild |
| Mitchel | field wild |
| Summerdell | field wild |
| Humpty Doo | field wild |
| Katherine | field wild |
| Katherine Research Station | field wild |
| Kidman Springs | field wild |
| Manbulloo | field wild |
| Rocky | field wild |
| Mit | field wild |
| Oakvale | field wild |
| Species | Family | Pft |
|---|---|---|
| Eucalyptus creba | Myrtaceae | evergreen angiosperm |
| Eucalyptus melanophloia | Myrtaceae | evergreen angiosperm |
| Eucalyptus populnea | Myrtaceae | evergreen angiosperm |
| Eucalyptus bleeseri | Myrtaceae | evergreen angiosperm |
| Eucalyptus miniata | Myrtaceae | evergreen angiosperm |
| Eucalyptus porrecta | Myrtaceae | evergreen angiosperm |
| Erythrophleum chlorstachys | Fabaceae | evergreen angiosperm |
| Eucalyptus tetrodonta | Myrtaceae | evergreen angiosperm |
| Terminalia ferdinandiana | Combretaceae | evergreen angiosperm |
| Eucalyptus foelscheana | Myrtaceae | evergreen angiosperm |
| Eucalyptus patellaris | Myrtaceae | evergreen angiosperm |
| Eucalyptus pruinosa | Myrtaceae | evergreen angiosperm |
| Eucalyptus tectifica | Myrtaceae | evergreen angiosperm |
| Eucalyptus terminalis | Myrtaceae | evergreen angiosperm |
Sampling strategy: Published and unpublished data sets for multiple species and sites across Australia were utilized to determine allometric relationships for tropical and subtropical euclaypt woodlands. A total of 220 individual trees of various sizes (basal area range: ~4 to 10 m2) were sampled to determine dry weight of leaves, branches and stems and allometric relationships. Trees grew under a range of enviroments from the wet-dry tropical region of the Northern Territory to the major savanna and woodland types of central and eastern Queensland, and New South Wales.
Height: Height was measured as the vertical distance from the ground to the highest apex.
Biomass: Aboveground biomass was estimated by direct harvest techniques. Trees were felled and separated into the component parts of trunk, branches and leaves. Fresh weight of all material was weighed and subsamples were dried at 65-80oC until constant mass for determination of the dry-mass correction factor.
Growth environment: Six sites in the wet-dry tropical region, with additional sites in the savanna and woodland plant community types of Australia.
Other variables: Mean annual rainfall provided where available.
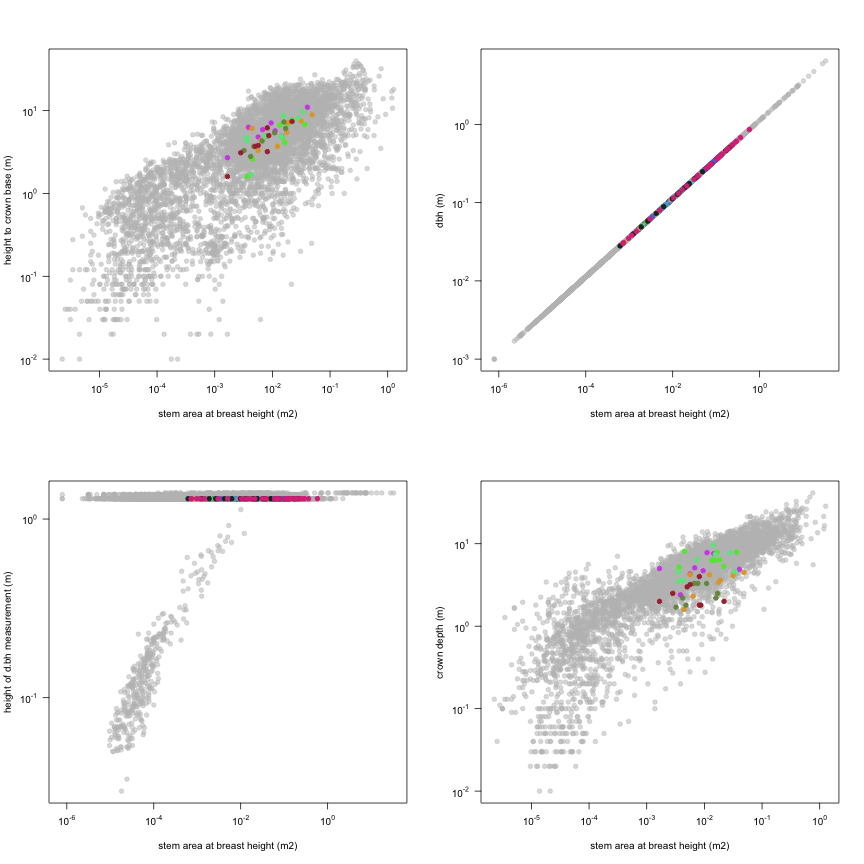
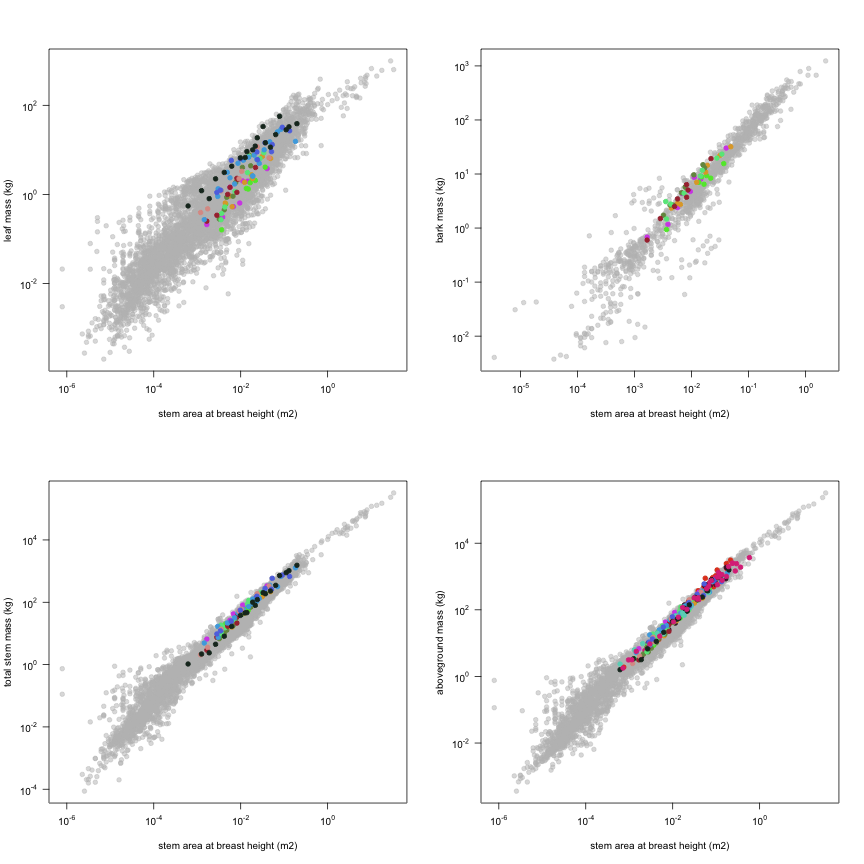
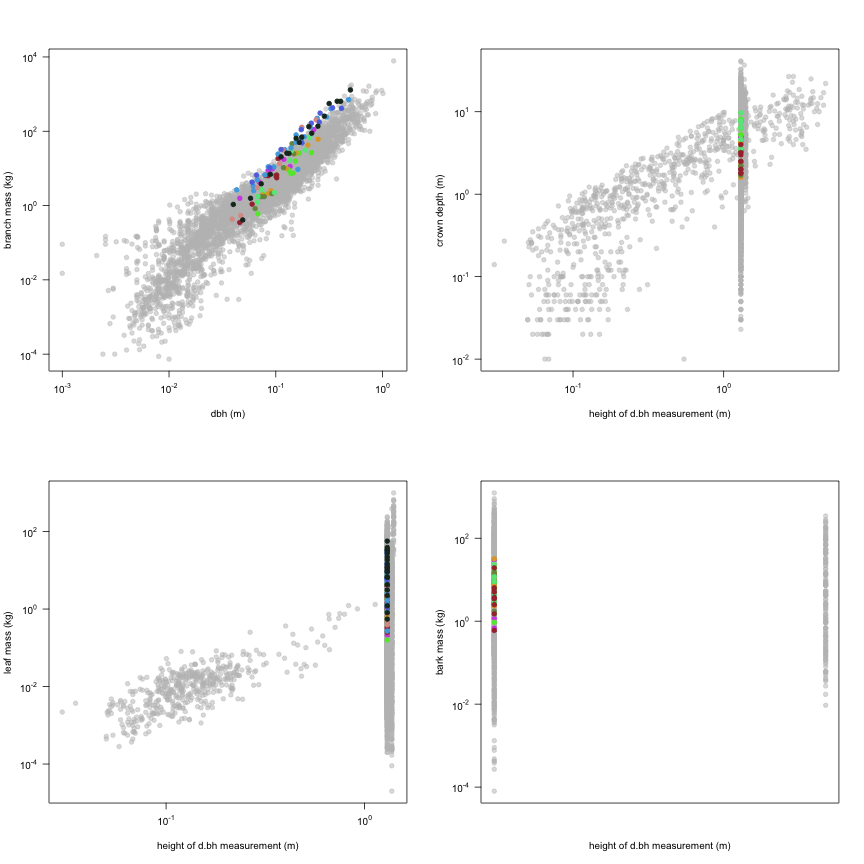
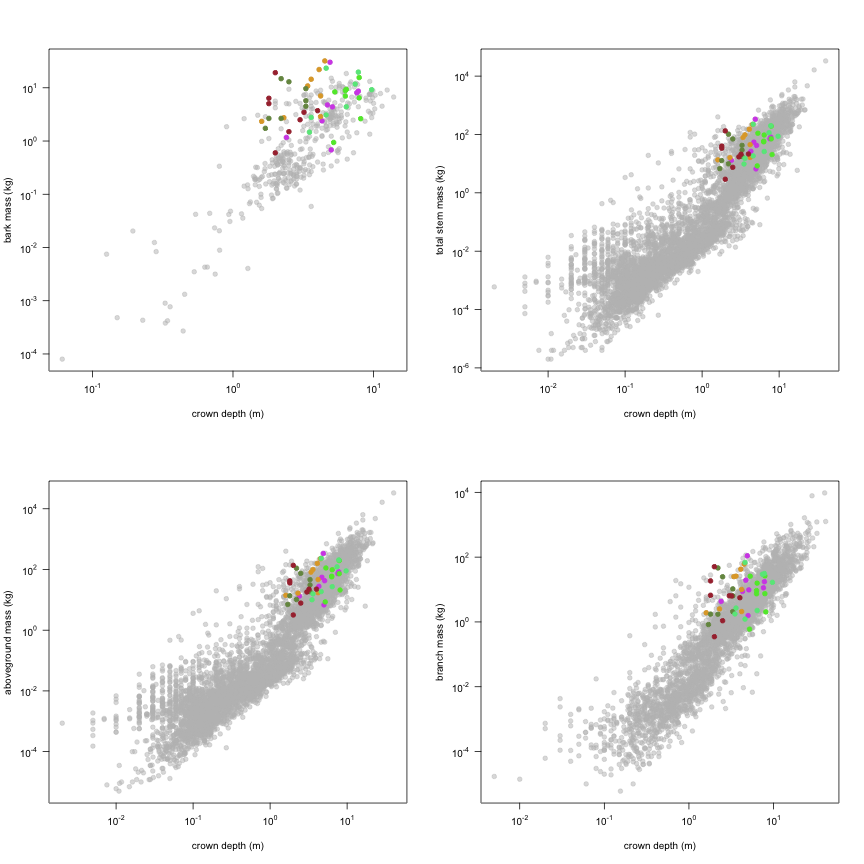
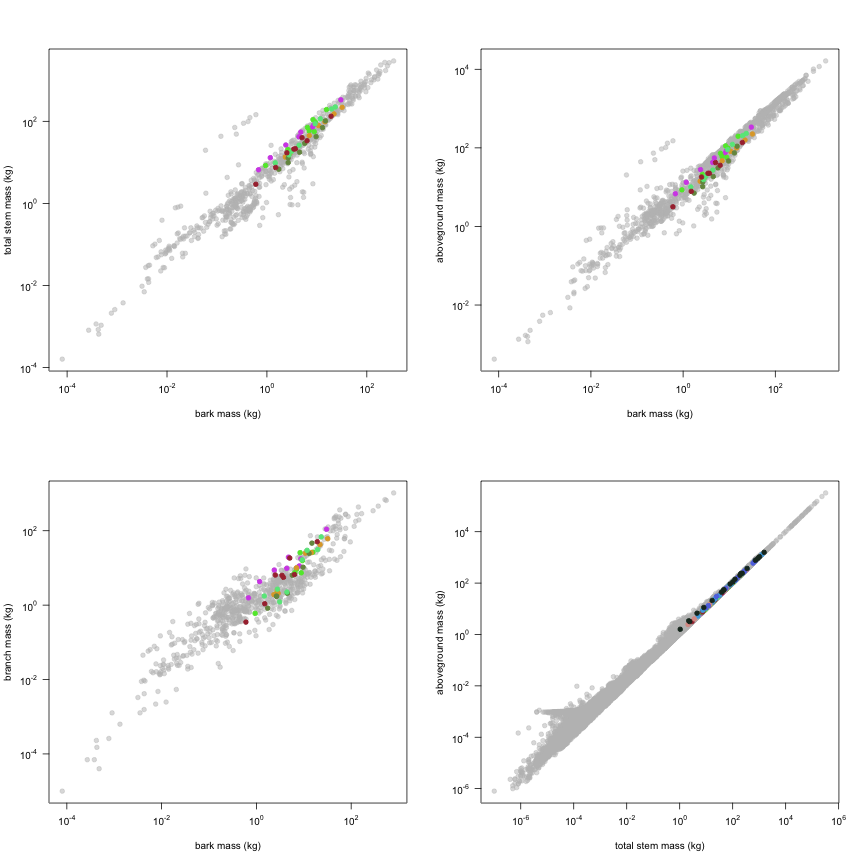
This is how the study Williams2005 fits in the entire dataset (grey). each colour represents a species. A legend of species names with colours is included at the end for reports with 1 < n < 20 species.