-
Notifications
You must be signed in to change notification settings - Fork 2
SWO
SWO tracing technology is available in MCUXpresso for VS Code. It is based on capturing events occurring on a running MCU in real time.
Note: SWO debug features will only be available if supported by the target MCU, target board and the project being debugged has correct pin muxing and clock setup.
The ITM block provides a mechanism for sending data from your target to the debugger via the SWO stream. This communication is achieved through a memory-mapped register interface. Data written to any of 32 stimulus registers is forwarded to the SWO stream. Unlike other SWO functionality, using the ITM stimulus ports requires changes to your code and so should not be considered nonintrusive.
ARM’s CoreSight debug architecture allows data to be sampled and streamed from the MCU to the host completely non intrusively. This scheme allows events such as periodic PC sampling, interrupts, etc. to be captured and transmitted by the debug probe with no effect on MCU performance and without the need for any code instrumentation or changes.
The Serial Wire Output (SWO) tools provide access to the memory of a running target, and facilitate Trace without needing to interrupt the target. Support for SWO is generally provided by all Cortex-M based MCUs, except those based on Armv6-M architecture. Cortex-M0 and Cortex-M0+ based MCUs do not have SWO capabilities. SWO requires just one extra pin in addition to the standard Serial Wire Debug (SWD) connection (but cannot be used if a JTAG debug connection is being used). MCUXpresso for VS Code presents target information collected using SWO from a Cortex-M3/M4 based MCU in ITM Console.
To use SWO Trace’s features, you must be debugging an application on a Cortex-M3/M4/M7/M33 based MCU, connected via a supported debug probe using the SWD protocol.
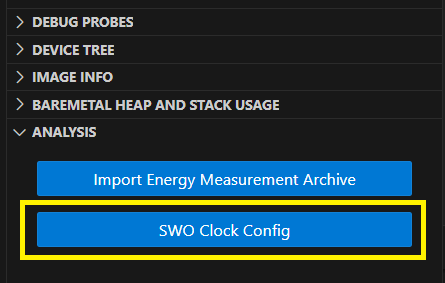
You may start SWO Trace at any time while debugging your program. When the program is stopped at a breakpoint or paused, in Analysis View the option for configuring the core clock is shown.

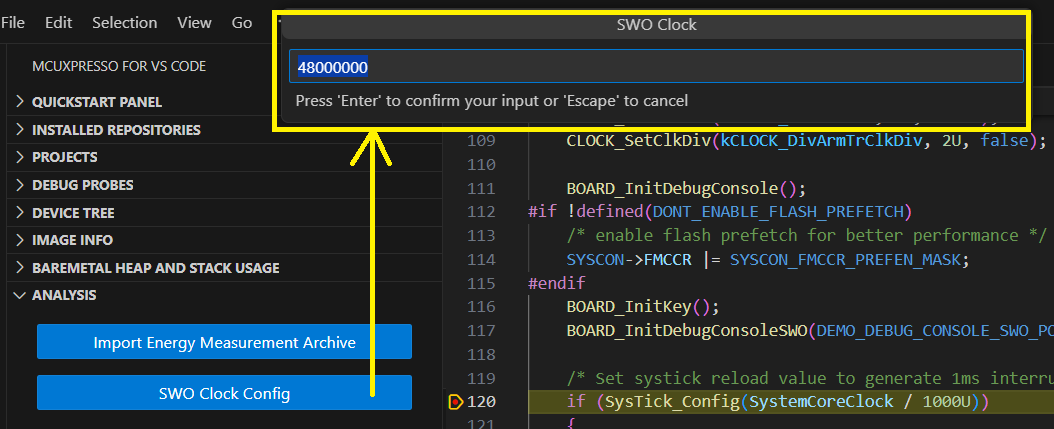
Due to the way the Trace data is transferred by the Cortex CPU within the MCU, setting the correct clock speed within the SWO Trace interface is essential to determine the correct baud rate for the data transfer. If the clock speed setting does not match the actual clock speed of the processor then data will be lost and/or corrupted. This can result in no data being visualized, or unexpected Trace data.
SWO Trace attempts to read the clock speed from the SystemCoreClock global variable and will suggest that value if found. The SystemCoreClock is usually set to the current clock speed of the target. Take care to use it after the application has set the clock speed for normal operation, otherwise it may provide an inappropriate value. If that variable does not exist or has not been set to the core clock frequency you will need to manually enter the clock frequency.

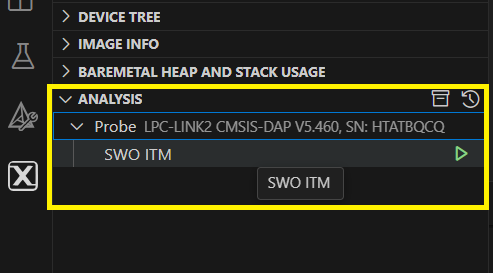
After the clock is properly configured, the ITM entry option will be available in Analysis view. The start/stop button can be used to enable/disable the ITM for the current debug session.

The ITM block provides a mechanism for sending data from your target to the debugger via the SWO stream. This communication is achieved through a memory-mapped register interface. Data written to any of 32 stimulus registers is forwarded to the SWO stream. Unlike other SWO functionality, using the ITM stimulus ports requires changes to your code and so should not be considered nonintrusive.
The ITM stimulus registers facilitate printf style debugging. MCUXpresso for VS Code uses the CMSIS standard scheme of treating any data written to stimulus port 0 (0xE0000000) as character data. A minor addition to your project can redirect the output of printf to this port. A special global variable is used to achieve scanf functionality, which allows the debugger to send characters from the console to the target. The debugger writes data to the global variable named ITM_RxBuffer to be picked up by scanf (scanf is not yet supported in MCUXpresso for VS Code).
For toolchain versions >= 12.3.2, inside the $HOME/.mcuxpressotools/arm-gnu-toolchain-add-ons-$VERSION/features/src you will find the file retarget_itm.c, which can be used to provide the above functionality for the C library printf and scanf functions, in case the project is using semihost debug console. The file must be added to the source project folder. Also, the path to the retarget_itm.c file must be added under add_executable in the CMakeLists.txt file, so it would be considered at build time. This provides better performance than the standard semihosting mechanism, as the MCU does not have to temporarily drop into debug state and hence stop execution to transfer the data.
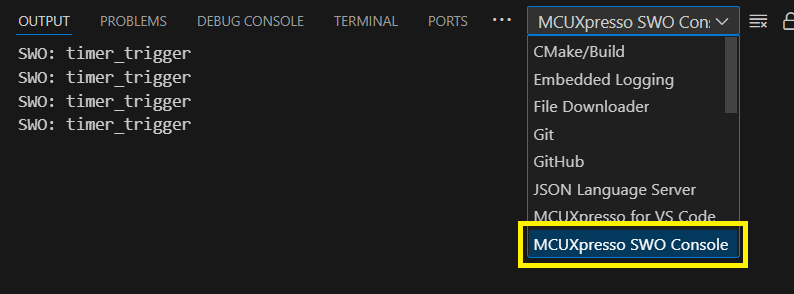
Data written to the ITM stimulus port 0 is presented in the MCUXpresso SWO Console. The View shows the ITM console for the active debug session. For now, only the output mechanism is available.

Use this GitHub Issues section to report ambiguities or problems encountered in this documentation. For MCUXpresso for Visual Studio Code extension issues, feedback or search for solutions and ideas please follow Community page.
Table of contents
Dependency Installation
General
Software Repositories
Project Management
Flash and Debug
Reference Guides
- Getting Started with MIMXRT1060-EVK
- Training Zephyr Getting Started
- TrustZone Examples on LPC55S6x and MCUXpresso SDK
- Multicore Examples on LPC55S6x and MCUXpresso SDK
- SDRAM Examples on RT1060 and MCUXpresso SDK
- Getting Started with MCX using Application Code Hub
- AN14120: Debugging Cortex-M on i.MX 8M, i.MX 8ULP, and i.MX 93
Troubleshooting
Useful links