-
Notifications
You must be signed in to change notification settings - Fork 2
Debug Views
Once a debug session starts, the Debug toolbar will appear on the top of the window.

The available actions are Reset device, followed by the Standard debug actions provided by Visual Studio Code.
Reset device can be used to issue the commands required for a target reset. preResetCommands and postResetCommands can be used in the launch configuration to execute GDB commands before and after the reset. After the target is reset, execution is resumed until it reaches the symbol specified by stopAtSymbol (main by default).
Restart vs Reset: Restart simply terminates the current debug session and starts debugging again using the same launch configuration. Reset is usually preferred because it is faster and more meaningful.
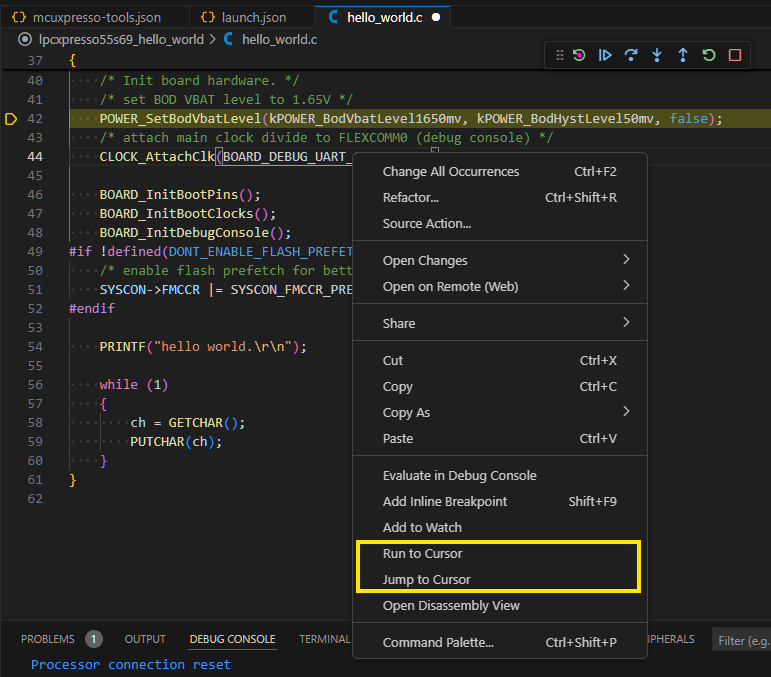
Right clicking inside a source file during debugging reveals two more run control actions:
- Run to Cursor: Place a temporary breakpoint on the cursor's location and resume execution.
- Jump to Cursor: Move the instruction pointer to the cursor's location.
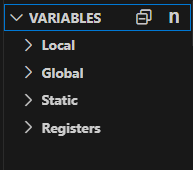
Variables View is automatically populated when a debug session starts. It displays all the available variables in 4 major groups: Local, Global, Static and Registers.
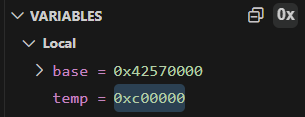
All these variables can be accessed by the debug chain (read and potentially written) while the debug session is paused. The value of the variable displayed corresponds to the value in memory. Optional, the values can also be displayed as hex:
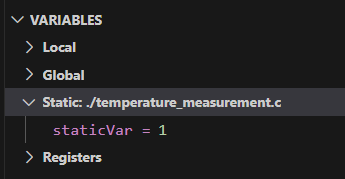
The values of the static variables will be available when the debug session will be paused in the corresponding source file:
Right-click menu on variables shows a list of actions. The variable value can be changed, the variable can be copied as value or expression. Also, it can be used to set breakpoints:
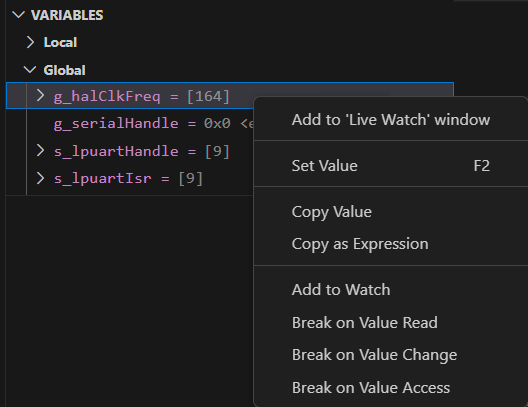
Any variable can be added to Watch View and any global and static variables can be added to Live Watch view.
When the debugger starts, it automatically sets an initial breakpoint on the first statement in main() if the default launch configuration is used.
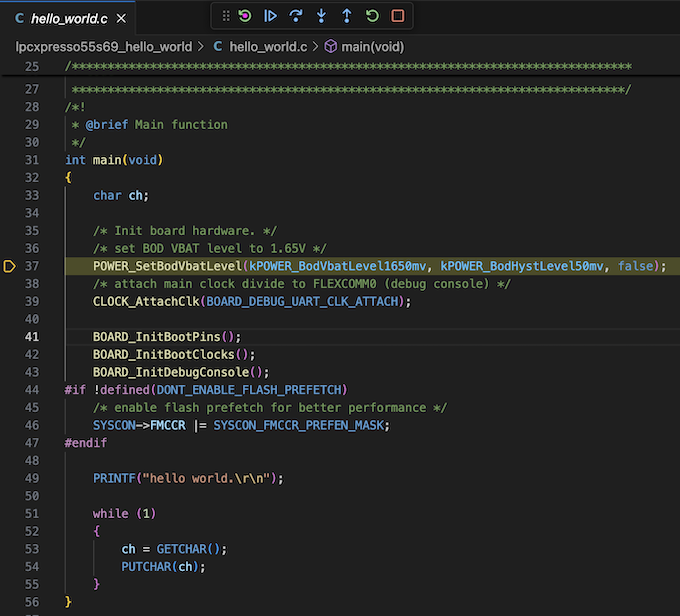
If desired, you can change where this initial breakpoint is set by changing stopAtSymbol in the launch configuration. To disable the initial breakpoint, remove stopAtSymbol in the launch configuration.
When viewing the source during a debug session, you can toggle breakpoints by simply clicking in the leftmost side of the source view. You can do this when the target is paused or running.
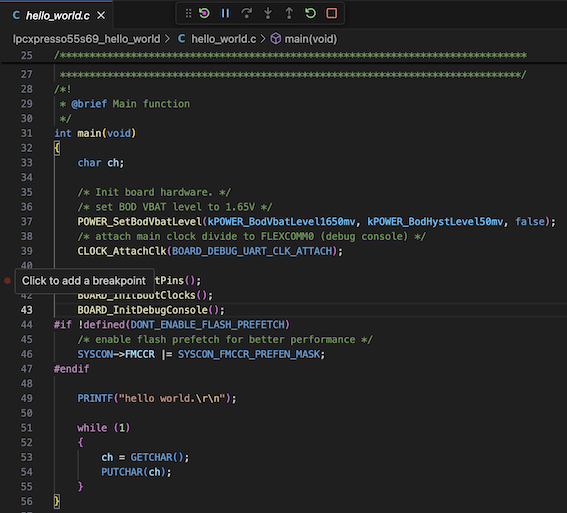
Breakpoints are displayed in the BREAKPOINTS view. You can use this view to add, delete or disable the breakpoints, for more details follow Breakpoints documentation provided by Visual Studio Code.

Variables and expressions can also be evaluated and watched in the Run and Debug perspective, in the WATCH view. Expressions added inside the WATCH view, are evaluated once the target is suspended in a breakpoint or watchpoint, or the Pause button from the Debug toolbar is pressed.
The WATCH view is visible in the Run and Debug perspective. The following screenshot illustrates the available toolbar buttons:
- Add Expression button that allows adding a valid C/GDB expression. It can contain simple/plain variable names or complex C/GDB expressions (for example: castint to specific types, dereferencing pointers, accessing structure data members, and much more).
- Toggle between hex format and natural format, used to display the results of the evaluations. The "natural" format is dictated by GDB.
- Remove All Expressions from the view.
- Collapse All child nodes expanded inside the view.

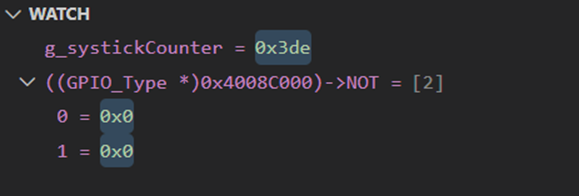
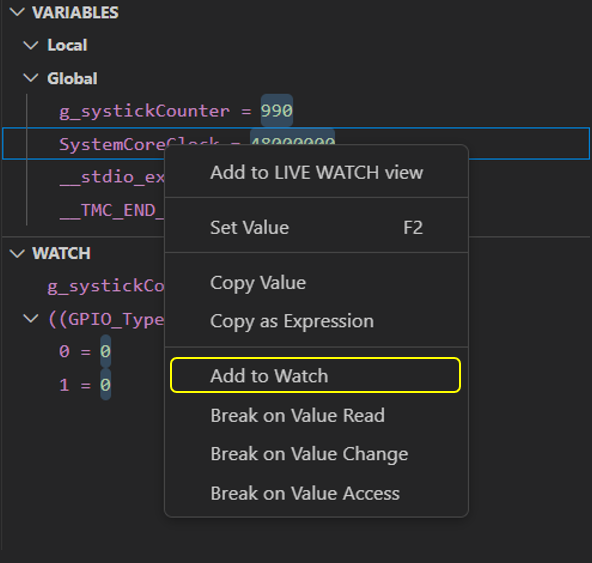
New expressions can be also added by using the VARIABLES view. Once right-clicking a variable inside the view, the "Add to Watch" context menu is displayed and can be used to add the variable to watched expressions.
Note: Expressions referencing local variables can only be evaluated when target is suspended inside the scope where the referenced local variables are available. Expressions that cannot be evaluated in a specific context will lead to error messages being displayed, as shown in the screenshot below.

MCUXpresso for VS Code extension also offers a LIVE WATCH view that can be used for monitoring the values of specific global or static variables, without suspending the target. Given that it comes with an overhead during an active debug session, LIVE WATCH functionality is disabled by default. When disabled, the view indicates this, as shown in the screenshot below.

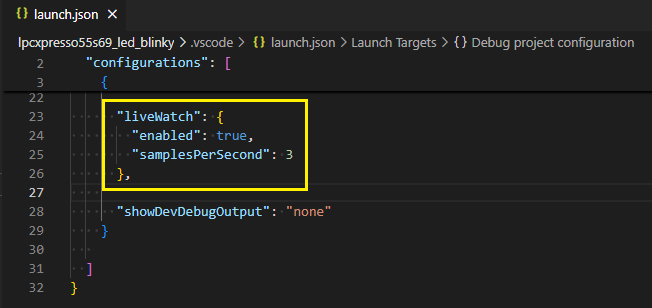
In order to enable live monitoring for variables, you must first enable this feature. Open the launch.json file and then add the liveWatch node with the enabled attribute.
Currently, LIVE WATCH works only when dealing with an active debug session linked to a SEGGER J-Link debug probe, LinkServer and PEmicro being unsupported at this point. In case the feature is explicitly enabled on unsupported probes, a warning notification will be shown in VS Code and also the view will make it clear that it is not supported for the currently used debug probe.

In order to add variables inside the LIVE WATCH view, there are several options:
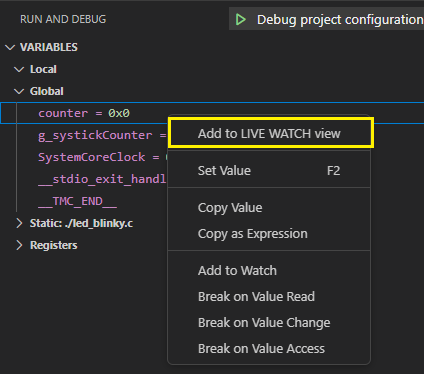
- Right-click a global variable inside the VARIABLES view and use the dedicated context menu action.
-
Use the "+" button available in the view's toolbar and type the name of a global or a static variable.
-
Use the command palette (Ctrl-Shift-P), type "Add Expression to LIVE WATCH" and then type the name of a global or a static variable.
Once added, items from the view can be edited in place. In order to remove a variable, or reorder the items from the view, use the dynamic toolbar that is activated when hovering items inside the view.

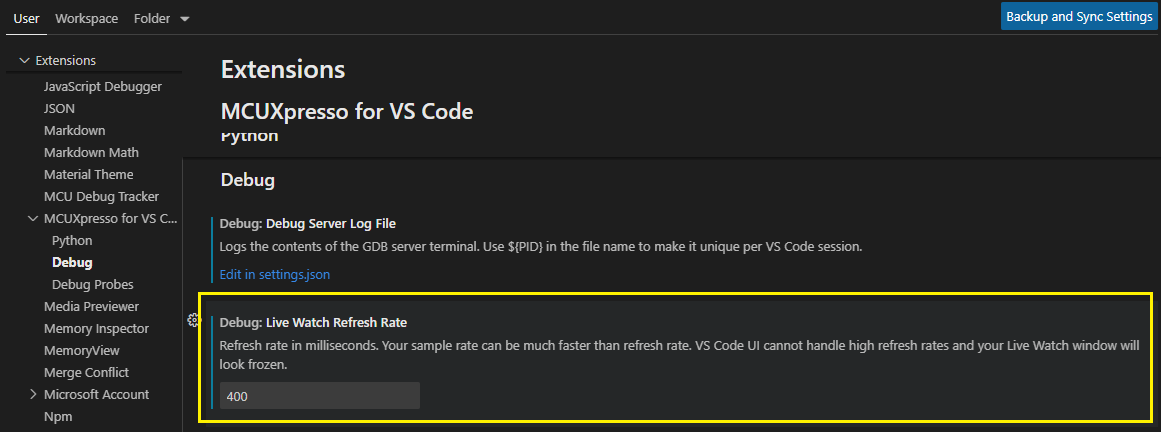
Once the debug session is resumed, the variables added inside the view are continuously evaluated and the values updated inside the view. Sampling rate is configured through the launch.json file by changing the value of samplesPerSecond attribute. Moreover, the refresh rate of the view is configured through the settings page.
Note that the usefulness of "live" variables reduces as the number of variables monitored increases, and ultimately there is a limit as to how many variables can be updated at the selected frequency.
RTOS thread-aware debugging is available in the Call Stack view once the scheduler has started.
Thus, it does not appear straight after loading the application when the default breakpoint on main() is reached.
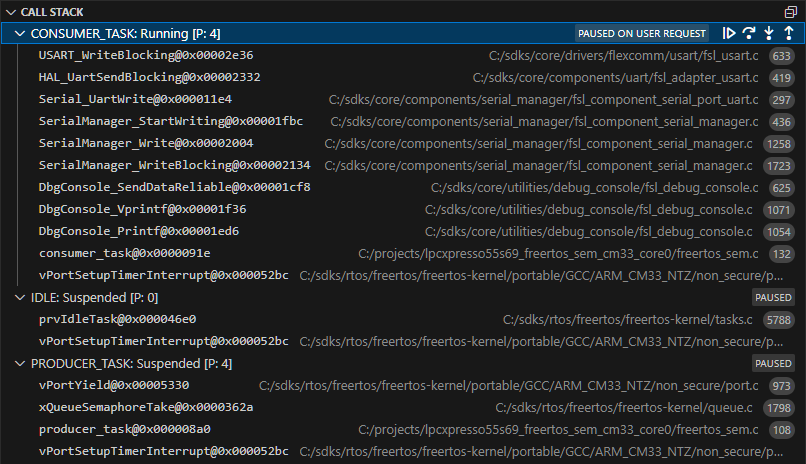
Thread-aware debugging is a feature specific to each debug solution (GDB server), thus there are small differences with regards to information presented in the Call Stack. Furthermore, Segger RTOS awareness needs to be manually enabled as described in the Enabling section below.
Debug works in stop mode. In other words, if the execution of a user task is halted either through a user action (halt) or a debug event (breakpoint, watchpoint, fault, and so on), the stopped thread is current and no application thread executes in the background.
The register context for any thread is available in the Variables view. For suspended or blocked threads, the registers that RTOS saves in memory before swapping out the thread will not change, regardless of which thread stack level is being examined within the Call Stack view.
No configuration is necessary for LinkServer and PEmicro.
For Segger, RTOS awareness must be manually enabled using the Segger specific rtos option in mcuxpresso-tools.json.
The value must be set to the Segger RTOS plugin corresponding to the RTOS being used in the project.
Auto-complete is available for known plugins provided by Segger.
Example:
{
  ...
  "debug": {
    ...
    "segger": {
      ...
"rtos": "GDBServer/RTOSPlugin_FreeRTOS"The Disassembly view allows the code of an application to be viewed at the assembly level (as generated by the compiler). The view can be enabled (if required) via the context menu in the editor.
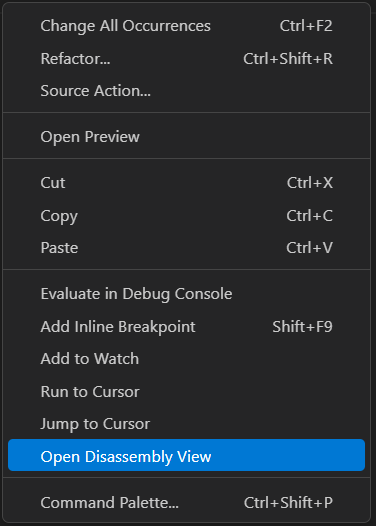
This has two functions, in that it both spawns the view and switches stepping mode from source level to assembly level. Assembly level stepping is typically used in conjunction with the Registers view to examine the detailed behavior of short pieces of code. Closing the Disassembly view will switch back to source stepping mode.
The Disassembly view can also be open from Visual Studio Code's Command Palette by executing 'Open Disassembly View'.
MCUXpresso for VS Code extension integrates Memory Inspector, a memory viewer extension provided by Eclipse CDT Cloud.
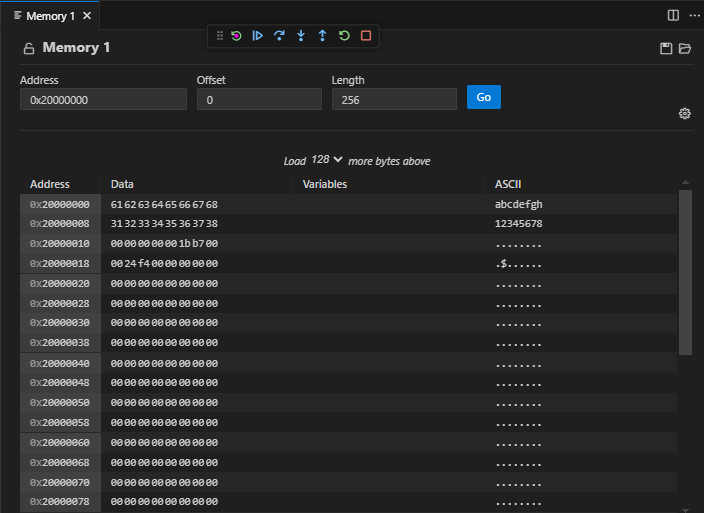
Once a debug session is started, this view is available by simply typing "Memory Inspector" in the command palette (Ctrl-Shift-P) and selecting "Memory: Show Memory Inspector" option.
Check the Advanced Display Options to customize the display format for the memory content.
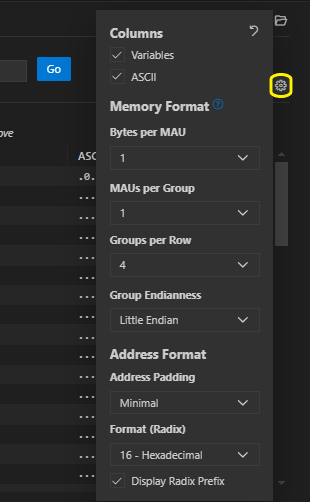
For more details about how to use this view, please visit: https://github.com/eclipse-cdt-cloud/vscode-memory-inspector/blob/main/README.md
Use this GitHub Issues section to report ambiguities or problems encountered in this documentation. For MCUXpresso for Visual Studio Code extension issues, feedback or search for solutions and ideas please follow Community page.
Table of contents
Dependency Installation
General
Software Repositories
Project Management
Flash and Debug
Reference Guides
- Getting Started with MIMXRT1060-EVK
- Training Zephyr Getting Started
- TrustZone Examples on LPC55S6x and MCUXpresso SDK
- Multicore Examples on LPC55S6x and MCUXpresso SDK
- SDRAM Examples on RT1060 and MCUXpresso SDK
- Getting Started with MCX using Application Code Hub
- AN14120: Debugging Cortex-M on i.MX 8M, i.MX 8ULP, and i.MX 93
Troubleshooting
Useful links