-
Notifications
You must be signed in to change notification settings - Fork 341
This Is Probably the Most Interactive Data Analysis Programming
Excel and BI are commonly used data analysis tools, and both are suitable for handling preliminary data analysis tasks, such as getting total sales in each month and finding average order amount and purchase frequency in each group. As business requirements grow, more complex tasks are hard to be handled with Excel or BI. Examples include finding intervals when a stock rises consecutively for at least 5 days, counting users who are active for 3 days continuously in every 7 days, and finding the distribution of numbers of users for 3-day, 7-day, 30 or more-day intervals between "registration" and "first purchase", and so on. These usually involve cross-row references, complex grouping operations, sliding windows or conditional judgments. It is hard to deal with them even with Excel, let alone BI tools. The only way is programming.
Programming languages have much better computing ability, but they are far less interactive compared with Excel and BI. In Excel, each time when we write or modify a formula, the result is displayed in real-time, and can be directly modified if we have another idea. This allows analysts to judge which action they should take according to the current result, enabling step-by-step exploration and analysis. Programming languages lack such an instant feedback mechanism. When there are only simple statements, SQL can produce an intermediate table for each step to view the result, but Excel is better at doing this. Often a computing task is rather complex if it needs to be implemented through programming. Its SQL code is often deeply nested, where subqueries cannot execute independently, and it’s very inconvenient to view intermediate results. Python can achieve stepwise programming to some extent, but it still needs print method to output the result, which can be obtained only by executing the whole code. These programming languages are far less interactive than Excel; the latter allows programmers to check any intermediate result whenever they want.
It seems that we can’t have both high interactivity and powerful computing ability. To enjoy the convenience interactivity brings, we have to tolerate the low computing ability; and having strong computing power means we can’t have the interactivity at the same time. This is the dilemma we face in handling many data analysis scenarios.
SPL (Structured Process Language) provides a good solution. With both powerful computing ability and interactivity as high as the interactive tools like Excel, the programming language is particularly suitable for performing data analysis.
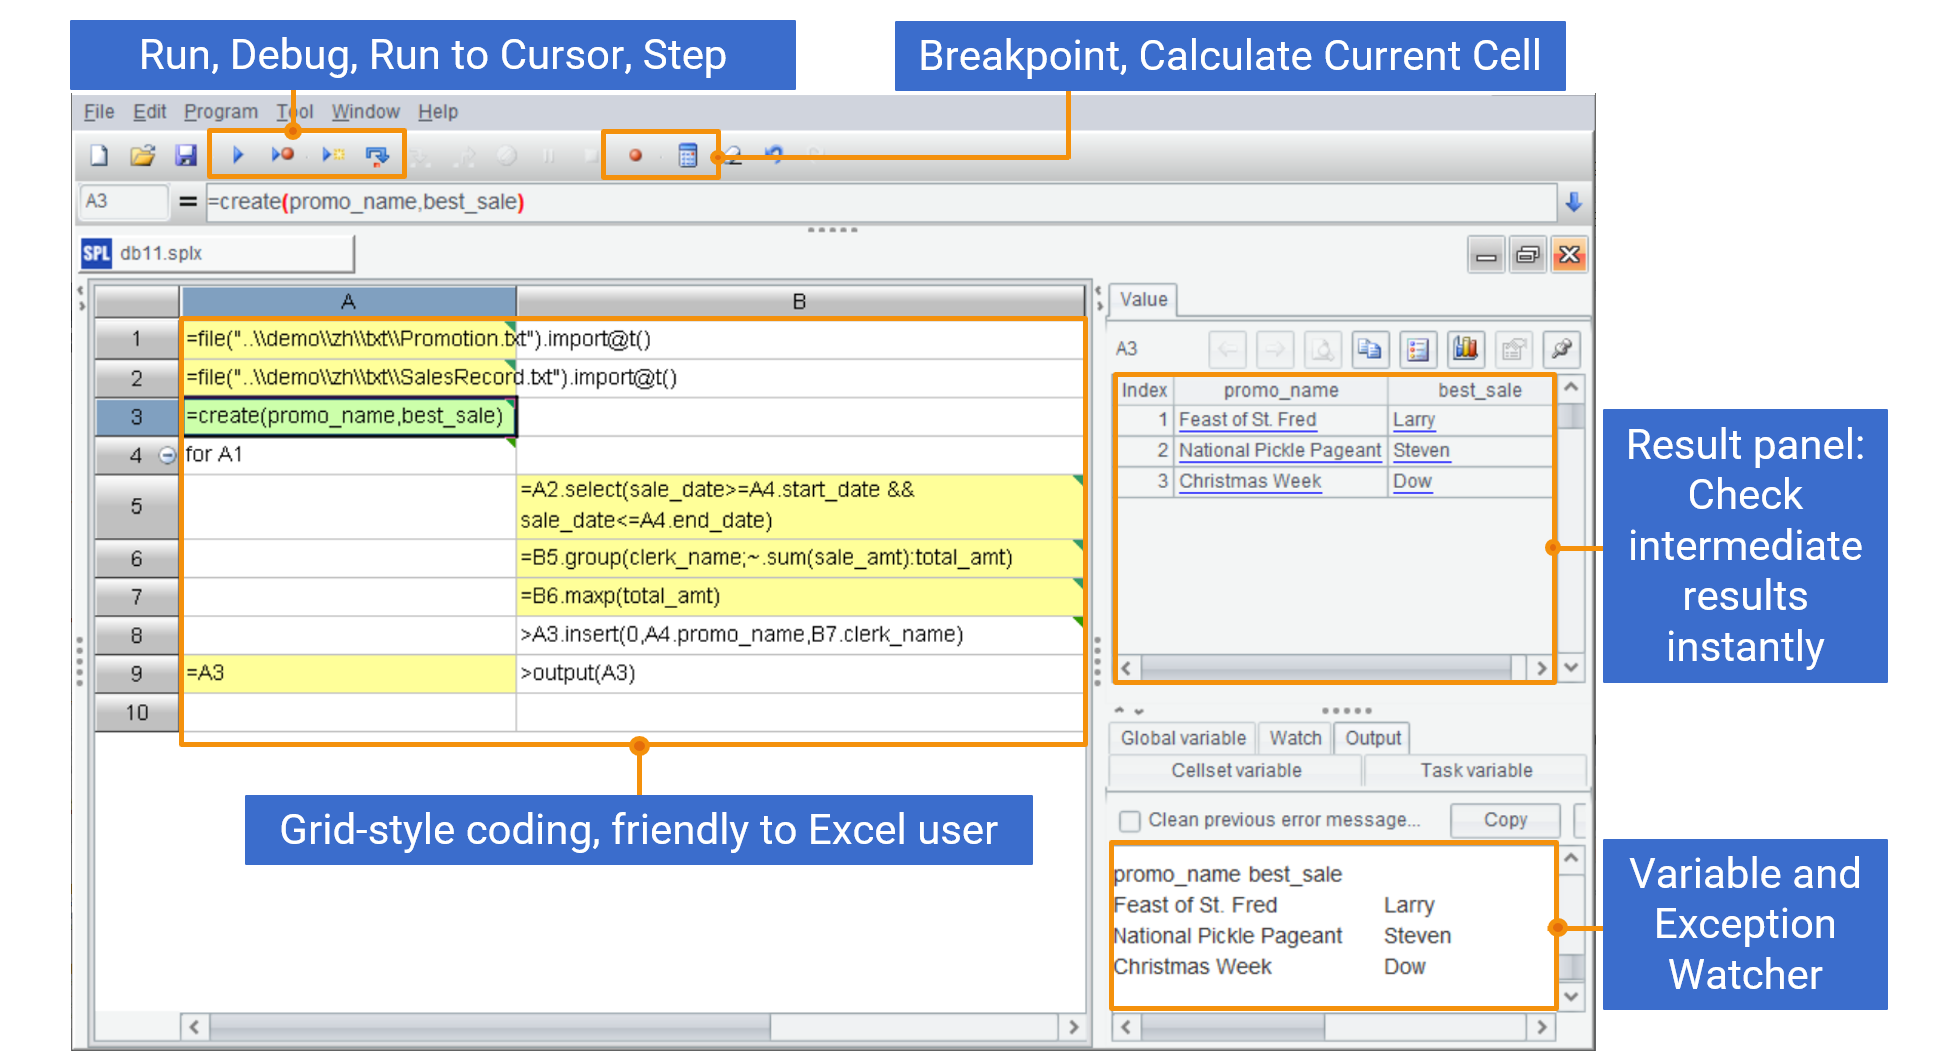
SPL features grid-style programming. It writes code in a grid. This is quite different from most text-style programming languages. Below shows the overall appearance and characteristics of SPL IDE:
One big benefit of coding in the grid is that cells are used to hold computing results, as Excel cells do. Steps are written in different cells, and the computing result of any cell – as in the Excel, can be viewed in real-time. Also, as Excel allows, a cell can reference the result of a previous cell through the name (like A1, B2), which is convenient and intuitive.
Find intervals when stocks rise consecutively for over 5 days
Code is written in Excel-like grid, where each cell’s result can be viewed in real-time and where cell name is used to reference the result.
Let’s take a closer look at the above code and experience SPL’s great interactivity.
A1 uses T() function to retrieve stock transaction records:
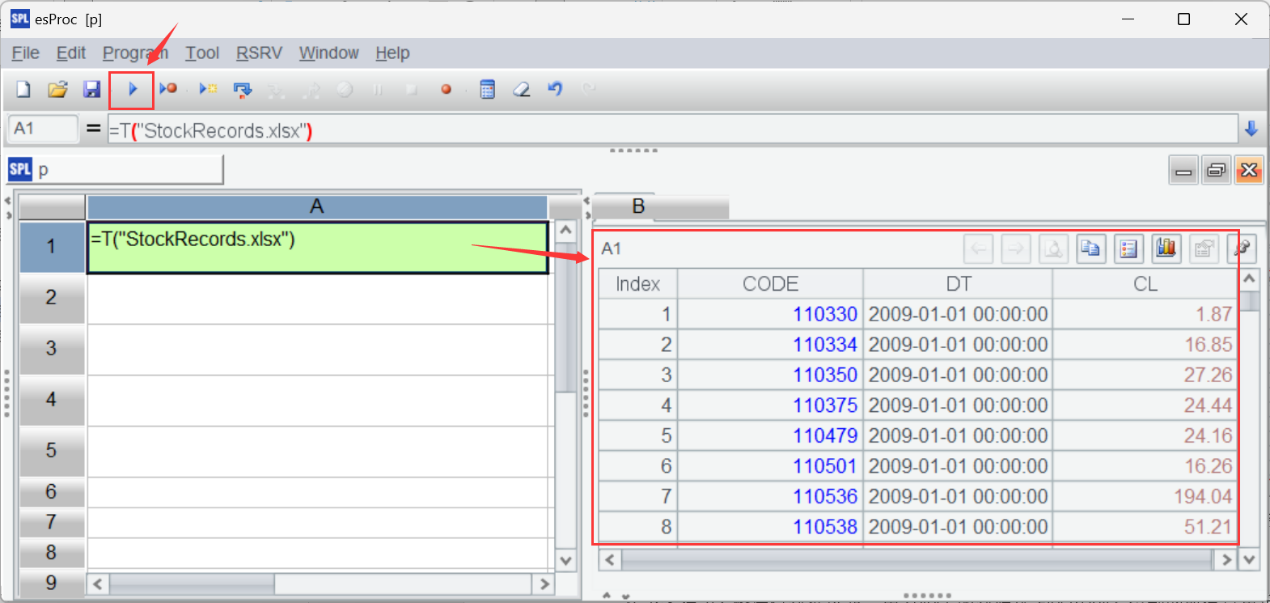
Next, A2 sorts records by stock code (CODE) and transaction date (DT). Click "Execute" and the sorting result is displayed on the result viewing panel on the right.
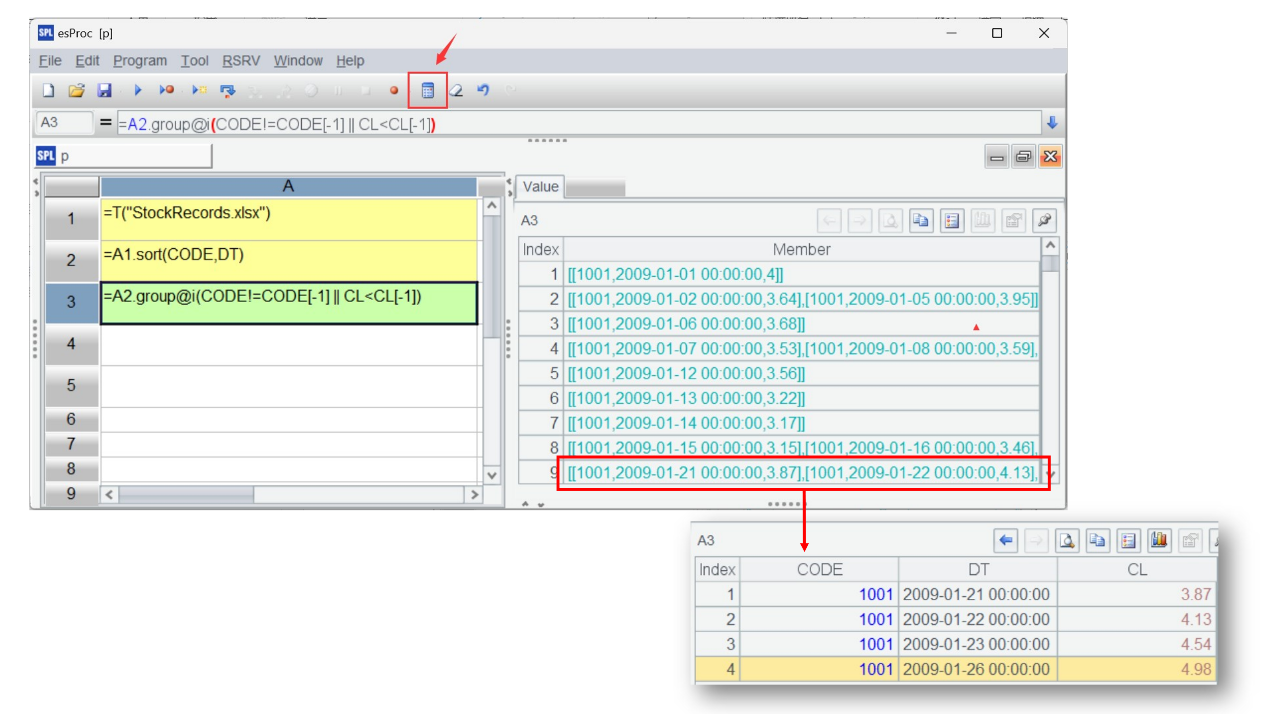
Then, A3 groups records by the specified condition, putting those having same CODE value and whose CL value is greater than that of the previous date in the same group. group() function works with @i option to create a new group whenever the condition is met. CODE[-1] and CL[-1] reference value of the previous row. The syntax is unique to SPL, and makes it convenient to implement the order-based computation. Moreover, SPL grouping operation retains the grouped subsets, which are returned as a set. This is another ability that many programming languages do not have.
Click "Calculate Active Cell" to calculate the current cell only
Click one grouped subset and its members are displayed
As the previous code is executed, there is no need to re-execute them, otherwise it will be a big waste of time when there are lots of steps or when the whole computation is data-intensive. So just click "Calculate Active Cell" icon (the blue calculator) on the toolbar to compute the current cell only. The computing result is then displayed on the right.
SQL naturally cannot take similar advantage because it cannot implement step-by-step computations. Python requires executing the whole code, so it cannot execute a step separately. Both are far less interactive and convenient than SPL.
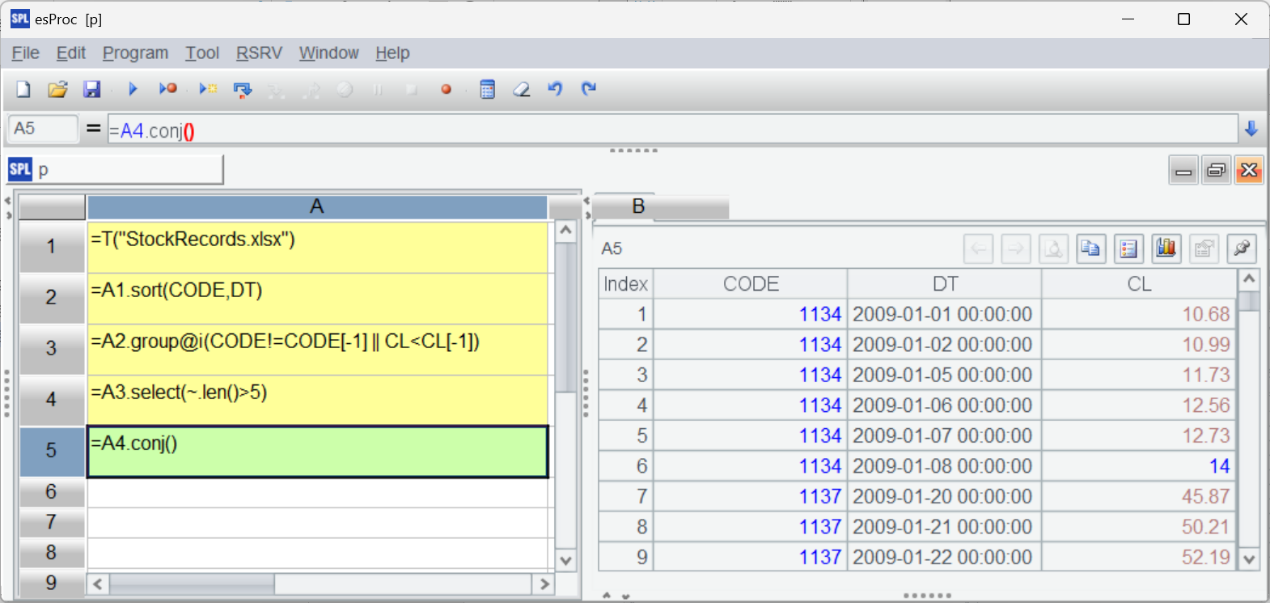
Now A4 uses select() function to get eligible intervals (when stocks rise for consecutive 5 days):
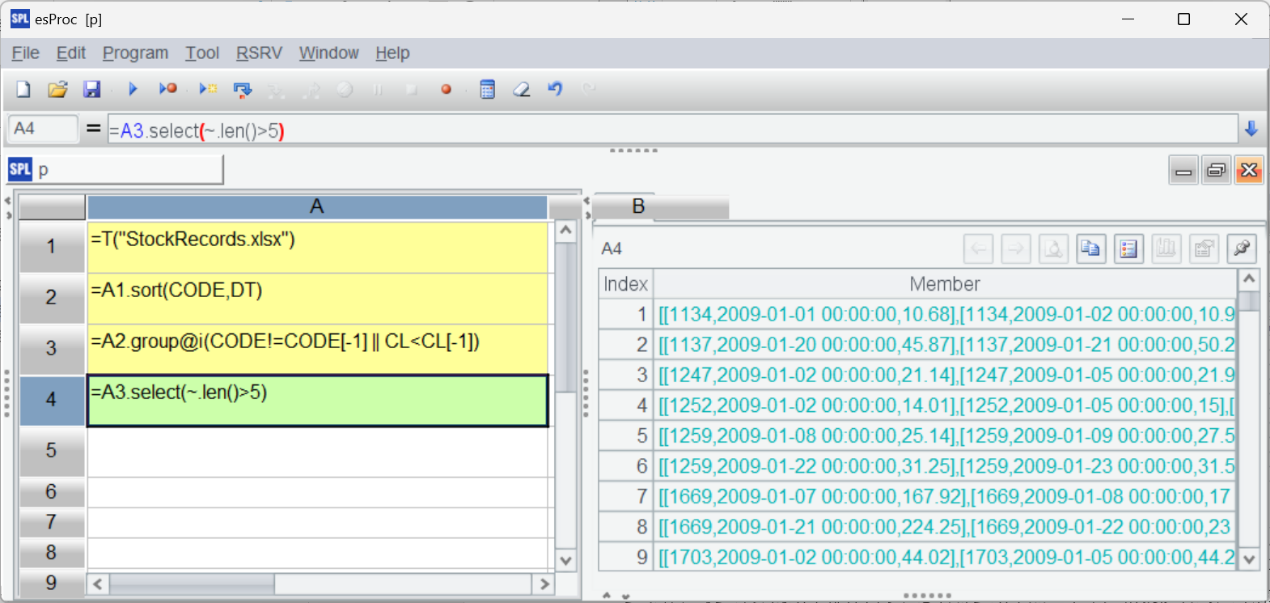
Lastly, A5 concatenates all eligible records:
It is not difficult for Excel to find the number of consecutively rising transaction dates. But as it does not have any method of retaining the grouped subsets and then getting the eligible intervals, it is difficult for the spreadsheet tool to implement the task. The only way here is resorting to manual search, which becomes infeasible when large volumes of data are involved. SPL, by contrast, offers more convenient computing method, as this example shows.
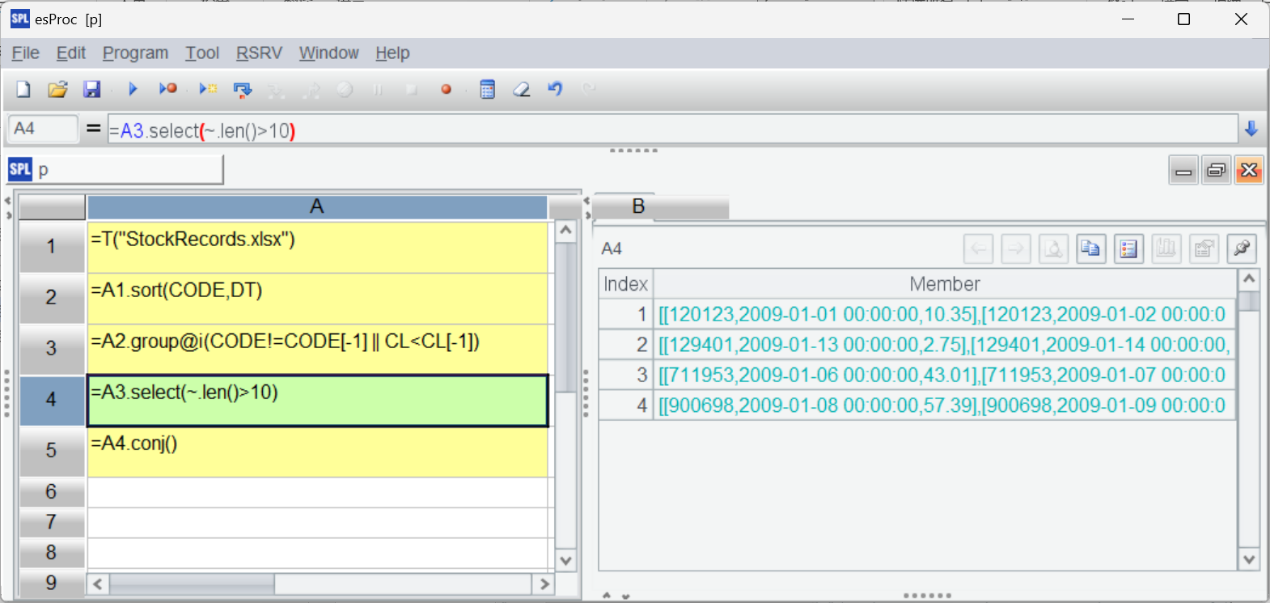
If the expected result set is too large and we want to change the filtering condition, like finding intervals when stocks rise consecutively for over 10 days, we just need to change 5 to 10 in A4’s filtering condition. Then click "Calculate Active Cell":
If the other requirements arise, we can continue to adjust the code according to the procedure of "observe – adjust – check" to complete the analytic task.
The above computing process shows that, as a programming language, SPL has equally high interactivity as Excel. The code written during data exploration and analysis is kept in the grid, and can be re-executed if necessary (when data source is changed, for example).
As a programming language, SPL offers loop statements and branching statements that all the other programming languages have, and a rich collection of computing class libraries and data objects. In the above example of getting consecutively rising intervals, SPL uses order-based operation and set-related operation. Supported by powerful computing abilities, SPL can easily complete various complex data analysis tasks.
Both SQL and Python do not have powerful expressive ability. It is difficult for them to write the logic of getting consecutively rising intervals. For the convenience of comparison, we simplify the computing task as getting the count of the longest consecutively rising days for each stock.
SQL:
SELECT CODE, MAX(con_rise) AS longest_up_days
FROM (
    SELECT CODE, COUNT(*) AS con_rise
    FROM (
        SELECT CODE, DT,
            SUM(updown_flag) OVER (PARTITION BY CODE ORDER BY CODE, DT) AS no_up_days
        FROM (
            SELECT CODE, DT,
                CASE WHEN CL > LAG(CL) OVER (PARTITION BY CODE ORDER BY CODE, DT)  THEN 0
                ELSE 1 END AS updown_flag
            FROM stock
        )
    )
    GROUP BY CODE, no_up_days
)
GROUP BY CODE
The code is deeply nested. It is hard to understand, and even professional programmers are probably unable to work it out.
Python:
import pandas as pd
stock_file = "StockRecords.txt"
stock_info = pd.read_csv(stock_file,sep="\t")
stock_info.sort_values(by=['CODE','DT'],inplace=True)
stock_group = stock_info.groupby(by='CODE')
stock_info['label'] = stock_info.groupby('CODE')['CL'].diff().fillna(0).le(0).astype(int).cumsum()
max_increase_days = {}
for code, group in stock_info.groupby('CODE'):
    max_increase_days[code] = group.groupby('label').size().max() – 1
max_rise_df = pd.DataFrame(list(max_increase_days.items()), columns=['CODE', 'max_increase_days'])
Python produces a bit simpler code, but it hardcodes the loop. Still, Python code isn’t simple at all.
Equipped with powerful order-based and set-related operations, SPL achieves the task using only 3 lines of code:
| A | |
|---|---|
| 1 | StockRecords.xlsx |
| 2 | =T(A1).sort(DT) |
| 3 | =A2.group(CODE; |
Actually, it is not difficult to handle this computing task with Excel. First, sort records by stock code and date; second, write a formula to get the number of consecutively rising dates; third, group records and find the largest number of consecutively rising dates for each group; lastly, collapse the display of data. Four steps are enough to finish the task.
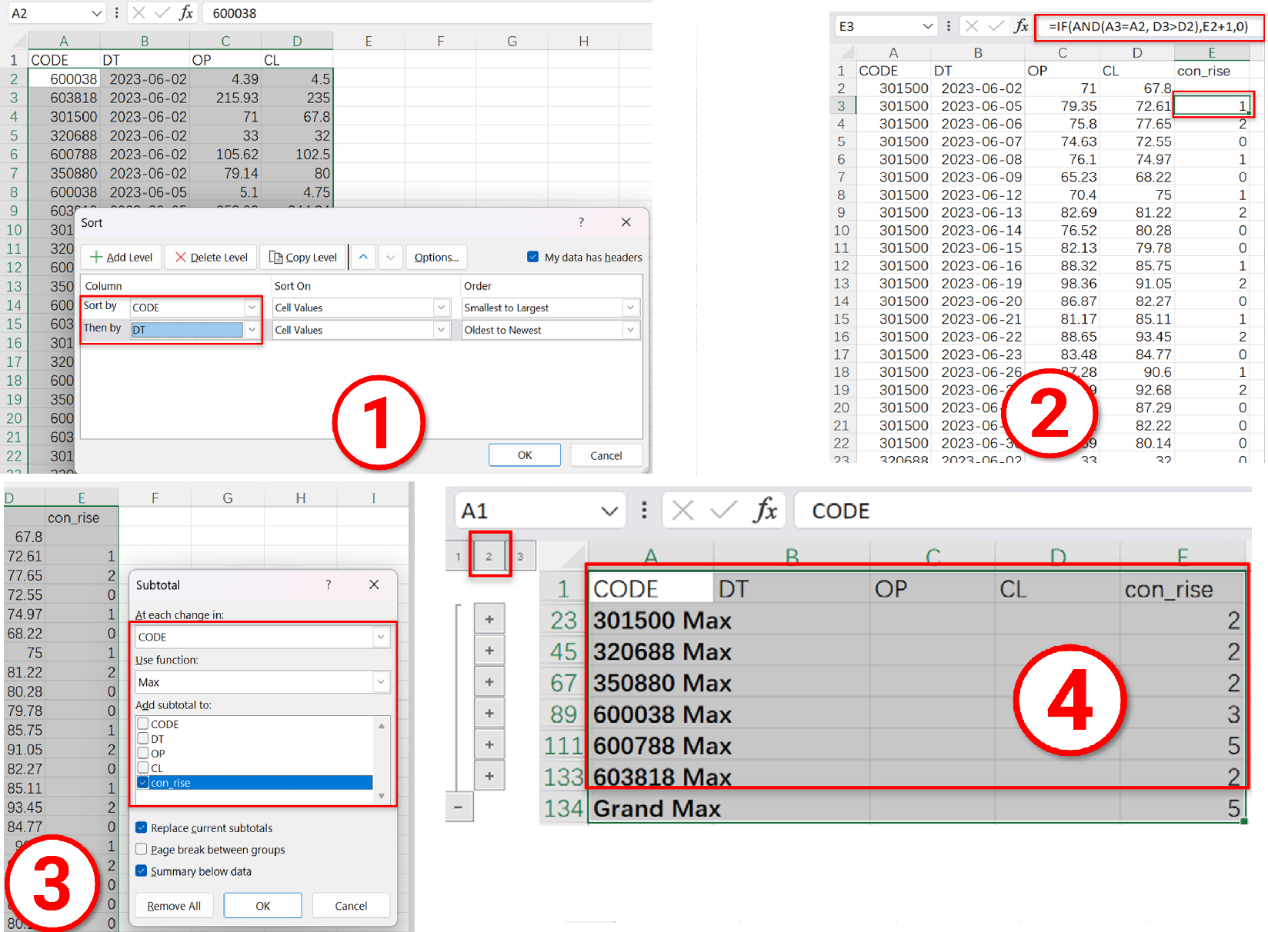
According to this example, both SQL and Python are even not as convenient as Excel in handling many analytic tasks.
In a nutshell, SPL amounts to the Excel equipped with programming ability. It combines data analysis advantages of Excel and programming languages, backing data analysts with high interactivity and powerful programming ability.
SPL Resource: SPL Official Website | SPL Blog | Download esProc SPL | SPL Source Code
