-
Notifications
You must be signed in to change notification settings - Fork 71
Processing Data Example
WILL UPDATE AS SOON AS POSSIBLE BUT PLEASE SEE Analyzing Data in Three Easy Steps
- Obtain a sample disk image
- Use CDQR to process the disk image (multiple options)
- View data in the built in Kibana Dashboards
- View data in TimeSketch
This is an example that requires a good amount of time to process an entire disk image. It was chosen, over a CyLR Live Response (LR) collection, to provide the most amount of data to the user in Kibana and TimeSketch.
It is not meant to be a speed test or an accurate reflection of how long it takes to process a CyLR LR. To do that it is recommended to collect data with CyLR, transfer to the Skadi system, and process with CDQR using these commands as a guide.
This example shows screenshots from a VM with 4 cores and 8 GB of RAM. Even though more cores and memory are better, the minimum requirements of 4 cores and 8 GB of RAM works fine.
Warning: If there are too many CPU cores to the amount of available memory then the system will slow down significantly and/or crash
This is a great way to see sample data with known attributes. I recommend comparing what can be seen in Kibana vs. TimeSketch
This example uses https://www.cfreds.nist.gov/ sample data sets; specifically the Data Leakage Case. It is possible to use the DD or E01 images but for this example the E01 version is used.
On the Skadi Desktop open a terminal window (alternatively open a ssh shell to the Skadi Server)
Once the terminal window is open run the following commands
mkdir /home/skadi/samples
cd /home/skadi/samples
If processing from scratch then download the E01 file with the following commands (~7.3GB download)
Pro-tip: Use the up arrow to show the last wget command and change the number of the E01 to E02 (and so forth)
wget https://www.cfreds.nist.gov/data_leakage_case/images/pc/cfreds_2015_data_leakage_pc.E01
wget https://www.cfreds.nist.gov/data_leakage_case/images/pc/cfreds_2015_data_leakage_pc.E02
wget https://www.cfreds.nist.gov/data_leakage_case/images/pc/cfreds_2015_data_leakage_pc.E03
wget https://www.cfreds.nist.gov/data_leakage_case/images/pc/cfreds_2015_data_leakage_pc.E04
The --plaso_db flag tells CDQR that the artifacts were processed and to read the data from the cfreds_2015_data_leakage_pc.plaso file.
In order to speed things up, CDQR on Skadi was used to create a cfreds_2015_data_leakage_pc.plaso (~3GB download) file that works with Plaso version 20180127
and can be downloaded from here: cfreds_2015_data_leakage_pc.plaso.
Use a browser to download file from inside Skadi Desktop and save to /home/skadi/samples/Results/cfreds_2015_data_leakage_pc.plaso.
If using Skadi Server download externally and upload using scp to /home/skadi/samples/Results/cfreds_2015_data_leakage_pc.plaso
To monitor the the progress open another terminal window. Alternatively screen is installed in Skadi (both versions) to run the processing in one screen while monitoring progress in another.
The command to run to start monitoring is:
htop
To quit press F10, left click on the Quit, or press CTRL+C
This command parses all the data files (it knows to process the other files in that image based on the E01 format) with the CDQR Windows options for Plaso parsers. This is the default option with CDQR but there are datt, lin, mac options as well. These can be chosen using the -p flag for CDQR.
Note: DATT is short for Do All The Things and will use every parser Plaso has. This is the most thorough option but can dramatically slow down processing times
The --max_cpu flag lets CDQR use all the cores available. Otherwise is uses three less than the total number of CPU cores available and defaults to 1 if there is less than 4 total.
The -p datt flag tells CDQR to use all the parsers it knows about. This is significantly slower than the other parsing options but yields the most amount of data.
The --es_kb flag tells CDQR to output to ElasticSearch (es) in the Kibana (kb) format. This requires a case name and is cfreds_sample_datt for this example.
cd /home/skadi/samples
cdqr.py -p datt --max_cpu cfreds_2015_data_leakage_pc.E01 --es_kb cfreds_sample_datt
cd /home/skadi/samples
cdqr.py --plaso_db Results/cfreds_2015_data_leakage_pc.E01.plaso Results_kb --es_kb cfreds_sample_datt
The --es_ts flag tells CDQR to output to ElasticSearch (es) in the TimeSketch (kb) format. This requires a case name and is cfreds_sample_datt for this example. Using CDQR to input the data allows both formats to co-exist in the same ElasticSearch database without overlapping.
The Results_ts was added to provide an alternative destination for the results. By default CDQR places the results in a folder named Results in the directory it was called from. If there is an overlap CDQR prompts for which actions the user wants to take (follow the prompts).
cdqr.py --plaso_db ~/samples/Results/cfreds_2015_data_leakage_pc.E01.plaso Results_ts --es_ts cfreds_sample_datt
What it looks like while running
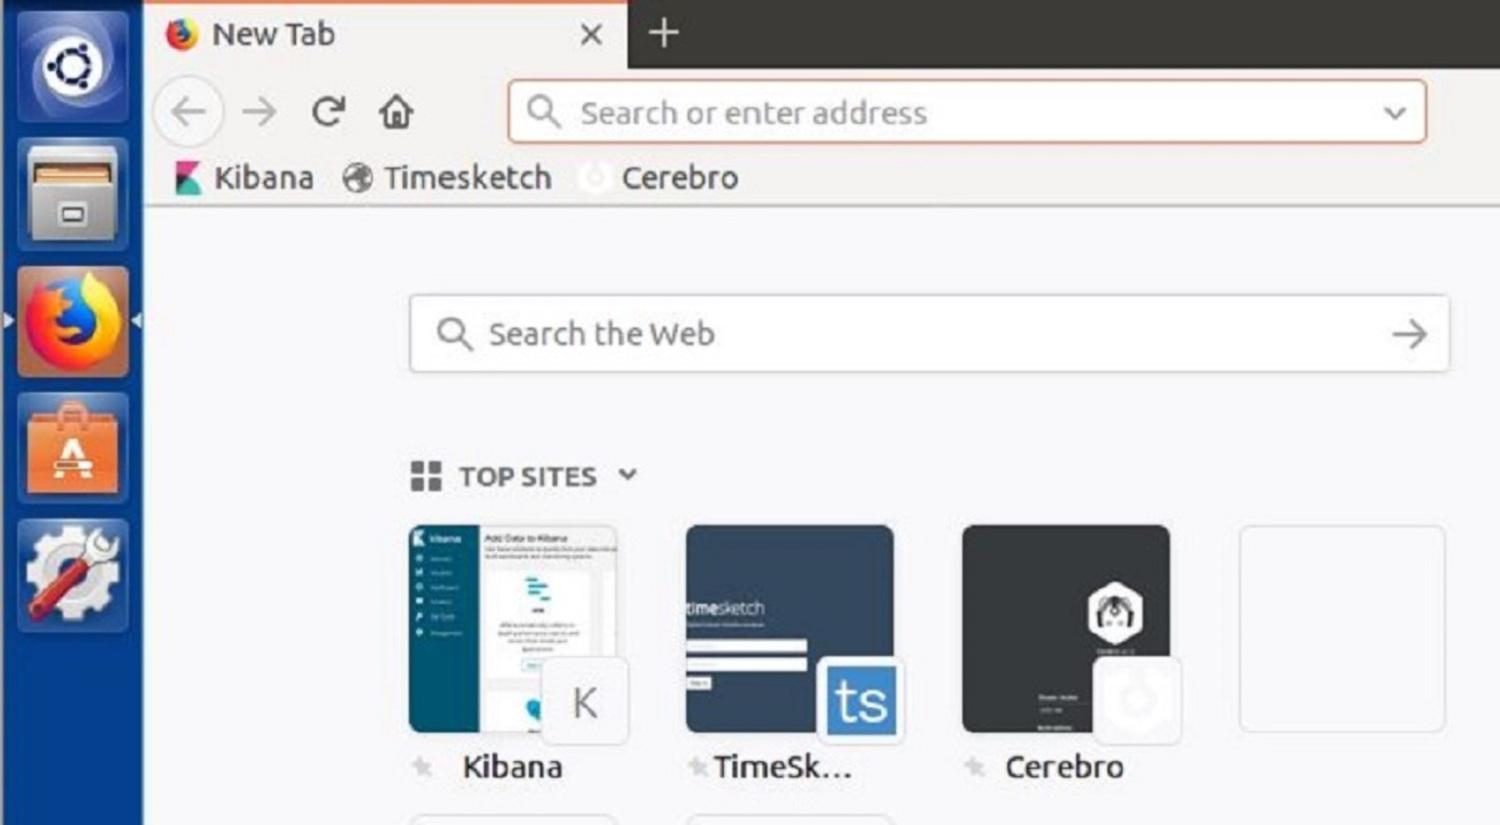
Open Firefox and click on the Kibana Shortcut
Open a browser on the host machine and navigate to: http://<Skadi Server IP Address>:5601
In this example the Skadi IP address is: 10.1.0.44 so enter http://10.1.0.44:5601 in the browser bar
Finding the Skadi IP Address
Then open up the Kibana Dashboard page, click on one, and set the time to "500 years ago".
Explore the multiple dashboards and what they have to offer
Open Firefox and click on the TimeSketch Shortcut
Open a browser on the host machine and navigate to: http://<Skadi Server IP Address>:5000
In this example the Skadi IP address is: 10.1.0.44 so enter http://10.1.0.44:5000 in the browser bar
Finding the Skadi IP Address
First log into TimeSketch (username skadi, password skadi)
Click Create TimeSketch
Click or add an existing timeline
Check the box for cfreds_sample_datt (note this is the case name used in the CDQR command)
Click Explore to start searching through data


