-
Notifications
You must be signed in to change notification settings - Fork 14
NewIn32
Allow a timegraph to not be time aligned with the main trace and also to pin it to another trace allowing visual timegraph comparison.
The
- Cpu Usage View
- New Histogram View
- UST Memory Usage View
- Kernel Memory Usage View
- XML XY View
- Disk IO Analysis View
now all have a checkbox tree viewer to select which series to display.
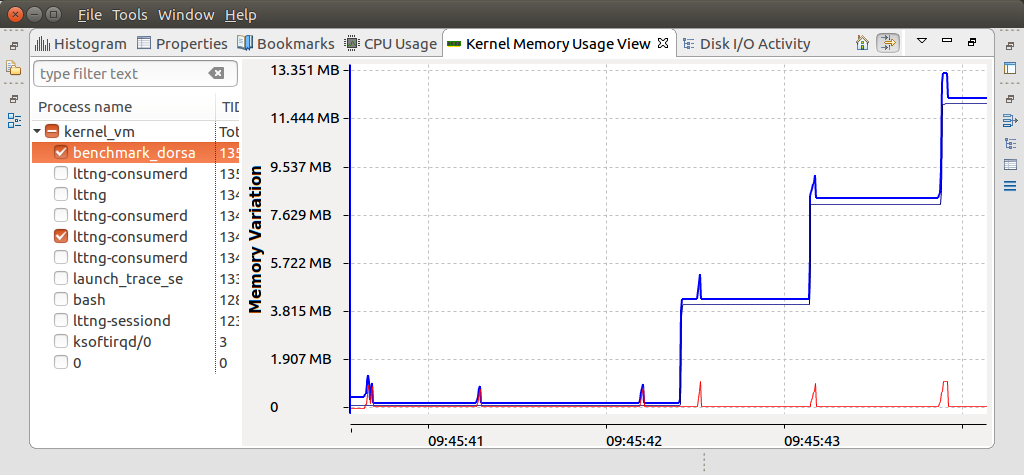
This allows many more series to co-exist while minimizing consumed screen real-estate
Charts now support data from multiple sources at once.
The tree will update while the analysis is running.
The tree entries' path can be searched with regular expressions.
The tooltips now look more the timegraph tooltips.
The Time Axis now looks and behaves like the Time Graph Views' time axis, it can be double-clicked to reset the time range. The home button can also be double clicked to reset the time range.
It is now possible to toggle the filtering of active threads in the UST and Kernel memory views. By default, only the threads which have activity over the visible range are visible in the tree, disabling the filtering shows all threads which have information in the traces.
It is possible to configure an existing project, for example, C/C++ or Java project, as a Tracing project. All Trace Compass related features will be available within the same project. To configure a project as Tracing project, right-mouse click on the project in the Project Explorer and select menu item Configure > Configure or convert to Tracing Project.
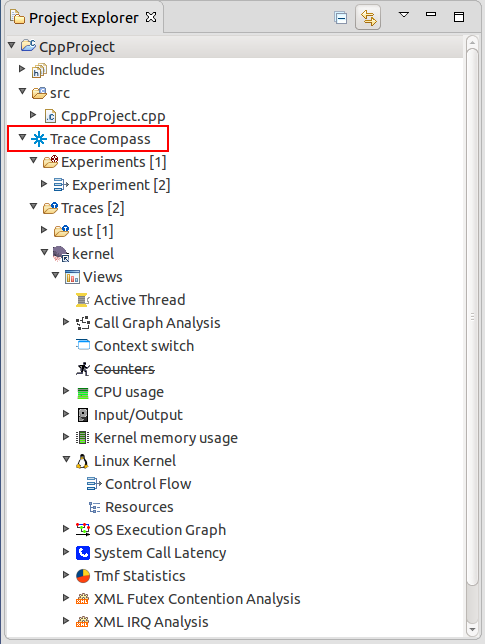
The virtual machine analysis development has moved to the Trace Compass Incubator project, where it is being actively developed. The functionality in Trace Compass has thus been marked as deprecated, inviting the user to get the feature from the Incubator. The Incubator's update site can be found http://download.eclipse.org/tracecompass.incubator/master/repository/.
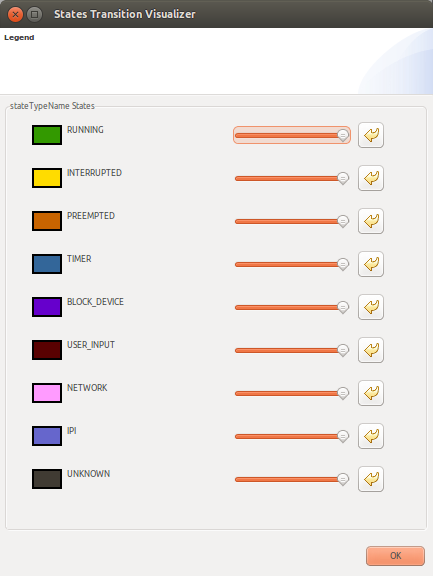
Users can select the colour and width of the events in the time graph (Gantt) charts.
A typical scenario is to have a program either squash or archive its log or trace. This saves a few clicks while cleaning the tree.
Make it easier to extend. Examples are support for :
- Userspace locks
- Perf Kernel traces
Make it faster and easier to rename traces.

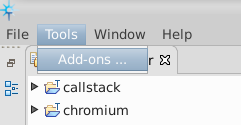
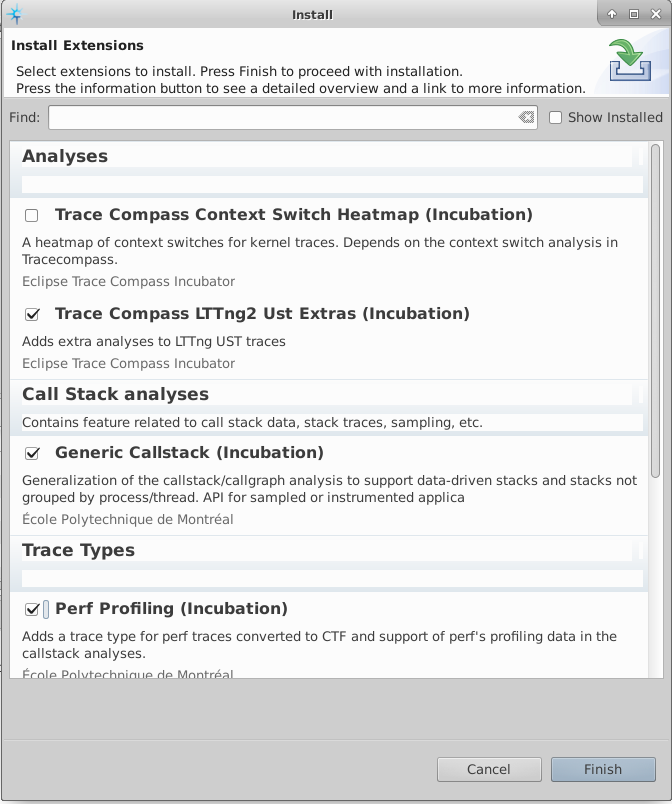
The Trace Compass Incubator contains additional features, for example, additional trace types, extra analyses for specific use cases or experimental features under development. Those features are now 2 clicks away, using the "Tools" -> "Add-ons..." menu.
XML analyses can now define state values as a result of javascript code. The code to execute is written in the value attribute of the state value and the type is script. Variables names in the script can be replaced by a value with id of the same name defined under the script tag.
The code below shows an example of a state change assigning a value as a result of a script:
<stateChange>
`   `<stateAttribute type="constant" value="script" />
`   `<stateValue type="script" value="op == 'op1' ? 'FALSE' : 'TRUE'" scriptEngine="nashorn" >
`       `<stateValue id="op" type="eventField" value="op" />
`   `</stateValue>
</stateChange>See Bugzilla report Bugs Fixed in Trace Compass 3.2.0