-
Notifications
You must be signed in to change notification settings - Fork 14
NewIn21
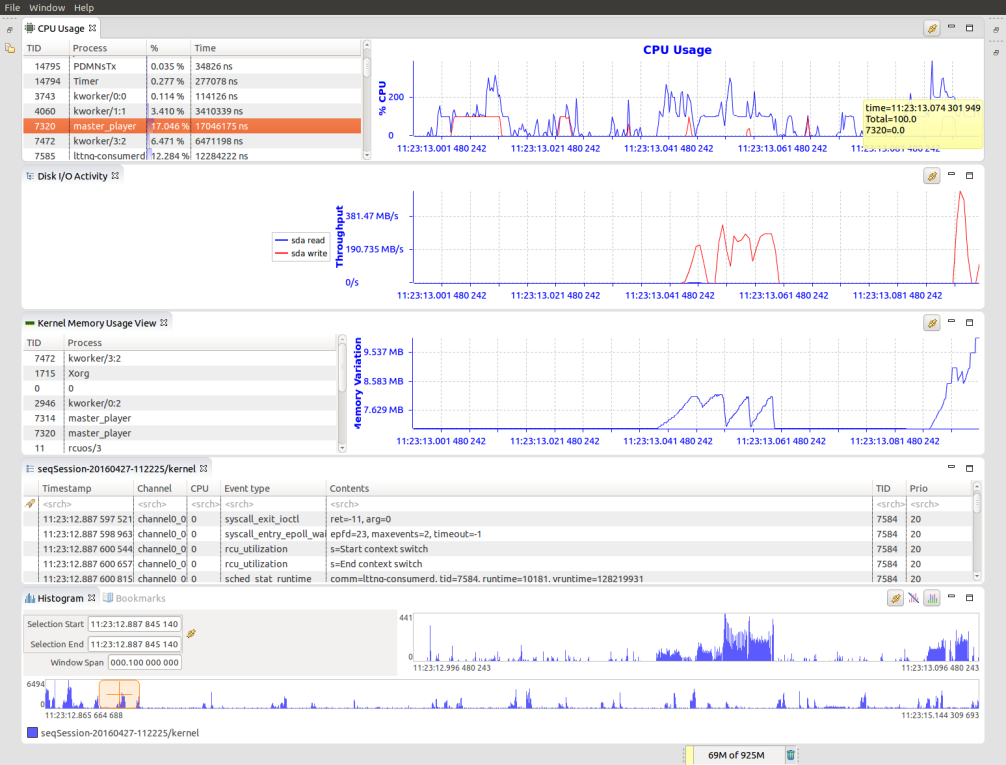
A new perspective with a set of predefined views is available showing CPU Usage, Disk I/O Activity and Kernel Memory Usage populated with from LTTng Kernel traces.
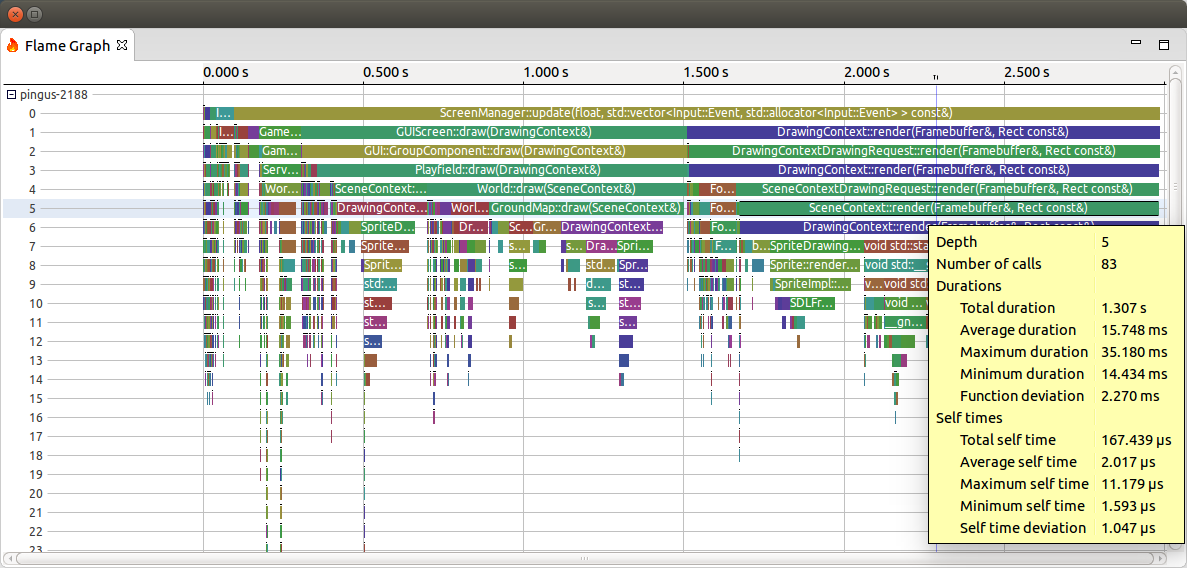
A new analysis has been added to analyze the call stack data provided by a call stack analysis (e.g. LTTng UST call stack analysis based on gcc's finstrument-functions). For that 2 new views are available to provide information on the performance of the traced application: Flame Graph view and Function Duration Density view.
Note: The current implementation is limited by the available RAM. Future improvements will be done to overcome this limitation.
The Flame Graph view visualizes the aggregation of each function call duration per stack depth and per caller. The x-axis represents the function call duration. They are ordered by duration from left to right and it's easy to spot the function with longest duration and the code path that is used the most. The y-axis shows the call stack depth ordered from root at the top to leaf at the bottom. Multiple threads are grouped together in its own Flame Graph.
The Function Duration Density view shows the distribution of function call durations for the current active window range.

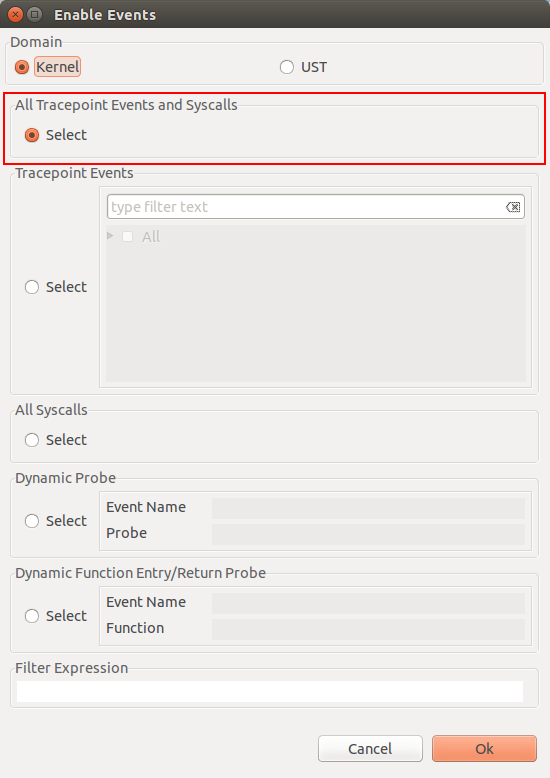
It is now possible to enable all LTTng kernel tracepoints and syscall at the same time.
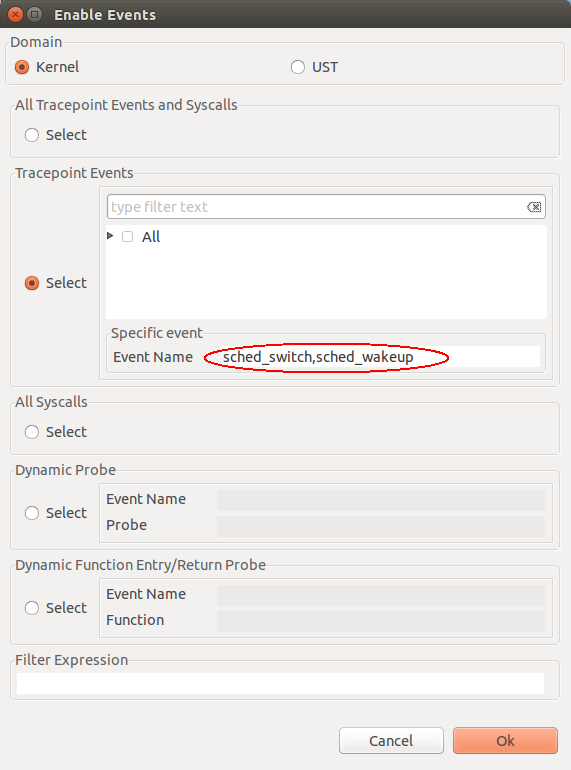
It is now possible to enable LTTng Kernel events by specifying one or more names. This is useful when tracing Kernel modules that are loaded manually.
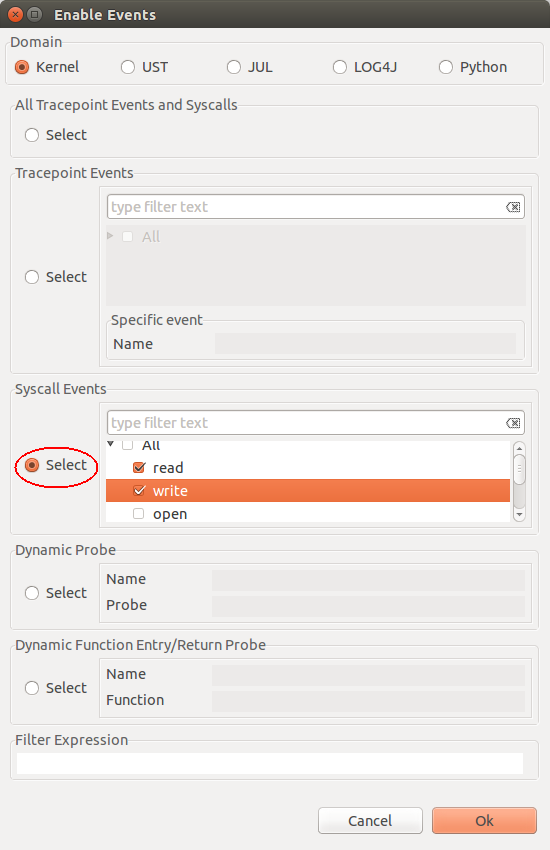
It is now possible to specify which LTTng Kernel syscall(s) to enable when enabling syscall events. Previously, only enabling all syscalls was supported.
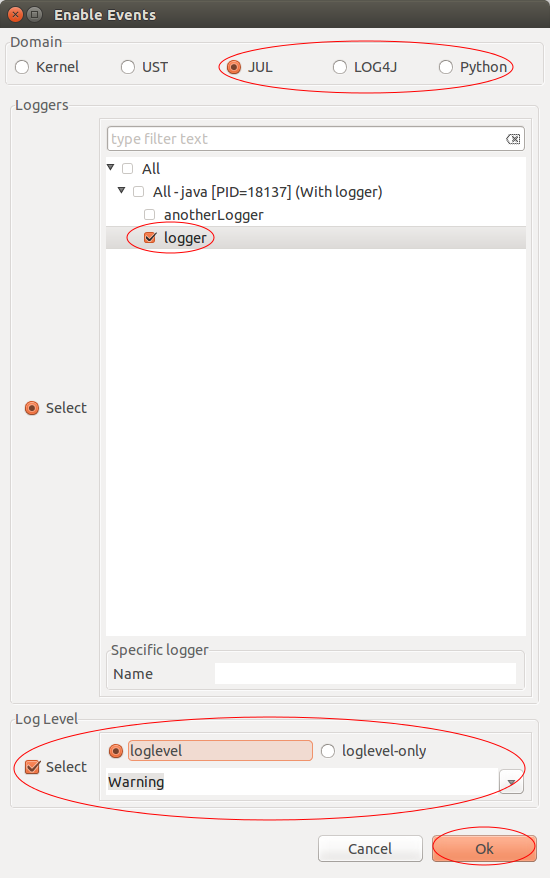
It is now possible to create tracing sessions to trace Java and Python applications. For java, the loggers can be either JUL (java.util.logging) or LOG4J (org.apache.log4). User can enable specific loggers with or without specifying the loglevels to apply.
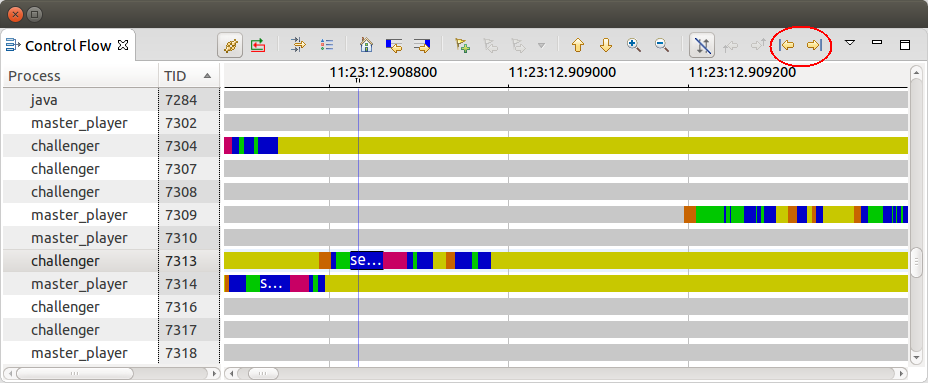
Two navigation buttons have been added to the toolbar of the Control Flow view to follow events for the selected thread. With this is possible to go to the next or previous event from the current time for the selected thread.
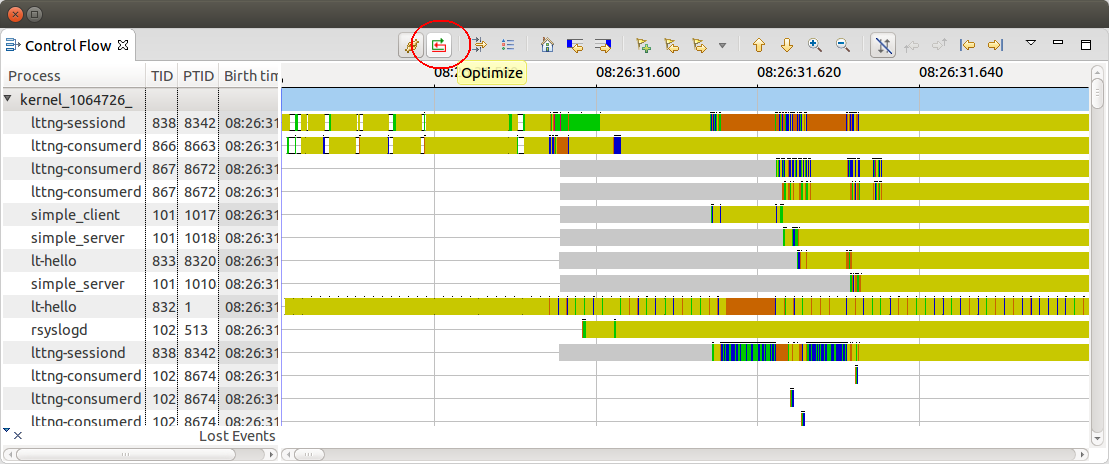
Support for automatic threads grouping by activity using a graph placement algorithm has been added to the LTTng Control Flow view.
It is now possible to assign an event type in custom text and XML parser wizard.

The event type will be displayed in Event type column. Data-driven analysis can take advantage of the event type definition.

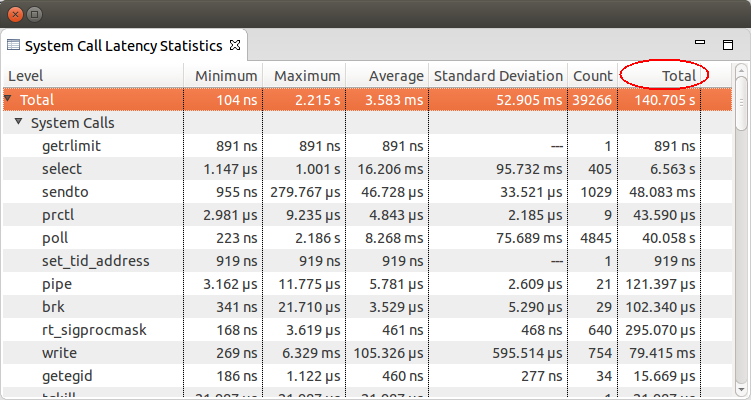
The Latency statistics view now will display the sum of a latencies per type in the Totals column. This is applicable to the Latency statistics view created by the data-driven pattern analysis or in Java like the System Call analysis.
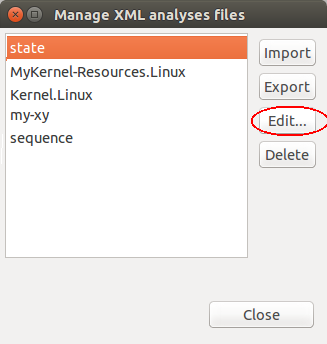
It is now possible to edit data-driven analyses directly within Trace Compass using the "Edit..." of the XML analysis manager.
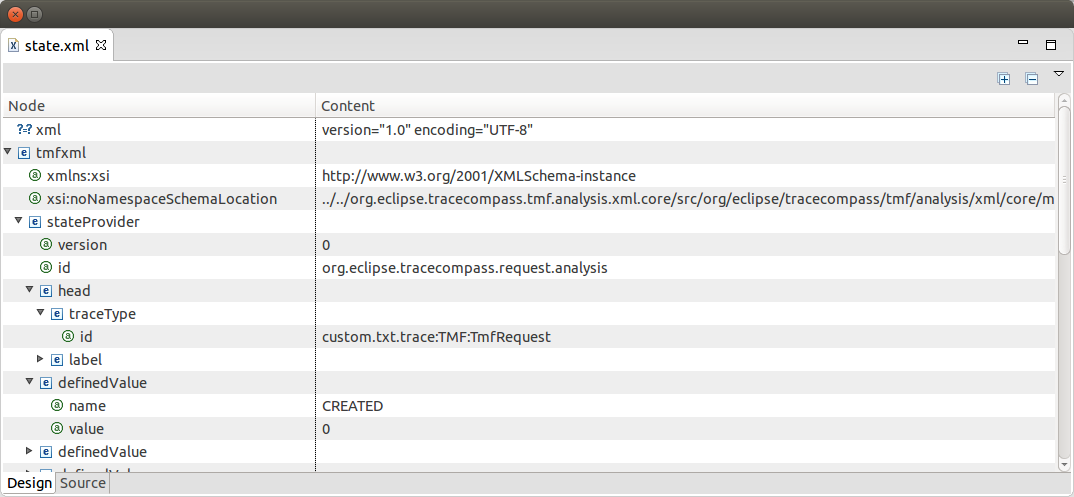
This will open a XML editor provided by the Eclipse WST project.
It is now possible to have multiple XML view instances of same type (Time chart or XY chart) open at the same time.
The XSD definition for data-driven state provider and data-driven pattern detection have been augmented in this release.
The progressing of the trace indexing of CTF traces will be shown in the Progress view as well as the status bar of Trace Compass.

The integration with LTTng-Analyses was updated to support the latest 0.5 stable branch, as well as the project's master branch. This now follows the more standardized LAMI specification, so future protocol changes should be easier too. The 0.4 branch is still supported, but users are advised to update to the latest version.
Trace Compass now contains some Java Utility Logging (JUL) tracepoints in various places in the code. To diagnose issues with Trace Compass or when reporting problems with the application, a JUL trace may be useful to help pinpoint the problem. See this section of the documentation, as well as this blog post for more information.
See Bugzilla report Bugs Fixed in Trace Compass 2.1.0