-
Notifications
You must be signed in to change notification settings - Fork 4
Point by Point Exporting
Once you've decided upon your ideal graph with all the filters you'd like, you can then export that graph as an image or a PDF.
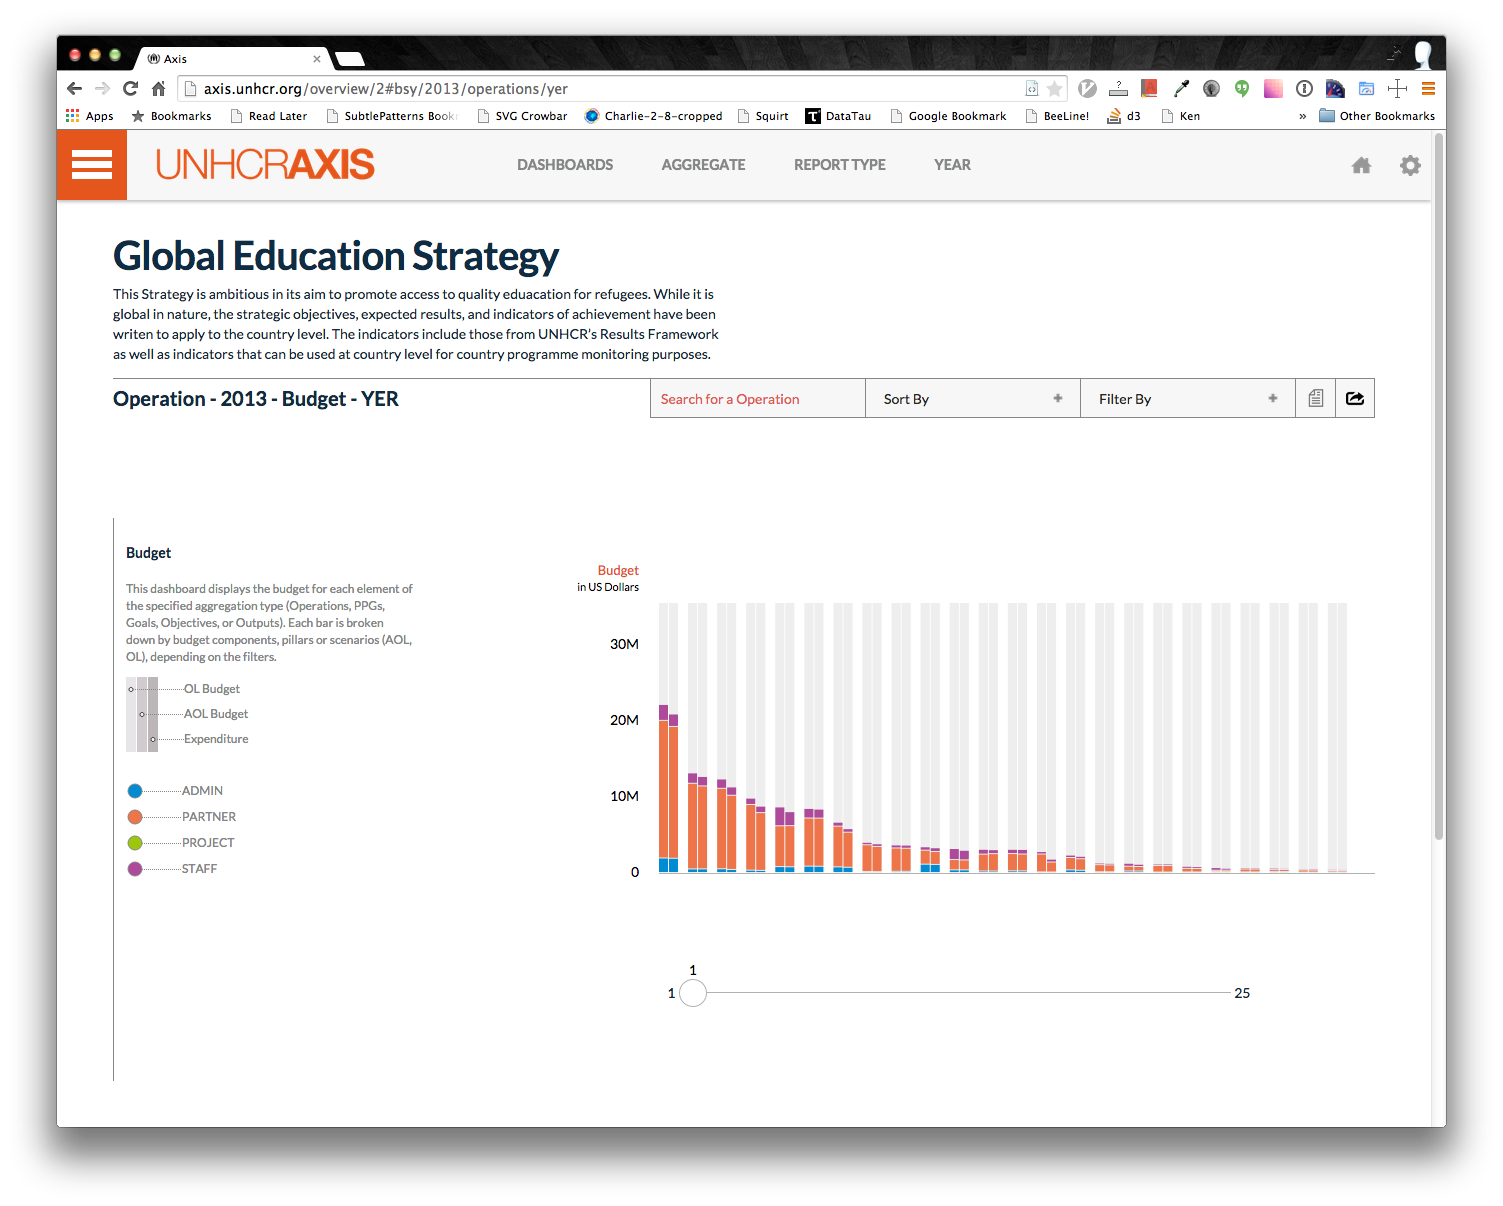
First let's take a look at the Budget dashboard and export that one. Below you can see an image of a customized Budget graph that I'm ready to export:

Now click the export button:

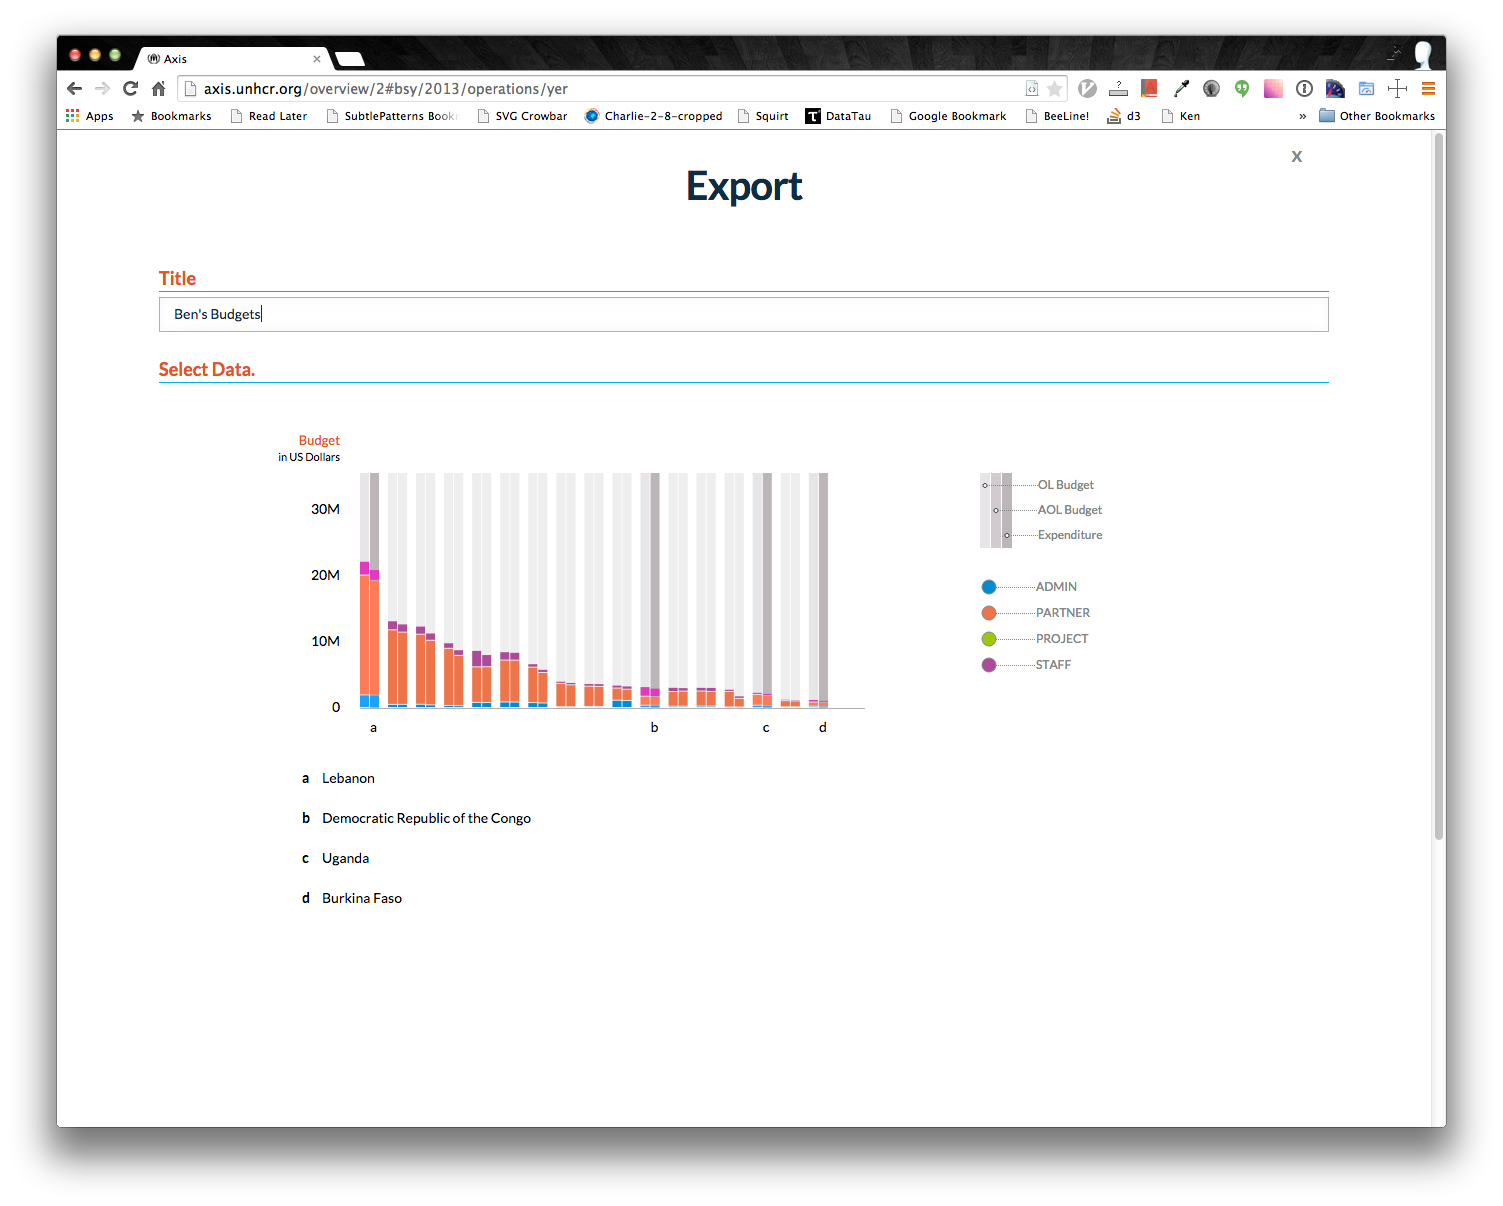
You should now see a page that will help you export your graph. The first order is to name your visualization. I will call mine "Ben's Budgets." Then you will see a preview of your visualization below. To add labels for the different bars, simply click on a bar. There is a slider at the bottom of the page just like in the dashboard so you can select bars that are off the screen. Here's an example of what it could look like after making your selections:

Lastly you will need to choose whether you would like to export the dashboard as a PDF or an image. The PDF will be emailed to you, while the image will be directly downloaded to your computer. The image makes it easier for you to embed into any report you are creating. Go ahead and pick one and see your dashboard exported! Here's the resulting image:

Next: [Building a strategy](Point by Point Building a Strategy)
Previous: [Advanced Filtering](Point by Point Advanced Filtering)