Continuous Integration / Code Examples / Shiny Apps / Flask Apps / Software / Presentations / Workshops / Visualizations
This repository contains (links to) code and/or data products, as well as presentations I've developed and created in recent years.
The "weekly oil bulletin"-database holds fule prices for European countries. It is generated through a CI-runner that executes code every week to generate download links from scraped meta data. The database is updated and relevant logs written to file for easy curation and error handling.
links: GitHub repository (weekly_oil_bulletin)

This code snippet, as part of a automated, report-generation workflow, uses git2r to push results (parameterized reports) from a hosted instance of R on TravisCI back to a GitHub repository with encrypted authentification tokens.
links: GitHub repository (task automation) (see this presentation for more)
- Processing, modelling and visualizing hydrological data in R:
This interactive document is an example of a reproducible analyses inR, using web APIs to obtain data, reading in non-standard tables with custom functions, reshaping and applying statistical models to infer best predictors of extreme river flows across catchments in the UK. The analyses relies heavily on thetidyverse, especiallypurrrfor mapping custom (nested) functions to list-columns.
links: Document // Rmarkdown (raw) -
uk_nest <- models %>%

  # use custom function and add id column
  map_df(apply_model, uk_nested, .id = "id_model") %>%

  # carry over pertinent columns
  select(id_model, country, model) %>%

  # add model coefficients and performance metrics to data frame.
  mutate(coefficients = map(model, tidy),
         performance = map(model, glance)) %>%
  select(-model)

# see results
uk_nest %>% head(20)

- World Bank Population Data analyses
The brief analyses featured in an elaborate blog post for my personal website on reproducibility approaches. In this case, the structure and methods forRpackage development were applied to allow attaching custom functions and data with documentation to anybody looking to explore or reproduce the analyses (or entire blog post). It heavily relies onusethis, thetidyverseas well asrlangnon-standard evaluation to facilitate use with piping anddplyr. The source for the functionwb_change_percentused below, including documentation, can be found here.
#load custom library containing research compendium
library(WBanalyses)
library(dplyr)
library(ggplot2)

# calculate pop change for last 10 years in data set.
max_year <- max(pop_data$year)
start_year <- max_year - 10


# ?wb_change_percent for the documentation

# add "region" in ... before country_name to keep column in analyses
pop_change <- pop_data %>%
    WBanalyses::wb_change_percent(start_year = start_year,
                                  end_year = max_year,
                                  value_col = population,
                                  year_col = year,
                                  outname = "population_perc_change",
                                  region,
                                  country_name)

- Birmingham Institute of Forest Research (BIFoR) Data Expliration Platform:
link: https://aglhurley.shinyapps.io/bifor/
This in-devolopmentshinyapp is being built for the institute's staff as an exploration and data download portal, as well as for outreach and educational purposes. It was demonstrated at an outreach and education exchange workshop with members from UK higher education institutions. Ultimately, this app will feature live data, once the necessary infrastructure has been installed on-site.

- NexTrip ✈ Travel Destination Recommender:
link: http://aglhurley.pythonanywhere.com/ Mock-project showcasing devlopment of back-end, front-end and machine learning approaches inpythonusingflask,scikit-learnand data visualization throughplotlyandmatplotlib.
- remis:
Rpackage for Interacting with the UNFCCC Data Interface API. The package allows querying and searching meta-data to post requests for all greenhouse-gas emissions data reported by ANNEX-I and Non-Annex-I countries to the UNFCCC.
links: GitHub // package site
- datacleanr:
Rpackage for Interactive and Reproducible Data Cleaning. datacleanr is developed using the shiny package, and relies on informative summaries, visual cues and interactive data selection and annotation. All data-altering operations are documented, and converted to valid R code (reproducible recipe), that can be copied, sent to an active RStudio script, or saved to disk. links: GitHub // package site

- lib2bib:
Rpackage to acknowledge otherRpackages. It allows to search for and cite all packages used in a file, directory orRStudioproject via calls tolibrary(),require()or using the::operator notation. It includes a shiny interface to select specific packages and save them to a text or.bibfile. Future improvements will include the ability to supply a bibliography style file, and copying the output to the clipboard.
links: GitHub // package site

- ROAR:
Rpackage for Reproducible and Organized Assimilation Routines (in development).ROARassists in assimilating heterogeneous data sources into a pre-defined format, using templated scripts. These scripts are pre-populated through a "meta table" that contains information on every data set (origin, time zone, units, table format, etc.). links: GitHub
-
TREX:
Assimilate, process and analyse thermal dissipation sap flow dataR.TREXallows to assimilate, process and analyse sap flow data obtained with the thermal dissipation method (TDM). The package includes functions for gap filling time-series data, detecting outliers, calculating data-processing uncertainties and generating uniform data output and visualisation. The package is designed to deal with large quantities of data and apply commonly used data-processing methods. links: GitHub // CRAN // accompanying publication (Methods in Ecology and Evolution) -
RAPTOR:
Row and Position Tracheid Organizer inR.Rpackage for wood anatomical analyses, allowing to pre-process, filter and extract cell properties from wood thinsections, significantly simplifying the process of extracting information for further processing. My role in this package was to refactor and re-structure code to ensure compliance with CRAN requirements and best-practices.
links: GitHub // CRAN // accompanying publication (Dendrochronologia)
-
Introduction to R - project set-up, data management and coding (2015). This presentation was delivered to the physical geography department during a dedicated seminar at University of Birmingham. The focus was set presenting approaches to ensure projects were set up in a coherent, machine-readable and reproducible manner.
links: slides (PDF) -
Intro to project management with git, GitHub and RStudio (2018).
This presentation was delivered to the water science research group during a dedicated seminar at University of Birmingham and included best practices in version controlling, project set-up, reproducible workflows and live coding sessions.
links: slides (react.js) // Rmarkdown (raw) -
Processing, modelling and vizualising hydrological data in R (2018).
Delivered at the European Geophysical Union General Assembly, this presentation was directed at hydrologists interested in streamlining national-scale analyses with tiydverse methods.
links: document (html) // Rmarkdown (raw) // -
Staying up-to date: automating tasks from downloading data to reporting (2019).
Delivered at the European Geophysical Union General Assembly, this presentation was directed at geo-scientists looking to automate data aquisition, reporting and visualization, relying onRmarkdown,GitHubandTravisCI.
links: slides (react.js) // Rmarkdown (raw) -
Obtaining, cleaning and visualizing hydrological data with R (2019).
Delivered at the European Geophysical Union General Assembly, this presentation showcased a suite of open-source software (Rpackages) that can facilitate typical workflows while enhancing reproducibility, including downloading, processing and visualizing results.
links: slides (react.js) // Rmarkdown (raw)

Using R in Hydrology ![]()
This short course, delivered at the European Geophysical Union General Assembly, has been run in association with the Young Hydrologic Society since 2017.
I've contributed in 2018 and took over convener's duties in 2019, organizing speakers, materials (syllabus and archiving); I also developed a consistent theme and logo based on xaringan and the common R hex-logo.
The strong community focus driving this workshop led to a collaborative effort in authoring a discussion paper, titled "Using R in hydrology: a review of recent developments and future directions" (Slater et al., 2019) in Hydrology and Earth System Sciences.
2018 Workshop: GitHub repository -
2019 Workshop: GitHub repository -
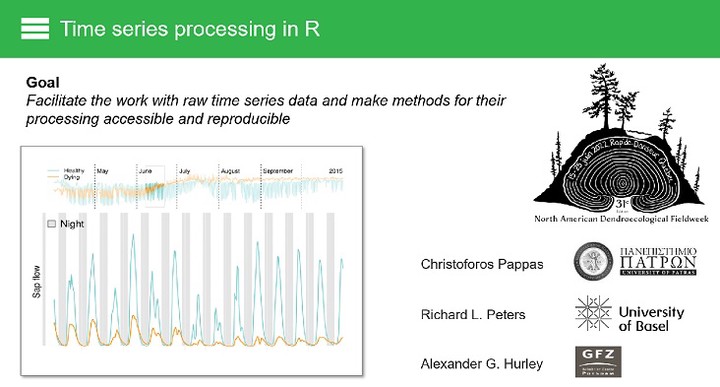
Workshops on tree physiology and time series analyses Within the context of the Dendro-ecology and Eco-physiology (DEEP)-Toolbox, I participated the devlopment and the delivery of several workshops starting in 2021. See the DEEP-Website for additional information.
2020 Workshop: Materials // GitHub repository


