-
Notifications
You must be signed in to change notification settings - Fork 182
New issue
Have a question about this project? Sign up for a free GitHub account to open an issue and contact its maintainers and the community.
By clicking “Sign up for GitHub”, you agree to our terms of service and privacy statement. We’ll occasionally send you account related emails.
Already on GitHub? Sign in to your account
Add initial experimental .NET CLR runtime metrics #1035
Add initial experimental .NET CLR runtime metrics #1035
Conversation
|
I'm not entirely sure why |
|
Have you run both |
I thought I had done so as the contents were updated, but I can try those again. I'm having to hack around the tooling a bit to get things running on Windows. |
|
@trisch-me I've updated the formatting per your suggestion and rerun both of those make targets. Neither made any changes to the markdown files. |
|
Alternatively you could wait until #1000 will be merged, it has fix for this bug |
|
@stevejgordon The #1000 is merged so please re-run code generation locally and update your files. Thanks |
c0742fb to
83fc98a
Compare
|
Thanks, @trisch-me. Looks good! |
There was a problem hiding this comment.
Choose a reason for hiding this comment
The reason will be displayed to describe this comment to others. Learn more.
Happy to see this 🎉
Left some comments below.
|
|
There was a problem hiding this comment.
Choose a reason for hiding this comment
The reason will be displayed to describe this comment to others. Learn more.
Thank you for working on this!
The main concerns from my side:
- it seems we're designing 'proper' CLR metrics based on the information we can get today, but native runtime instrumentation can do much better and provide:
- GC duration histogram
- lock contention duration
- ...
- I'm no expert in all of the runtime details, but I assume that some metrics are used much more that others (e.g. CPU, GC, heap size, thread pool) while things like JIT metrics could be more advanced and specialized. I wonder if it's possible to start with basic-perf analysis (e.g. CPU, memory/GC) and then move on to more specific metrics in a follow up PRs?
|
/easycla |
|
Looking at the discussions in this PR, I want to reiterate the proposal #1035 (review): Let's think about user experience - which metrics users want to see first - my assumption is CPU, memory (from all sources, ideally in one/few metrics, GC, maybe threads. Let try to come up with a few metrics that would not require users to have a deep prior expertise in .NET memory management or know subtle differences between different .NET flavors. If we need some advanced, precise things, they should come as an addition to basic CPU/mem/GC things. |
Are you suggesting lets review some things first and some things later? Or do you mean "Lets see if we can avoid including some of these metrics in .NET 9 at all?" If its just review ordering I'd say no problem. If the goal is to have these metrics not contain all the metrics in the current OTel .NET runtime instrumentation I think that leads to trouble. One of the major scenarios will be people migrating from using older metrics to these metrics and every metric we remove makes that migration harder or discourages them from migrating at all. If we want to have a simple set of metrics for folks just getting started I think a good approach to that will be docs or a pre-made dashboard, not by excluding metrics from the underlying instrumentation. EDIT: Just to add I know a few of the metrics may feel a bit advanced or niche, but they are there because customer feedback wanted them to be there. We took a bunch of things out during the move from Windows Performance Counters -> EventCounters, but customers gave us feedback that we had cut too deep and please restore some of the metrics that were important to them. |
Co-authored-by: Noah Falk <[email protected]>
Co-authored-by: Noah Falk <[email protected]>
Co-authored-by: Liudmila Molkova <[email protected]>
Co-authored-by: Noah Falk <[email protected]>
293a1f8 to
085e331
Compare
|
This PR was marked stale due to lack of activity. It will be closed in 7 days. |
Co-authored-by: Noah Falk <[email protected]>
|
I took a liberty to resolve last two discussions, took @noahfalk suggestion on one of them to match what's documented in runtime and regenerated tables. With this I believe this is ready to go. |
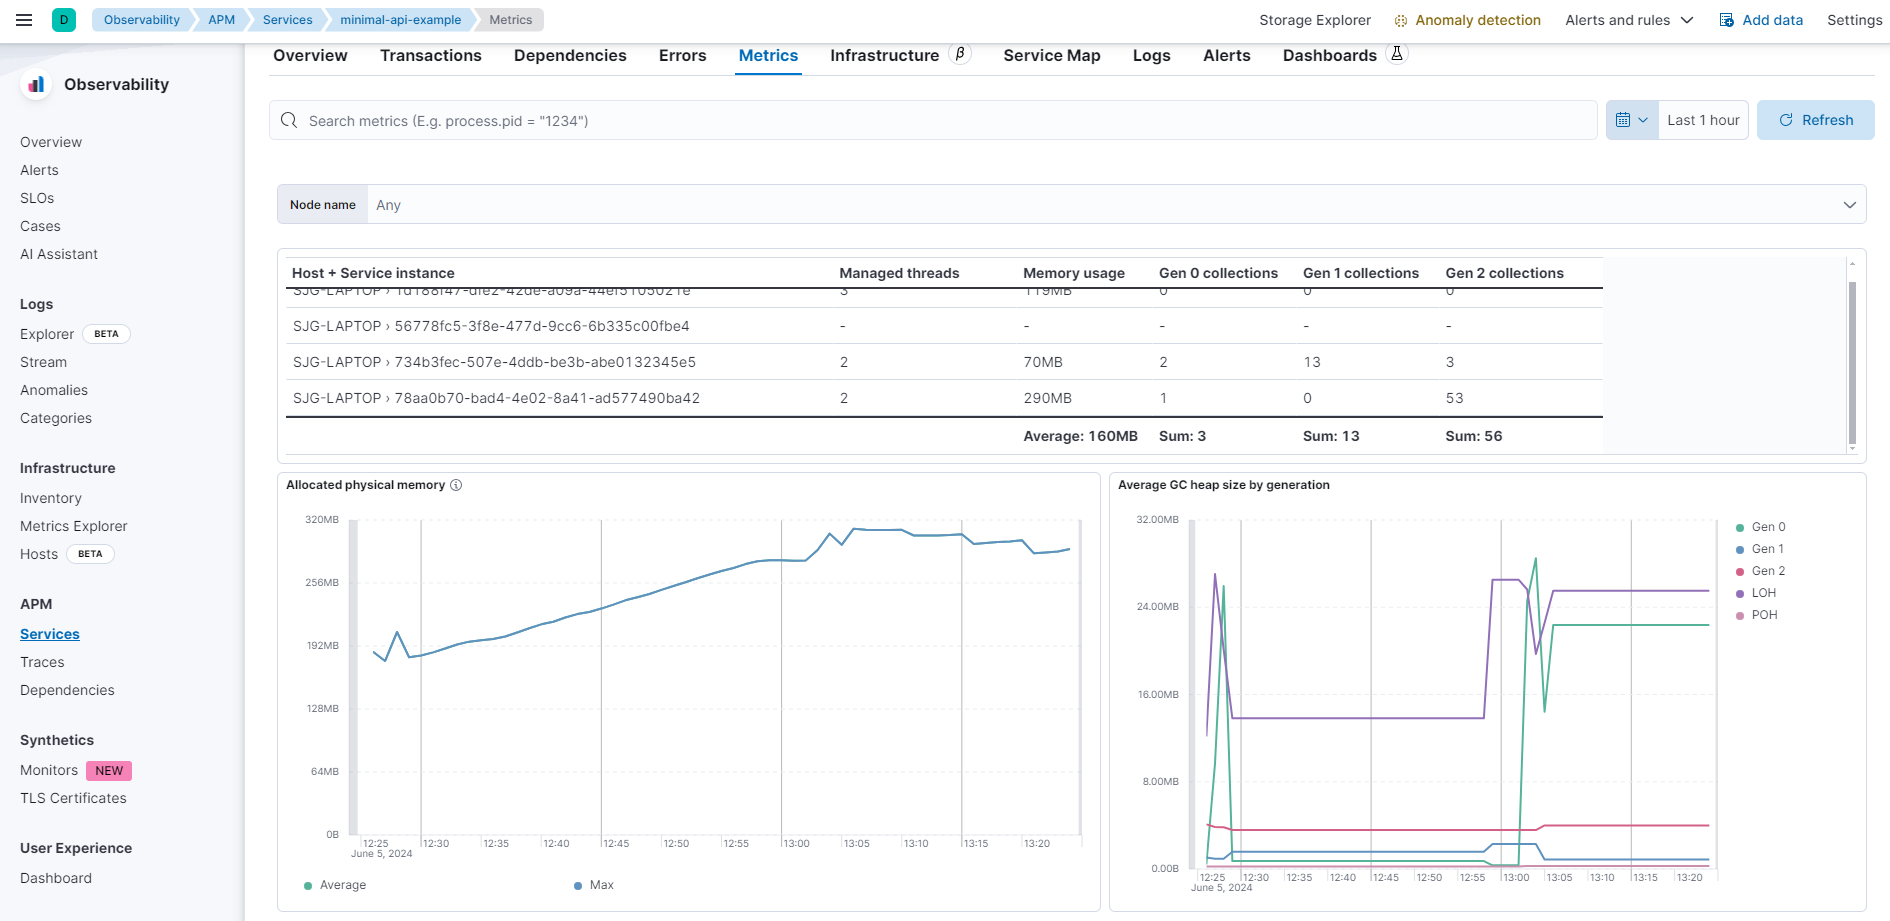
## Summary Create a dedicated "portable dashboard" for OTel .NET. This uses metrics available in the [contrib](https://github.com/open-telemetry/opentelemetry-dotnet-contrib) runtime metrics library. These metrics are opt-in and not enabled by default in the vanilla SDK. Our Elastic distro brings in the package and enables them by default. Therefore, the dashboard will only work if a) the customer uses our distro or b) they enable the metrics themselves when using the vanilla SDK. Further, work is ongoing to define [semantic conventions for .NET runtime metrics](open-telemetry/semantic-conventions#1035). Once complete, the metrics will be implemented directly in the .NET runtime BCL and be available with no additional dependencies. The goal is to achieve that by .NET 9, which is not guaranteed. At that point, the metric names will change to align with the semantic conventions. This is not ideal, but it is our only option if we want to provide some form of runtime dashboard with the current metrics and OTel distro. As with #182107, this dashboard uses a table for some of the data and this table doesn't seem to reflect the correct date filtering. Until there is a solution, this PR will remain in the draft, or we can consider dropping the table for the initial dashboard. 
## Summary Create a dedicated "portable dashboard" for OTel .NET. This uses metrics available in the [contrib](https://github.com/open-telemetry/opentelemetry-dotnet-contrib) runtime metrics library. These metrics are opt-in and not enabled by default in the vanilla SDK. Our Elastic distro brings in the package and enables them by default. Therefore, the dashboard will only work if a) the customer uses our distro or b) they enable the metrics themselves when using the vanilla SDK. Further, work is ongoing to define [semantic conventions for .NET runtime metrics](open-telemetry/semantic-conventions#1035). Once complete, the metrics will be implemented directly in the .NET runtime BCL and be available with no additional dependencies. The goal is to achieve that by .NET 9, which is not guaranteed. At that point, the metric names will change to align with the semantic conventions. This is not ideal, but it is our only option if we want to provide some form of runtime dashboard with the current metrics and OTel distro. As with elastic#182107, this dashboard uses a table for some of the data and this table doesn't seem to reflect the correct date filtering. Until there is a solution, this PR will remain in the draft, or we can consider dropping the table for the initial dashboard.  (cherry picked from commit 0600309)
Fixes #956
Changes
Adds proposed experimental .NET CLR runtime metrics to the semantic conventions. Based on discussions with the .NET runtime team, the implementation plan will be to port the existing metrics from OpenTelemetry.Instrumentation.Runtime as directly as possible into the runtime itself. The names have been modified to align with the runtime environment metrics conventions.
Merge requirement checklist
[chore]schema-next.yaml updated with changes to existing conventions.