runtime: 1.13 performance regression on kubernetes scaling #32828
Comments
|
As asked by @mknyszek, we re-run the tests from golang head with patched https://go-review.googlesource.com/c/go/+/183857
|

|
Interesting! The fact that the regression is still there indicates that it has little to do with that code snippet. This is a little surprising to me but it's definitely progress. Also, by removing that code snippet, it seems we lost virtually nothing in terms of physical memory utilization for the load test, based on graphs which were shared out-of-band. This is particularly interesting because I ran a bunch of benchmarks against that patch, of which 2 worsened significantly in terms of average and peak RSS when applying this patch (others retained their RSS usage improvements). This indicates to me that leaving it in is probably makes the most sense. My next best guess as to the cause of the regression (assuming it's the result of my changes, related to #30333) is the background scavenger existing in the first place, since it is a source of additional lock contention. If this is actually the cause, I have a new patch which might help. https://go-review.googlesource.com/c/go/+/184497 This patch makes it so that the background scavenger should rarely block all allocations from making progress. This patch is basically just a performance improvement, but it could be enough to help the 99th percentile API latency. If this patch doesn't help at all, then I'm out of guesses. I think we should consider bisecting at that point to try to find the source of the regression, though given that these scalability tests take a very long time to run, I imagine it'll take quite a few days to get to the bottom of that. There's a more aggressive version of this patch (that's slightly trickier) where we only block the one allocation which conflicts with the background scavenger. It's a very minor change to this patch but what makes it tricky is all the consequences. For now, let's try this patch. Out of curiosity, do you run the load test with GODEBUG=madvdontneed=1 set? In my experimentation, using MADV_FREE over MADV_DONTNEED does help here, but I understand that may not work if you need to track memory usage via any of the Linux-reported statistics. |
Sorry, re-reading this I realized it's slightly inaccurate. It doesn't just block allocations, it blocks frees, and anything else that needs to acquire the heap lock (which is a lot of things). So, it's a good bit worse today than what I originally said, but even the common case is fairly uncommon when we're talking about these code-paths. |
|
Thanks @mknyszek! Just to confirm, do you want us to run the tests from golang head with just the new patch applied and forget about the previous patch, right? Our scalability test resources are under high demand recently, but I will see what I can do to run the tests today or tomorrow. Regarding the GODEBUG=madvdontneed=1, AFAIR when debugging the go1.12 performance regression we agreed that it shouldn't matter as we're using 4.14+ kernel version. Let me know if the situation has changed here in any way. Given that it would make impossible to track memory usage via Linux-reported statistics, I think we can try it as an experiment if it can provide you with any meaningful insights, but it wouldn't work for us as a long term solution. |
No problem!
That's correct.
I realize this all takes a while to set up and run, so I appreciate you taking the time.
Ahhh right, I remember now. I forgot you're already using |
|
The bottleneck here is not my time but the scalability test resources, i.e. the gcp projects where we run the tests. The test uses 5K+ CPUs and takes over 10+h, there is only a few projects where I can run it and all of them are in high demand, other teams use them to run their scalability tests. We'll need to figure out something for long term plan, especially if we'd like to test new golang releases automatically / continuously. Nevertheless, I managed to find a free project and run the tests. I'm running the tests at the golang commit fbde753a58e286c405a04388816ed044486151bb (current head) with reverted https://go-review.googlesource.com/c/go/+/184098 (which apparently broke k8s build again, I asked for help in kubernetes/kubernetes#78845 (comment)) and with https://go-review.googlesource.com/c/go/+/184497 patched. |
|
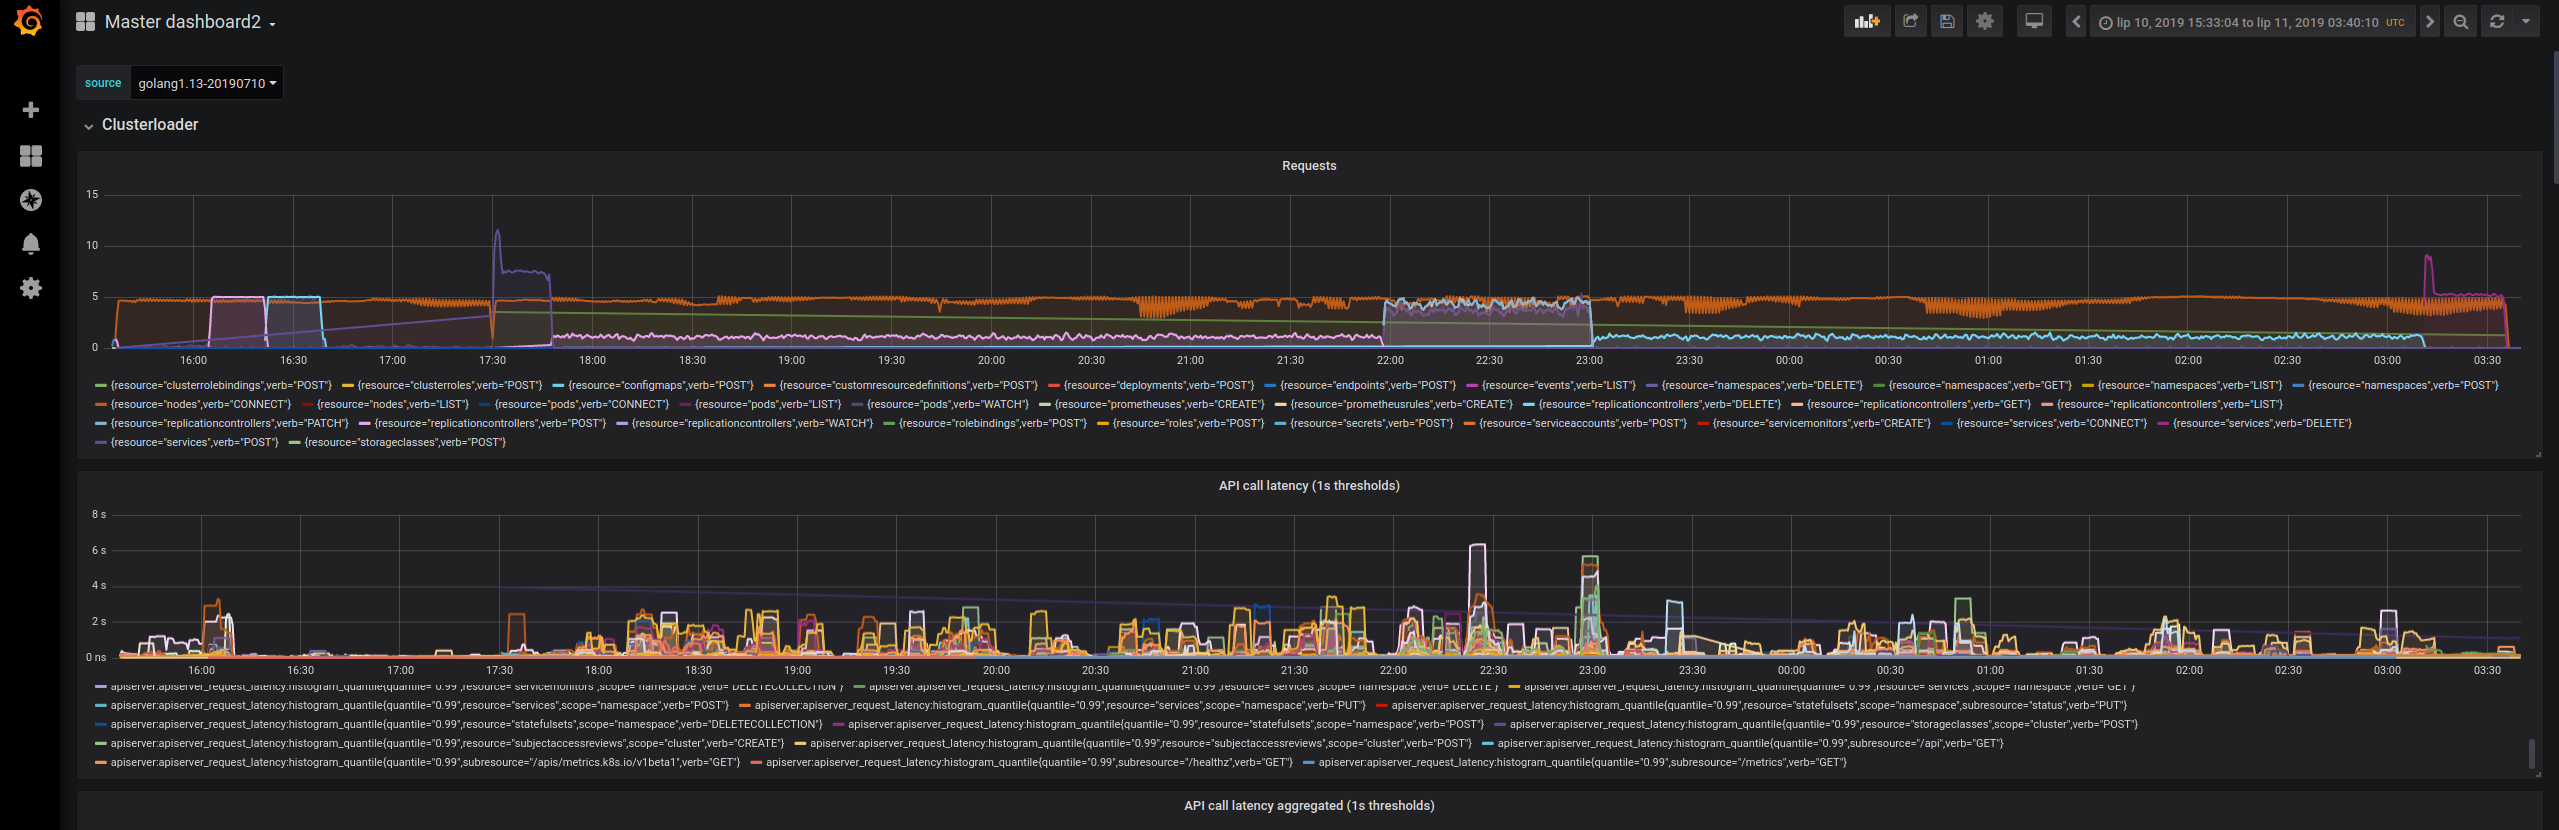
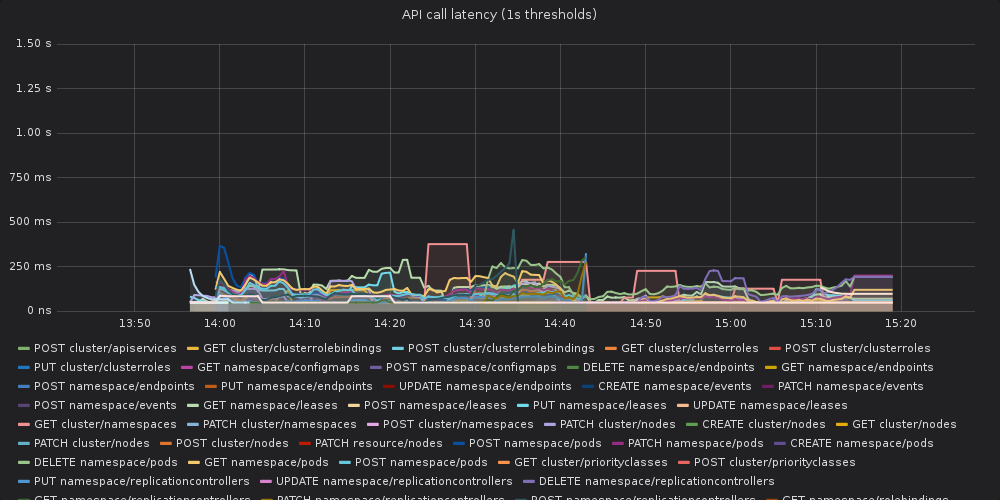
The test passed, but the api-call latency is still visibly worse than in the baseline: If we don't have any other ideas, I can try re-running the baseline to verify that we don't have any external infrastructure issues impacting the results. |

|
@mm4tt when you say it "passed" do you mean there's some threshold that average 99th percentile latency needs to stay under? If it did better this time around, then that's good news, and I think I have a next step. I have one more patch which is basically taking the idea from the previous patch further. It's a slightly riskier change to land for Go 1.13, but it might be enough to bring it back to expected levels. Can you please do another run with the following two patches applied to HEAD in the following order? |
|
@mknyszek - yes, that's exactly the case. We have a threshold that the 99th percentile of various groups of requests needs to stay under. It was the first run compiled with golang1.13 that passed, so there is an improvement, but the SLI is still much worse than in the baseline. I'm rerunning the tests with your patches. I still needed to revert https://go-review.googlesource.com/c/go/+/184098, as I'm not able to compile k8s with it in, but I don't think it should have any performance implications. |
|
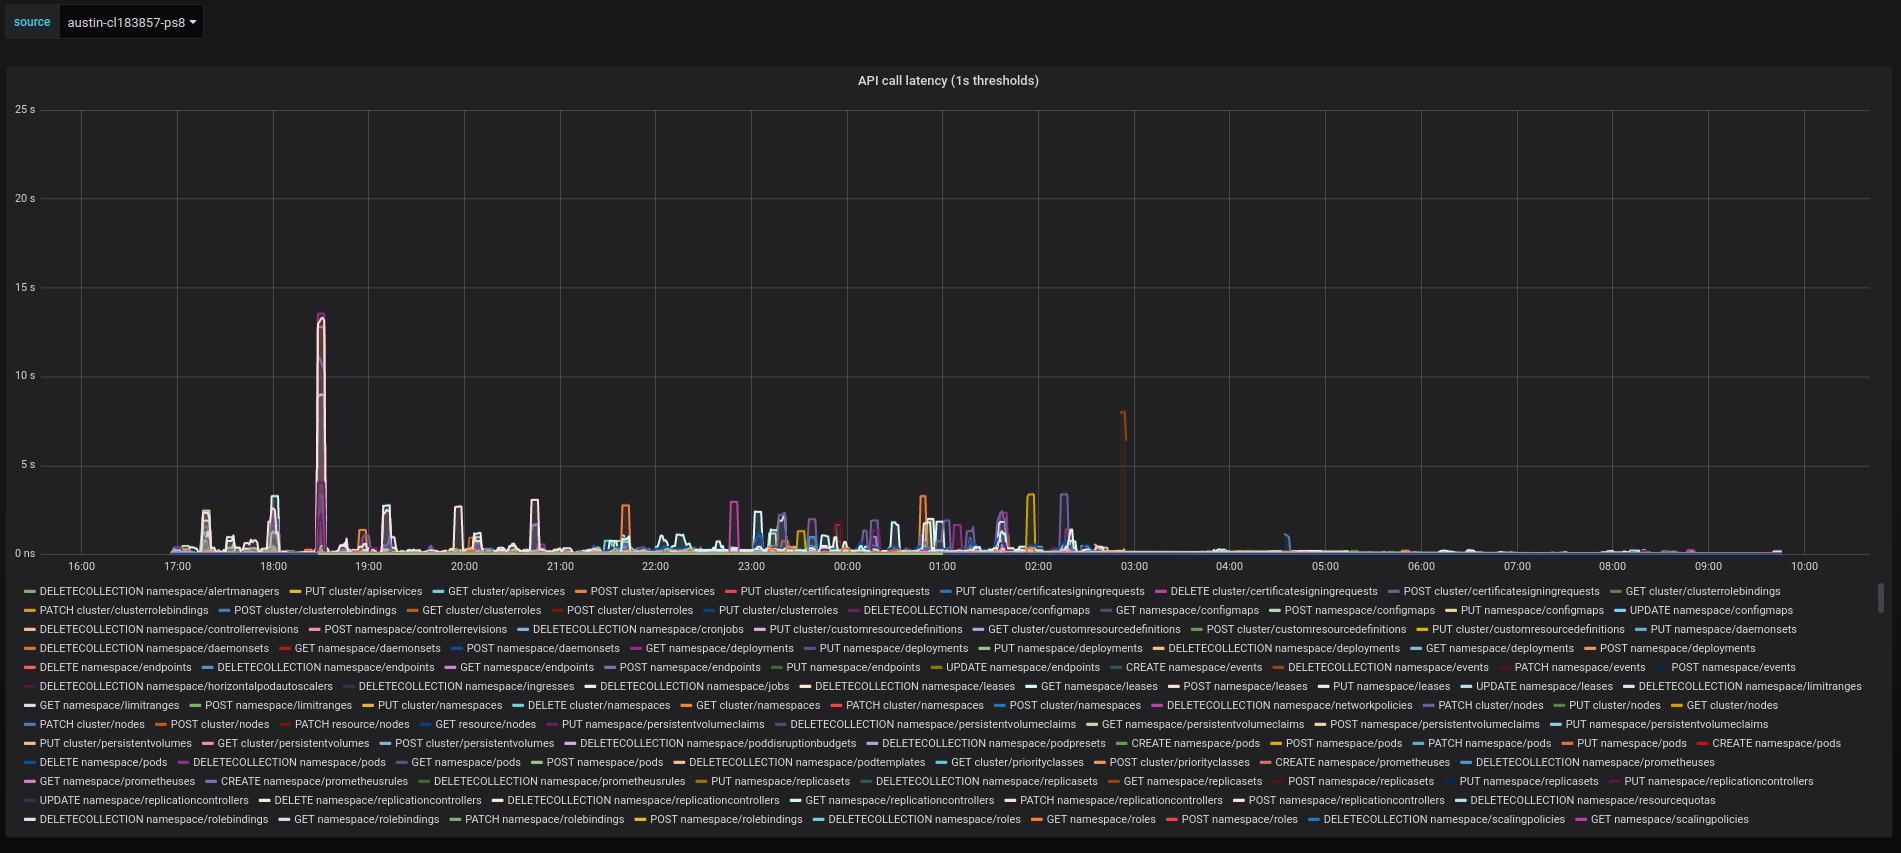
I've run the tests twice over the weekend and both times it made our api-server explode during the load test. From a cursory look at the graphs I found that there is a big increase in the memory usage comparing to the previous run (head + https://go-review.googlesource.com/c/go/+/184497) Jul 2nd run: Jul 5th: run @mknyszek, any ideas how to interpret that? In the meantime, I'm re-running the tests compiled with golang1.12 to get a better baseline. |


|
That's unfortunate, but thanks for confirming. It's possible the second change is broken in some way (not correctness, but in breaking some invariant), so I'll do some more testing. When you say "exploded" do you mean crashed in some way? OoM? What exactly went wrong? Can you please clarify what you mean by "memory usage"? Is it RSS, or virtual memory footprint? Or is it computed from MemStats and if so, which MemStats? |
|
By exploded I meant that it became overloaded (due to other components crashlooping) and eventually also started crashlooping, most likely because the load on it was so high that it wasn't able to reply on liveness probe in time and was restarted by kubelet. Hard to say what was the exact cause here, but there is a know vicious circle problem here. If the api-server becomes too overloaded, it slows down, other components may start restarting as they're not able to renew the "master lease" on time. Restarting components in turn introduce higher load on the apiserver as they issue more requests during initialization than during normal operation. Then api-server becomes even more overloaded and so the vicious circle continuous... "memory usage" is based on container_memory_usage_bytes metrics which I think is a sum of all kinds of memory, e.g. container_memory_rss., container_memory_cache, container_memory_swap I modified the graphs to see which one went up and it's the container_memory_rss: Jul 2nd: Jul 5th: |


|
Thanks for looking into the source of the memory increase. I'm having a hard time figuring out what could be going wrong that's related to my patch, especially since memstats seem to cut off a good amount (between 10:50 and 10:55) before memory actually spikes:
Based on this, it seems like the load spike comes in before RSS actually increases, and so the memory blow-up seems like it's just a symptom. The first stat, btw (heap_sys - heap_released) is what the runtime thinks the heap's contribution to RSS is, and I think it's fairly accurate. Naturally though it gets cut off when metrics start to disappear. My patch definitely seems to be involved though; I tried to run a bunch of benchmarks with the latest patch and managed to OOM a machine (at least, as far as I can tell, I can't SSH back into it even though it's on, which is usually a symptom of accidentally OOMing it). On the plus side, it seems like the latency is much better compared to before, at least while the server is alive? I think this is going in the right direction, I just need to figure out what went wrong here. |

|
Thanks Michael, Let me know if your benchmarks found anything. |
|
Well, I'm not sure now if I actually OOM'd the machine I mentioned, but I'm pretty sure I found a deadlock bug in that last patch that (I think if left sitting for long enough) has the potential to OOM. Is it possible that the api-server just deadlocked in the last run and got overloaded when it woke up, so much so that it started crash looping? In any case, I rewrote the patch to be more "obviously correct," meaning the synchronization should be much less funky, and this specific deadlock should be gone. To be safe and not waste valuable resources, I'm going to run my benchmarks overnight with those patches and make sure they don't OOM/deadlock/etc. I'll let you know tomorrow how it turns out, and if all goes well, could you please try applying the latest patch and trying it out again? Just to be completely clear, I mean the following two patches, at their latest versions: |
|
Sounds good, will run the tests once we get a green light from you. Thanks Michael! |
|
The benchmarks didn't explode, which is a good sign. I think the patches are good to go. |
|
Well, I took a longer look at everything and it seems like the fact that the scavenger tries to re-acquire the heap lock can actually make things worse in some cases. I have one more patch which makes things a little better, but it still seems like it's not much better than the Go 1.13 baseline (without the patches) for the benchmarks I've been running. It seems like it's helping y'all at least, given that the test passed? Do you think it's possible it was a fluke? Do you know how much it failed by? Finally, if you haven't started running the load test yet, would it be possible apply the following patches instead?
This includes that newest patch I mentioned. |
|
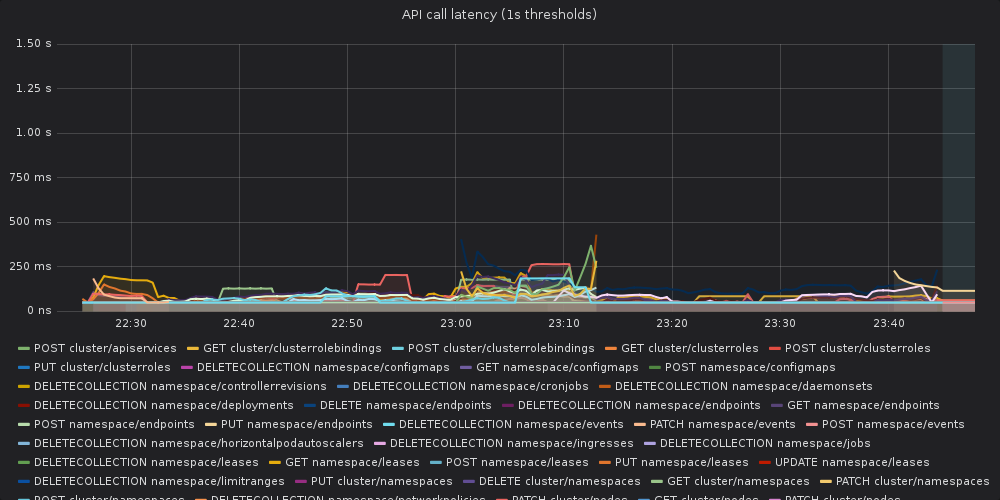
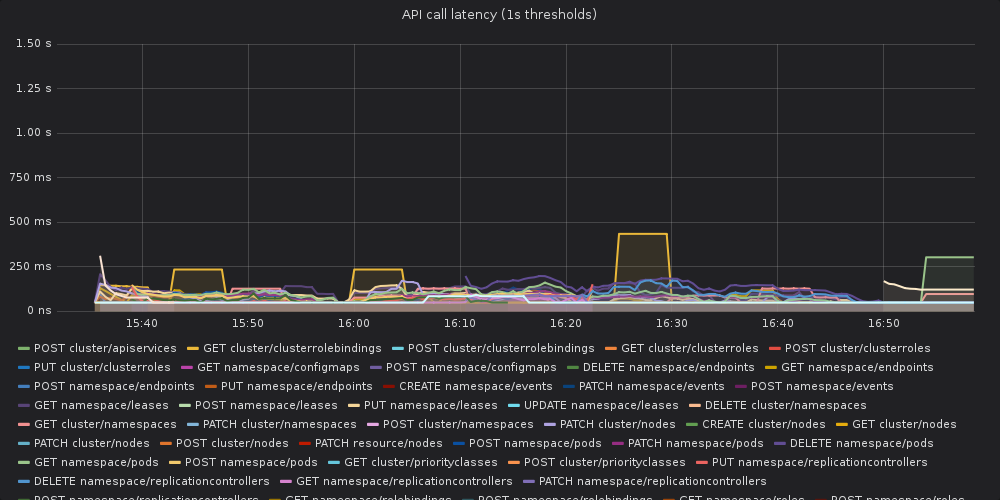
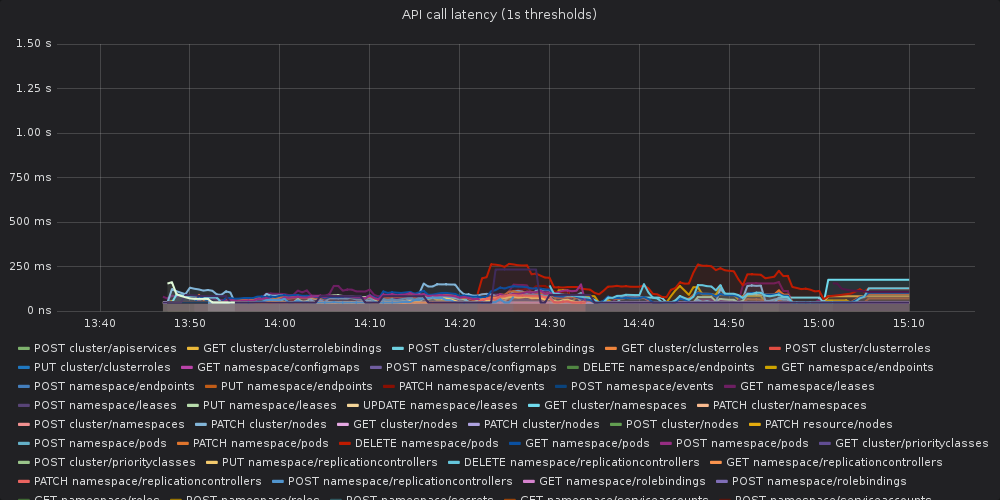
Unfortunately, I didn't get your second message on time and the tests were run without the third patch. This time the API server didn't explode. Unfortunately the results are still visible worse than in the baseline Baseline: Yesterday's run: To compare the same graph for Go 1.13 (no patches), imho it looks worse than the yesterday's run I'm not sure if I'll find resources to run the tests with the third patch this week, so most likely expect the results in the beginning of the next week. Nevertheless, I think we're still far from getting to the state where api-call latency is reasonable (i.e. similar to golang1.12 baseline). I'll see what can be done and get back to you beginning of the next week. |


|
I think you're right, and I think this direction of these patches
unfortunately isn't going anywhere; I need to take a step back and try to
better understand what specifically is causing the regression. No need to
use more load test resources on this for the time being.
One of the benchmarks I'm running provides a 99th percentile latency and
seems to be a good stand-in for the load test (and takes only a around half
an hour to run), so I'll continue with that for now and try to pinpoint the
source of the issue. If I make progress with a fix, it would be great to
have a dev project to try things out on, but it's not urgent.
Thanks so much for your help and cooperation, I'll get back to this thread
before the end of the week with any updates.
…On Thu, Jul 11, 2019, 5:12 AM Matt Matejczyk ***@***.***> wrote:
Unfortunately, I didn't get your second message on time and the tests were
run without the third patch.
This time the API server didn't explode. Unfortunately the results are
still visible worse than in the baseline
Baseline:
[image: OFTckmm27G7]
<https://user-images.githubusercontent.com/2604887/61035850-2faa7e00-a3c8-11e9-9567-dc655ca8cc70.png>
Yesterday's run:
[image: 3icudVa7Tfq]
<https://user-images.githubusercontent.com/2604887/61035864-36d18c00-a3c8-11e9-8fd7-952c2804d155.png>
To compare the same graph for Go 1.13 (no patches), imho it looks worse
than the yesterday's run
[image: 3ttBm4gPc08]
<https://user-images.githubusercontent.com/2604887/61036064-9def4080-a3c8-11e9-88c9-2d60431d46c9.png>
I'm not sure if I'll find resources to run the tests with the third patch
this week, so most likely expect the results in the beginning of the next
week.
Nevertheless, I think we're still far from getting to the state where
api-call latency is reasonable (i.e. similar to golang1.12 baseline).
Given how long and expensive (and hard to find resources for) the tests
we're currently running are, it's not the most efficient way to iterate on
this issue. I'll see if we can find some faster and less expensive tests
instead (that would also catch the difference between go1.12 and go1.13).
Ideally, I could give you access to some smaller dev project where you
could execute the tests yourself. This should allow us to iterate faster
and once we had some reasonable version we could re-run the standard tests
to verify.
I'll see what can be done and get back to you beginning of the next week.
—
You are receiving this because you were mentioned.
Reply to this email directly, view it on GitHub
<#32828?email_source=notifications&email_token=AAJQ3HHHTMIUVDMAG425E73P632O5A5CNFSM4H4ER6T2YY3PNVWWK3TUL52HS4DFVREXG43VMVBW63LNMVXHJKTDN5WW2ZLOORPWSZGODZWBYFI#issuecomment-510401557>,
or mute the thread
<https://github.com/notifications/unsubscribe-auth/AAJQ3HFZYXS6RF2ZLYS5WWDP632O5ANCNFSM4H4ER6TQ>
.
|
|
I think I've narrowed down the range of CLs which contain the source of the regression, and they're all mine. Turns out it has nothing to do with the background scavenger, but rather with changes I made to the treap implementation in the runtime, which feels familiar. Reducing the number of treap operations required for allocation/free/scavenging probably isn't possible without a huge refactoring, so I think the main thing to do here is to try to make the operations themselves faster. I didn't expect what I added to have such a large effect but given that there's a lot of heap lock contention I suppose I shouldn't be surprised. In the past I attempted to add a cache to speed up allocations, but it didn't help much. But, perhaps there's something yet-unexplored here. I'll think about it some more. |
|
A short update from my side, busy week, but haven't forgot about this. |
|
I've finished running the experiments proposed by @mknyszek. The TL;DR is: at current HEAD, the answer appears to be to apply CL 183857. Here's a full summary of the experiments:
Jumping forward to treap changes:
Jumping forward to background scavenger:
Jumping forward to HEAD, which includes CL 186926, which fixes a bug introduced in 31c4e09 that lots of unnecessary madvise calls:
I think we have our answer. |


|
Thanks. Should we put 183857 into 1.13? It looks safe enough. |
|
I would like to. It failed several trybots, which I haven't had a chance to
debug. I'm also having trouble running the k8s load test to confirm the fix
(infrastructure issue unrelated to the fix itself).
… |
|
Change https://golang.org/cl/189957 mentions this issue: |
|
Change https://golang.org/cl/183857 mentions this issue: |
|
@mknyszek pointed out that the final result above (0ca4f6b + CL 183857: unified treaps + optimizations + mdavise fix, background scavenger, no inline scavenging) didn't do heap growth scavenging, so in some sense it was cheating. However, I just got a test run with CLs 189957 PS 3 and 183957 PS 8, with the fix to add back heap-growth scavenging. It doesn't look quite as good, but it still looks pretty good, and it's not cheating:
|
|
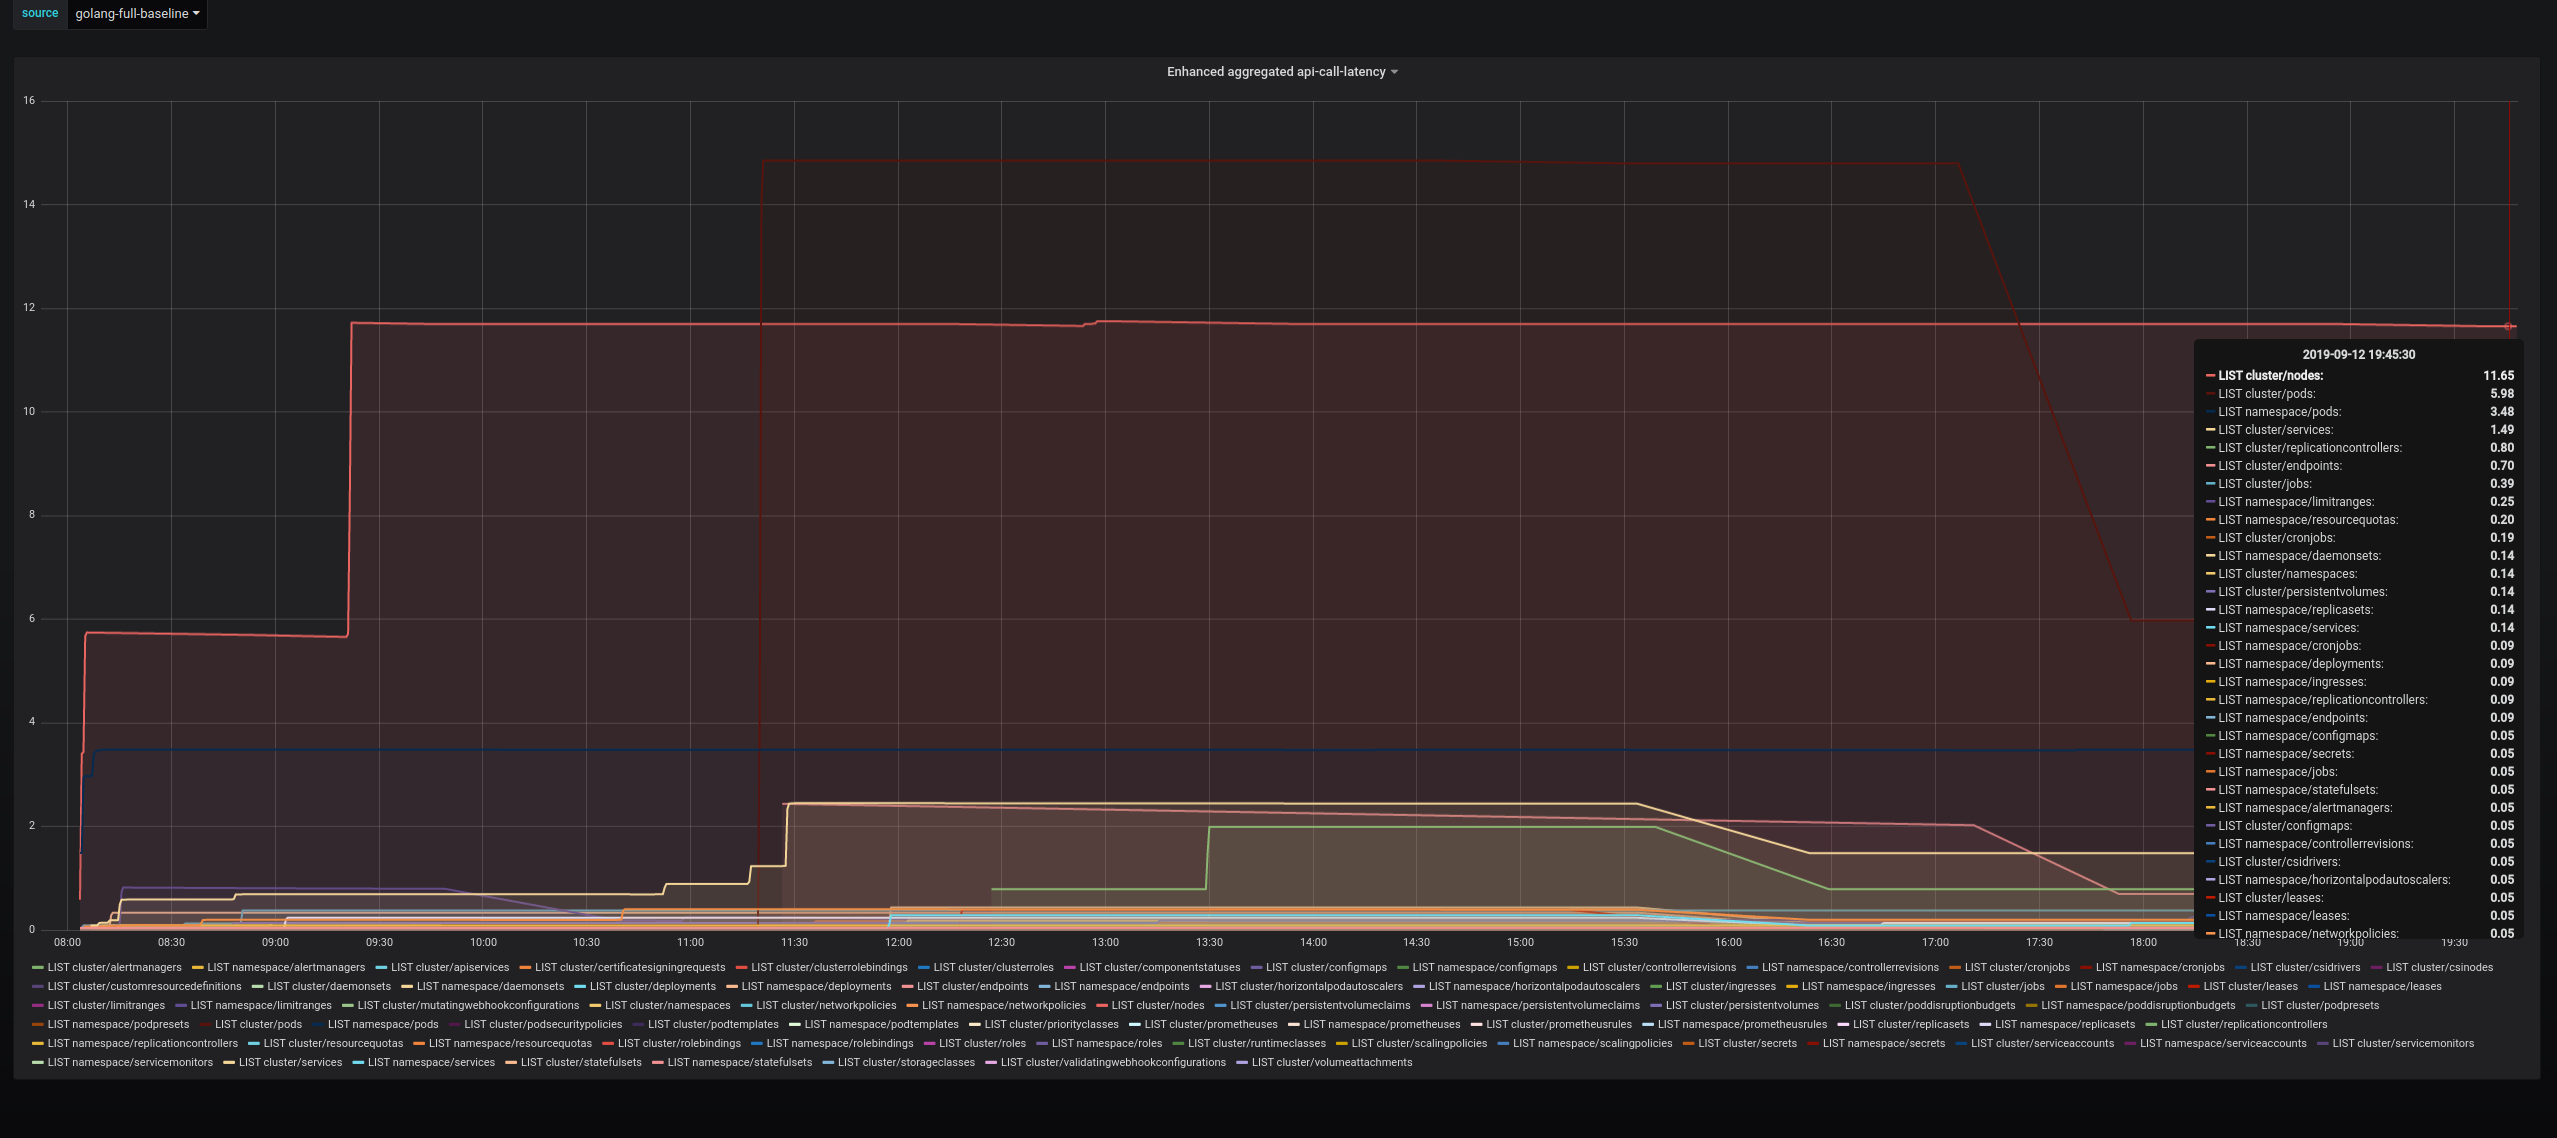
With @oxddr's help, I was able to run the full 14 hour load test with CL 183857 PS 8. The results look pretty good to me:
@oxddr says this is the same plot as the "non-WATCH request latency (99th percentile)" from the original posts. Compared to the 1.12 baseline, there are a lot of requests that actually appear much lower latency overall. There are a few brief spikes, but the baseline had that, too, and it's nothing compared to the fog of spikes from 1.13 beta. So, based on my assessment, CL 183857 (and its parent) appears to fix this issue. |
|
Actually, the plot I pasted isn't comparable because it omits LIST calls, so the results are currently inconclusive. |
|
@oxddr built a tool to do a more principled comparison of the latency distributions and found that the proposed fixes "don't look good". Unfortunately, that means I don't really know how to make progress here. @mknyszek and I may have to go back to the drawing board. We'll keep working on this issue, and once we find a fix, our plan is to issue a point release if at all possible, but in the mean time, we're going to go ahead with releasing 1.13. |
|
Hey Folks, I think I have great news. I've re-run the full tests on golang1.12 (baseline) and golang1.13 (at 2754118) with the two patches that we tried already (which helped, but didn't fix the performance issue totally), i.e., https://go-review.googlesource.com/c/go/+/189957/3, https://go-review.googlesource.com/c/go/+/183857/8 + the new @mknyszek's patch, https://go-review.googlesource.com/c/go/+/193040/2, and there is no visible difference in api-call-latency. In some aspects the golang1.13 run is even slightly better than the baseline. I'll post a more detailed comparison here later, but the summary is that if we could land all those 3 patches, then we, K8s SIG-Scalability, would be completely satisfied with the golang1.13 performance, meaning that we can basically close this issue. @aclements, @mknyszek, any thoughts on that? How hard would it be to release these patches? Any estimate on the potential timeline? |
|
@mm4tt Austin's patches already have +2 and my patch is very short, so it should be easy to land to master. I'd personally like to release it in the first 1.13 point release, 1.13.1. Unfortunately I don't know what the time frame is for it since we're a little bit out of the usual release cycle. I'll ask around and get back to you with that. @aclements also mentioned wanting having some soak time for them to catch any unintended side-effects prior to release. I imagine since the full release just came out we'll have a decent amount of time to let it soak on master before cherry-picking it into the next point release. |
|
The comparison I promised in the previous post. Api-call latency (non-LIST)baseline The results are very similar, golang1.13 has 3 spikes exceeding 1.5s that we don't see in the baseline, but this is most likely noise. I'm quite sure that if we re-run the tests these spikes could disappear or even appear in the baseline. Single spikes are acceptable, and that's why our performance SLIs are not based on instant api-call-latency but rather on aggregation over whole test, which we'll compare below. Aggregated api-call latencybaseline During the test, the graph for golang1.13 looks worse due to the 3 spikes above, but looking at the end of the test the golang1.13 run actually looks better. There are only 6 metrics exceeding 500ms (in baseline there are 8) and none exceeding 1s (in baseline there is 1). Aggregated LIST latencybaseline This time it's clearly in favor of the golang1.13. The aggregated list latency is clearly better for the golang1.13 run. To sum up, some aspects are worse for golang1.13 and some are better, but most differences are most likely just a noise. I believe we can close this issue once all three patches merge. Let me know if there is anything more we can assist you with and thank you so much for your tireless work on this issue! |


|
@mknyszek, @aclements, circling back on this, any updates on merging these patches into HEAD? |
|
Change https://golang.org/cl/193040 mentions this issue: |
This change makes it so that the scavenge goal is defined primarily in
terms of heap_inuse at the end of the last GC rather than next_gc. The
reason behind this change is that next_gc doesn't take into account
fragmentation, and we can fall into situation where the scavenger thinks
it should have work to do but there's no free and unscavenged memory
available.

In order to ensure the scavenge goal still tracks next_gc, we multiply
heap_inuse by the ratio between the current heap goal and the last heap
goal, which describes whether the heap is growing or shrinking, and by
how much.

Finally, this change updates the documentation for scavenging and
elaborates on why the scavenge goal is defined the way it is.

Fixes #34048.
Updates #32828.

Change-Id: I8deaf87620b5dc12a40ab8a90bf27932868610da
Reviewed-on: https://go-review.googlesource.com/c/go/+/193040
Run-TryBot: Michael Knyszek <[email protected]>
TryBot-Result: Gobot Gobot <[email protected]>
Reviewed-by: Austin Clements <[email protected]>
Reviewed-by: Keith Randall <[email protected]>
Inline scavenging causes significant performance regressions in tail
latency for k8s and has relatively little benefit for RSS footprint.

We disabled inline scavenging in Go 1.12.5 (CL 174102) as well, but
we thought other changes in Go 1.13 had mitigated the issues with
inline scavenging. Apparently we were wrong.

This CL switches back to only doing foreground scavenging on heap
growth, rather than doing it when allocation tries to allocate from
scavenged space.

Fixes #32828.

Change-Id: I1f5df44046091f0b4f89fec73c2cde98bf9448cb
Reviewed-on: https://go-review.googlesource.com/c/go/+/183857
Run-TryBot: Austin Clements <[email protected]>
TryBot-Result: Gobot Gobot <[email protected]>
Reviewed-by: Keith Randall <[email protected]>
Reviewed-by: Michael Knyszek <[email protected]>
|
Change https://golang.org/cl/198485 mentions this issue: |
Currently, we map and grow the heap a whole arena (64MB) at a time.
Unfortunately, in order to fix #32828, we need to switch from
scavenging inline with allocation back to scavenging on heap growth,
but heap-growth scavenging happens in large jumps because we grow the
heap in large jumps.

In order to prepare for better heap-growth scavenging, this CL
separates mapping more space for the heap from actually "growing" it
(tracking the new space with spans). Instead, growing the heap keeps
track of the "current arena" it's growing into. It track that with new
spans as needed, and only maps more arena space when the current arena
is inadequate. The effect to the user is the same, but this will let
us scavenge on much smaller increments of heap growth.

There are two slightly subtleties to this change:

1. If an allocation requires mapping a new arena and that new arena
   isn't contiguous with the current arena, we don't want to lose the
   unused space in the current arena, so we have to immediately track
   that with a span.

2. The mapped space must be accounted as released and idle, even
   though it isn't actually tracked in a span.

For #32828, since this makes heap-growth scavenging far more
effective, especially at small heap sizes. For example, this change is
necessary for TestPhysicalMemoryUtilization to pass once we remove
inline scavenging.

Updates #34556

Change-Id: I300e74a0534062467e4ce91cdc3508e5ef9aa73a
Reviewed-on: https://go-review.googlesource.com/c/go/+/189957
Run-TryBot: Austin Clements <[email protected]>
TryBot-Result: Gobot Gobot <[email protected]>
Reviewed-by: Keith Randall <[email protected]>
Reviewed-by: Michael Knyszek <[email protected]>
(cherry picked from commit f18109d)
Reviewed-on: https://go-review.googlesource.com/c/go/+/198485
Run-TryBot: Andrew Bonventre <[email protected]>
Reviewed-by: Austin Clements <[email protected]>
Together with golang team, we, kubernetes sig-scalability, are testing not-yet-released golang1.13 against kubernetes scale tests.
What version of Go are you using (
go version)?Does this issue reproduce with the latest release?
Yes, it reproduces with golang head.
What did you do?
We've run k8s scale tests with kubernetes compiled with go1.13.
There is a visible increase in 99th percentile of api call latency when compared to the same version of kubernetes compiled against go1.12.5.
What did you expect to see?
We expected similar api-call latency as in the baseline run compiled with go1.12.5

What did you see instead?
The api-call latency was visibly worse in the run compiled with golang1.13

The text was updated successfully, but these errors were encountered: