-
-
Notifications
You must be signed in to change notification settings - Fork 29
New issue
Have a question about this project? Sign up for a free GitHub account to open an issue and contact its maintainers and the community.
By clicking “Sign up for GitHub”, you agree to our terms of service and privacy statement. We’ll occasionally send you account related emails.
Already on GitHub? Sign in to your account
Extension Doesn't seem to be working in Godot 3.2.3RC4 #10
Comments
|
I'll have a look. The ProjectTypeGuid was moved to the Sdk. I hope Visual Studio can support that. |
|
I had the same issue yesterday with a pre-RC 5 test build, and I expect the newly released 3.2.3 RC 5 still has the same issue. Edit: Confirmed, same issue with RC 5. |
|
I confirm this issue , Windows 3.2.3 RC 5 |
|
I was really excited about this and installed 3.2.3 RC 6 and am experiencing the same issue using release 1.1.1 of the extension. |
|
I dug into this, and I got something working again, but with a significantly degraded experience. 😕 Basically, I made a button that assumes the current startup project is a Godot project and launches the debugging session. The problem seems to be the new project system, and not using
There's also this chart indicating a very different new system in use for .NET-Core-style projects: https://github.com/microsoft/VSProjectSystem#compare-mpfproj-and-visual-studio-project-system
They have a doc page for project flavoring: https://github.com/microsoft/VSProjectSystem/blob/master/doc/overview/extend_an_existing_project_type.md. But... as of writing, it's TODO 😢:
I wanted to try out using the new system, but I hit a wall trying to find docs or any kind of example that resembles what the Godot extension needs. Maybe someone will have more success than me here. On to what I did... I added a basic
Branch/diff: button-assume-godot This is my first time doing anything beyond F5ing a VS extension project, so I don't have the experience to polish this up into something that might be usable broadly. Maybe the general approach of simply having our own set of launch buttons might be good enough for now? It's good enough for me, and still way better than trying to use the Mono debugger manually. |
|
I noticed that in the csproj file the Godot SDK is specified: |
|
But will it ever recover? |
|
Sorry for the delayed reply. It's as @31 said, Visual Studio uses a new project system for Sdk style projects. As that problem is unlikely to be solved soon, we will need to go with a workaround. I'll make the extension load always to have Godot special code completion work, and I will add commands for launching the debugger similarly to @31's workaround. That should be enough to make the extension usable again, even if it's a degraded experience. At least until we can make this work with the new project system. |
|
By the way, there's a workaround you can use today to make the extension work. The idea is to use an old style C# project as placeholder to trigger the extension. Add a new C# project to your solution. Make sure it's an old style project, not Sdk style. Add the <?xml version="1.0" encoding="utf-8"?>
<Project ToolsVersion="15.0" xmlns="http://schemas.microsoft.com/developer/msbuild/2003">
<Import Project="$(MSBuildExtensionsPath)\$(MSBuildToolsVersion)\Microsoft.Common.props" Condition="Exists('$(MSBuildExtensionsPath)\$(MSBuildToolsVersion)\Microsoft.Common.props')" />
<PropertyGroup>
<Configuration Condition=" '$(Configuration)' == '' ">Debug</Configuration>
<Platform Condition=" '$(Platform)' == '' ">AnyCPU</Platform>
<ProjectGuid>{F97F64DA-67E2-448D-8516-2F7427C8B882}</ProjectGuid>
<OutputType>Library</OutputType>
<RootNamespace>StubProj</RootNamespace>
<AssemblyName>StubProj</AssemblyName>
<TargetFrameworkVersion>v4.7.2</TargetFrameworkVersion>
<FileAlignment>512</FileAlignment>
<AutoGenerateBindingRedirects>true</AutoGenerateBindingRedirects>
<Deterministic>true</Deterministic>
<ProjectTypeGuids>{8F3E2DF0-C35C-4265-82FC-BEA011F4A7ED};{FAE04EC0-301F-11D3-BF4B-00C04F79EFBC}</ProjectTypeGuids>
</PropertyGroup>
<PropertyGroup Condition=" '$(Configuration)|$(Platform)' == 'Debug|AnyCPU' ">
<PlatformTarget>AnyCPU</PlatformTarget>
<DebugSymbols>true</DebugSymbols>
<DebugType>full</DebugType>
<Optimize>false</Optimize>
<OutputPath>bin\Debug\</OutputPath>
<DefineConstants>DEBUG;TRACE</DefineConstants>
<ErrorReport>prompt</ErrorReport>
<WarningLevel>4</WarningLevel>
</PropertyGroup>
<ItemGroup>
    <ProjectReference Include="..\MyGame.csproj">
      <Project>{5957a55d-a731-4684-85cb-0bf023e5d393}</Project>
      <Name>MyGame</Name>
      <Private>False</Private>
    </ProjectReference>
</ItemGroup>
<Import Project="$(MSBuildToolsPath)\Microsoft.CSharp.targets" />
</Project>Change the path, guid and name of the Set this project as the "Startup Project" in Visual Studio, either from the toolbar next to the launch button or right click the project and "Set as Startup Project". That should be enough to make it work. The launch button should be "Play in Editor" again. The reason the placeholder project needs to reference your game project is because otherwise VS shows "No compatible code running" when a breakpoint hits. |
|
I have done the @neikeq workaround and now I have that issue. What option do I have to do in Godot to make it work? |
|
@juanpaexpedite You should have a Godot editor instance open editing the same project. If you already have and still get that error, then it's a bug. But that would be a different issue to this one. |
|
I noticed that editing when paused & continuing doesn't appear to actually take the changes (athough breakpoints appear to work fine). (I can also edit the files when the game isn't paused, like other things that work with edit & continue.) Is this a limitation of the addon, or part of this issue? |
yeah, at the moment you have to use the workaround posted above by @neikeq |
|
I can confirm the workaround still works. I feel like a better solution. and something that's needed regardless. is a generate vs project button in godot. Then it can just generate the proxy project for you. |
|
I've pointed a few people at this issue who needed more info to successfully apply the workaround. So, I decided to try it out and document a full process to get the workaround in place. Step by step workaround guide: |
|
vs 2019 16.9.x |
|
Trying the @31 workaround guide got me to this error: Method not found: 'Void Mono.Debugging.Evaluation.ObjectValueAdaptor.set_DebuggerSession(Mono.Debugging.Client.DebuggerSession)'. Any idea what I did wrong? Thanks! |
Here's my tutorial:Important: The VSMonoDebugger extension will prevent this one from from working.
|
|
@piratesephiroth Thanks for the quick reply! Im still getting the same error. Wondering if I just messed it all up trying a few different things before coming to this? I followed this first. |
|
You should get the GUID from your project file directly to avoid any mistakes. |
|
In case anyone is interested, JetBrains Rider works GREAT with Godot mono out of the box. Of course, it isn't free. For me it is worth the cost. |
|
Excuse me for my poor English my VS 16.9.2 not working |
|
You know what? I forgot to mention the main project .csproj file doesn't have a GUID in it: Alright, last ditch effort, then I'll start asking about how to get Rider to work. LOL |
|
This does not work anymore (unless you want to be restricted to .NET Standard 2.0) |
https://github.com/godotengine/godot-csharp-visualstudio/tree/1.x, but it's a bit bugged, and hasn't worked smoothly since Godot 3.2.3 RC4 (godotengine/godot-csharp-visualstudio#10).  Eventually, I figured out how to get it working by following the guide at https://gist.github.com/31/302bab2630ddf8d90ab4aec0d358b538 .

To install the extension in the first place, you'll have to add the "Mobile Development with .NET" component of Visual Studio, although you can uncheck the optional Android sub-component of that addition.

Note that I'm using Visual Studio 2019 because I'm on Windows 8.1.  However, reports are that even with the work-around to get it working, using the extension breaks IntelliSense on Visual Studio 2022.  Thus, I recommend sticking with Visual Studio 2019 regardless.

Use the "Launch" debug target to start it, and it works.  "Play in Editor" is the default but requires a Godot editor instance to be up, so I'm not sure why you'd prefer it unless you already had it up to use its GUI tools.
https://github.com/godotengine/godot-csharp-visualstudio/tree/1.x, but it's a bit bugged, and hasn't worked smoothly since Godot 3.2.3 RC4 (godotengine/godot-csharp-visualstudio#10).  Eventually, I figured out how to get it working by following the guide at https://gist.github.com/31/302bab2630ddf8d90ab4aec0d358b538 .

To install the extension in the first place, you'll have to add the "Mobile Development with .NET" component of Visual Studio, although you can uncheck the optional Android sub-component of that addition.

Note that I'm using Visual Studio 2019 because I'm on Windows 8.1.  However, reports are that even with the work-around to get it working, using the extension breaks IntelliSense on Visual Studio 2022.  Thus, I recommend sticking with Visual Studio 2019 regardless.

Use the "Launch" debug target to start it, and it works.  "Play in Editor" is the default but requires a Godot editor instance to be up, so I'm not sure why you'd prefer it unless you already had it up to use its GUI tools.
|
Hello there, its 2022 and I am not able to see the Play in Editor button. Has this been fixed or we have to use some workarounds still? If yes, which one? I am using visual studio 2022 and Godot 3.4.4 (Mono version (C# support)). Any help would be appreciated. |
|
it is Godot 3.5 now and no fix for this :( |
|
@neikeq Just a question related to this bug, since .net6 was merged into Godot 4, will Godot 4 suffer from this bug as well or was work done to solve this issue without the above workaround? |
|
The root of the issue applies to Godot 4 as well. However, there are other challenges as well, like how to implement Currently, the way to debug C# in Godot 4 with Visual Studio is as I explained here:
|
|
Ah, I see. I didn’t get that far in the conversation. So, in that case, the extension isn’t used then. Thanks for the info. |
|
Found something new. Maybe we this could help to solve the sdk style problem... Maybe we could use a launch.vs.json to set the different debug targets. Mabe there are events for that? |
|
It works in combination with @neikeq 's way of starting Godot. Looks like this: {
"profiles": {
"Launch": {
"commandName": "Project"
},
"PlayInEditor": {
"commandName": "Project",
"commandLineArgs": "--path [Path/to/godot/project]"
}
}
}And in you .csproj: <PropertyGroup>
<StartAction>Program</StartAction>
<StartProgram>[Path/to/Godot.exe]</StartProgram>
</PropertyGroup>if you leave your commandLineArgs empty it just launches godot without a project. Not sure if we can realize an "attach" functionality this way tho. Edit: I think it should be possible that the extension creates the launchSettings.json and the entry in the .csproj for you |
|
This PR implements a way to define the Godot.exe path and execute it in a reliable way than the previous StubProj. All it needs is to deliver the parameters for different scenarios of debugging. neikeq has different messaging system to capture the standard and errors outputs for display in VS2022 I think the PR or the one before capture the godot project path |
|
The code to define the .exe path could be used to create the .csproj entry. But other than that I think these two approches are too different to be useful for eachother. I didn't try if my solution works with breakpoints tho. Will do that later.
|
|
Update: The next steps would be to check if the extension can interrupt startup and get information from the launchSettings. Maybe via environment variables... This way we could implement an "attach" launch profile. |
|
I did some more digging and tried to make the Csp sample work @azbay mentioned. Like @neikeq, it didn't build out of the box, but I managed to make it build. Now It should build. The extension seems to load (it hits the breakpoint inside the CustomDebugger.cs constructor), but it doesnt add the new "CustomDebugger" Debug option to the Godot project... I think it has something todo with the nuget itself. Inside the "CpsExtension.Nuget.targets" the CpsExtensionDesignTimeTargetsPath uses a condition which cant be fullfilled. I tried to remove the condition but it also didnt show up the CustomDebugger... Maybe someone else got more ideas? |
Can you clarify are you relying on StubProj? However, the new CommandLine to launching Godot seems clear to follow. What needs to be done is to connect the Godot VS2022 extension Messaging to receive the standard and error outputs of running an external command (e.g. Godot.exe). These are the information that help to communicate with VS2022 where are the error and what are the error messages. |
|
@GeorgeS2019 I dont rely on StubProj. |
|
Is this well documented? There is an option which is not StubProj and the latest commandline? Can u share the links I could follow this Third method? |
|
Follow my findings I mentioned above. <PropertyGroup>
<StartAction>Program</StartAction>
<StartProgram>C:\Path\To\Godot.exe</StartProgram>
<StartArguments>--path C:\Path\To\Godot\Project\</StartArguments>
</PropertyGroup>to your .csproj and you can start debugging. But currently I'm more interested in getting the csp sample to work |
|
Improved with MSBuild properties (I defined GODOT_EXE as an environment variable): |
|
This should be closed...Godot 3. |


OS/device including version:
Windows 10
Issue description:
Expected:
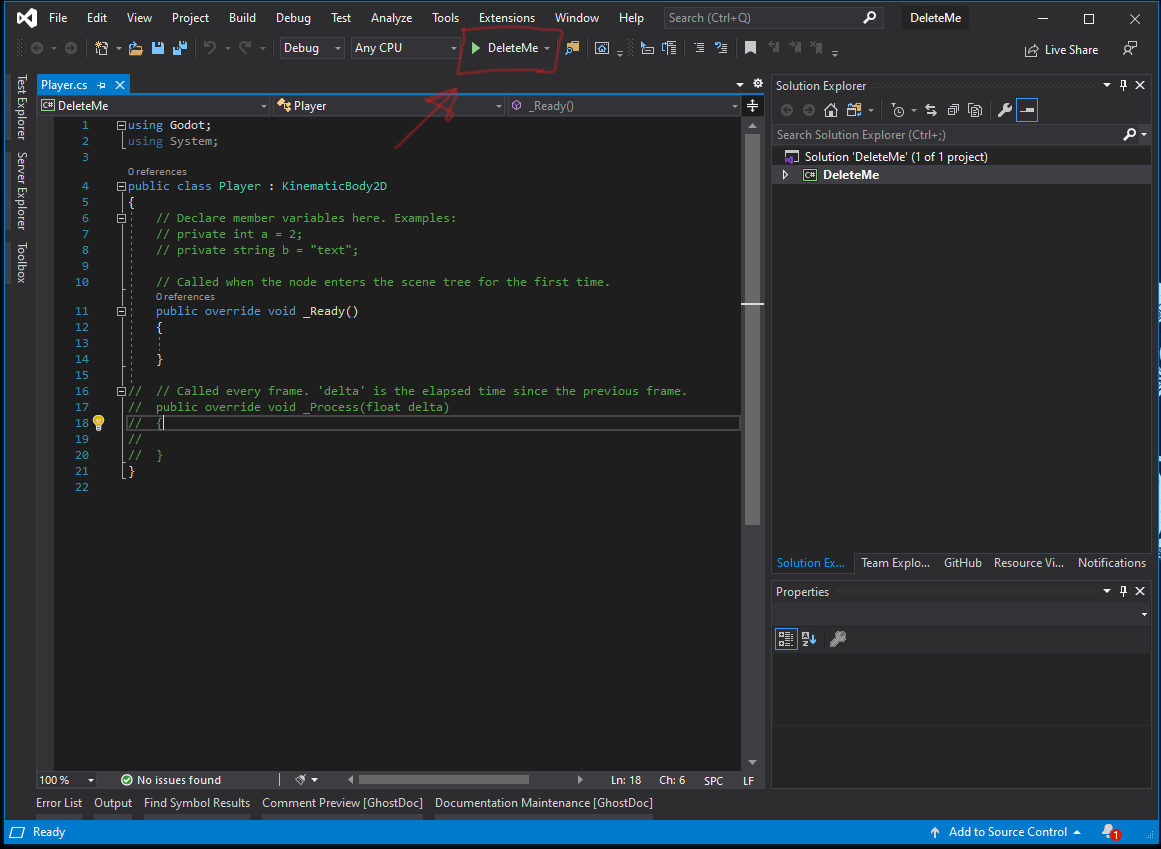
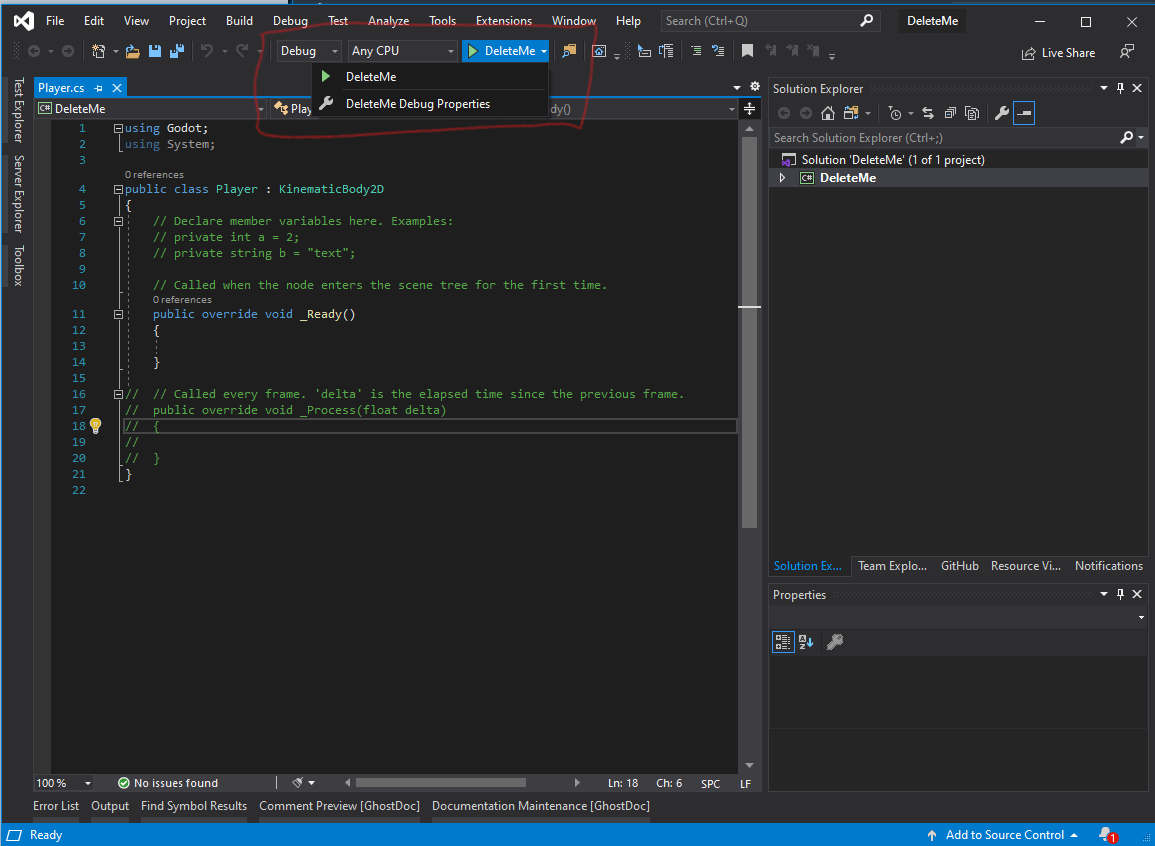
Expected to see
Play In Editor,Launch, orAttachActual:
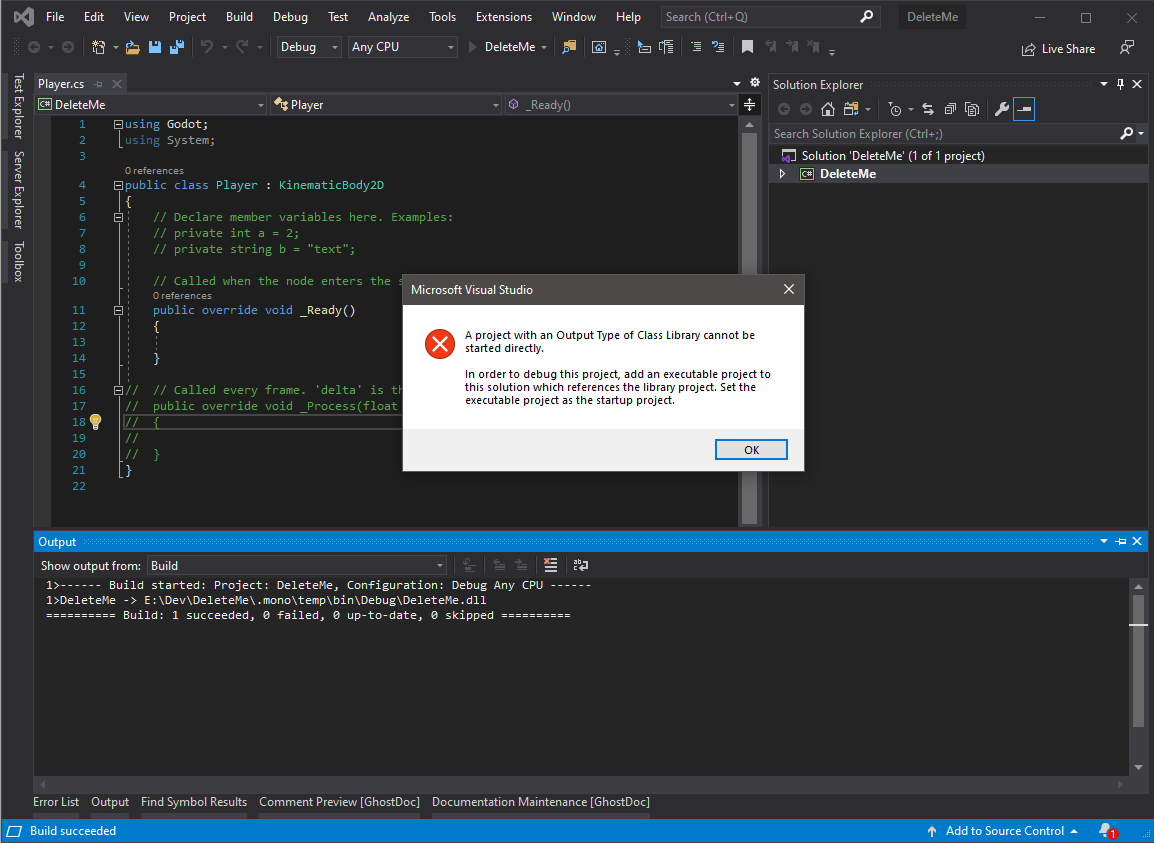
Only see the Project name and it will not launch instead throwing an error of
A project with an Output Type of Class Library cannot be started directlyScreenshots of issue:


NOTES
This worked just fine when using RC3. My guess is that when RC4 upgraded to the csproj sdk format, it broke compatibility.
The text was updated successfully, but these errors were encountered: