-
Notifications
You must be signed in to change notification settings - Fork 8.3k
New issue
Have a question about this project? Sign up for a free GitHub account to open an issue and contact its maintainers and the community.
By clicking “Sign up for GitHub”, you agree to our terms of service and privacy statement. We’ll occasionally send you account related emails.
Already on GitHub? Sign in to your account
Kibana IPV6 "No living Connections" #23764
Comments
|
pinging @elastic/kibana-operations |
|
Just removed the part concerning Reverse Proxy, as in fact the error is the same when connecting directly to Kibana without Reverse Proxy. So this is only Basic IPV6 configuration now. |
|
Square brackets need to be put around |
Without square brackets around the hostname/IP address Kibana
fails to connect to an IPv6 ElasticSearch on startup and you
can't create an initial index pattern. This adds the brackets.

Closes elastic#23764
|
This is exactly the problem. The only thing that does not work is getting index values from browser (requesting ElasticSearch throught Kibana from browser). I tried your fix but it doesn't work, it applies for all connections, not only this one, making other connections to ElasticSearch to fail. I fix it by patching file "optimize/bundles/vendors.bundle.js" in function "Host.prototype.makeUrl" by adding brackets around host. This is only a workaround, because this will not work for IPV4. But for now i didn't find exactly from where host parameters are comming from. Thanks @hhoover ! You help me find out what was exactly the problem, i was looking for it for quite a long time now :) |
|
When this will be fixed. |
Kibana version:
Docker 6.4.1 oss
Elasticsearch version:
Docker 6.4.1 oss
Server OS version:
Redhat 7.3
Browser version:
Chrome Version 69.0.3497.100 (Official Build) (64-bit)
Firefox Quantum 62.0.3 (64-bit)
Browser OS version:
Windows 7
Windows 10
Original install method (e.g. download page, yum, from source, etc.):
Docker
Describe the bug:
ELK are all running in docker containers at the latest stable version (6.4.1 oss) using network host configuration.
The configuration is working well in IPV4, but not in IPV6.
Logstash and Kibana are working well both in IPV4 and IPV6.
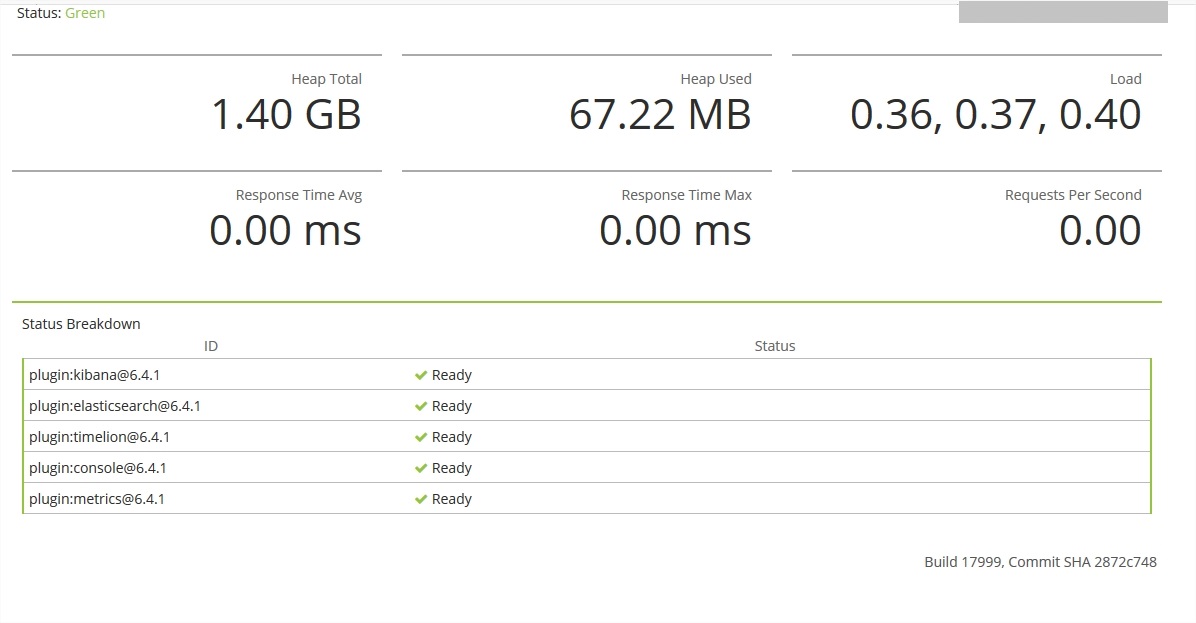
Kibana Status is OK.
Kibana is able to get all his configuration, visualizations and dashboard from Elastic. I can also use dev tools to launch a custom request to Elastic from Kibana without any problems.
But Kibana Discover, Visualise and Dashboard produce errors like :
There is no error in any logs (Elastic and Kibana).
Expected behavior:
No error, or explicit error in status or logs at least.
Screenshots (if relevant):


Errors in browser console (if relevant):
Provide logs and/or server output (if relevant):
There is no error in any logs (Elastic and Kibana).
Any additional context:
Kibana config :
Elastic config :
Thanks for your help !
The text was updated successfully, but these errors were encountered: