Skip to content
New issue

Have a question about this project? Sign up for a free GitHub account to open an issue and contact its maintainers and the community.

By clicking “Sign up for GitHub”, you agree to our terms of service and privacy statement. We’ll occasionally send you account related emails.

Already on GitHub? Sign in to your account

Multi query histogram shows incorrect data #191

Closed
nielsbasjes opened this issue Jun 28, 2013 · 7 comments · May be fixed by santosomar/kibana#48
Closed

Multi query histogram shows incorrect data #191

nielsbasjes opened this issue Jun 28, 2013 · 7 comments · May be fixed by santosomar/kibana#48

Comments

@nielsbasjes
Copy link

I loaded some old logfiles using logstah into elasticsearch and examined them using kibana 3.
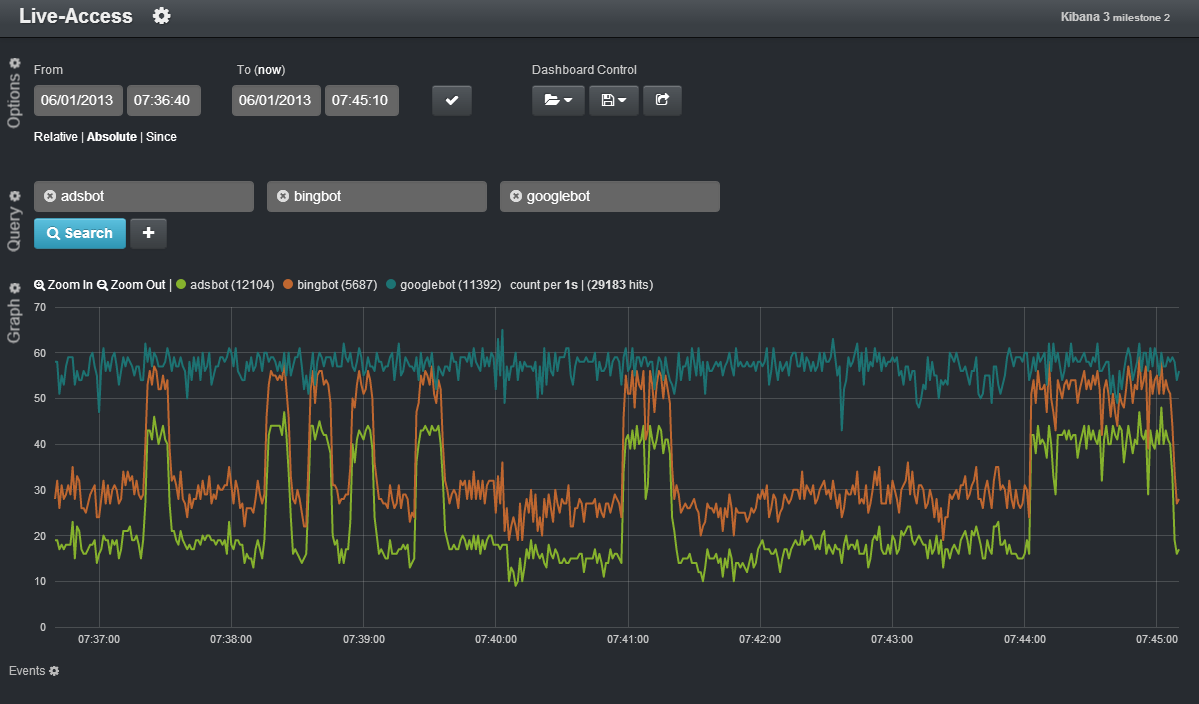
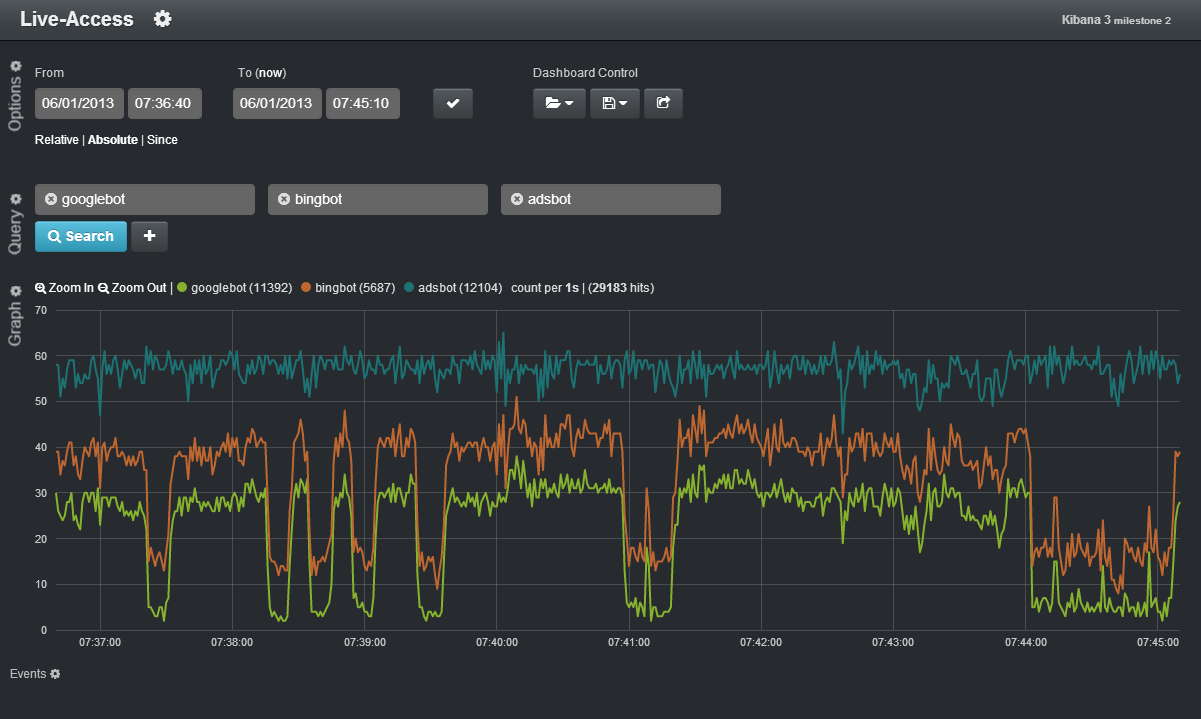
I found that sometimes I have a multi query chart and the numbers do not match the graph.
Even worse, when I click the search button the graph changes between two forms.
kibana3-multilines-1
kibana3-multilines-2

@nielsbasjes
Copy link
Author

Note that I switch between these two images by simply clicking the blue "Search" button.

@nielsbasjes
Copy link
Author

I did a save and a load of this dashboard to see how reproducable it is... VERY:
image
image

The save of the dashboard (can't seem to be able to attach a file):

{
"title": "Live-Access",
"rows": [
{
"title": "Options",
"height": "50px",
"editable": true,
"collapse": false,
"collapsable": true,
"panels": [
{
"loading": false,
"error": "",
"span": 5,
"editable": true,
"group": [
"default"
],
"type": "timepicker",
"mode": "absolute",
"time_options": [
"5m",
"15m",
"1h",
"6h",
"12h",
"24h",
"2d",
"5d",
"2w",
"4w"
],
"timespan": "4w",
"timefield": "@timestamp",
"index": "[live-access-]YYYY.MM.DD",
"defaultindex": "NOINDEX",
"index_interval": "day",
"refresh": {
"enable": true,
"interval": 30,
"min": 3
},
"status": "Stable",
"timeformat": "",
"time": {
"from": "06/01/2013 07:36:40",
"to": "06/01/2013 07:45:10"
}
},
{
"loading": false,
"error": false,
"span": 3,
"editable": true,
"group": [
"default"
],
"type": "dashcontrol",
"save": {
"gist": false,
"elasticsearch": true,
"local": true,
"default": true
},
"load": {
"gist": true,
"elasticsearch": true,
"local": true
},
"hide_control": false,
"elasticsearch_size": 20,
"elasticsearch_saveto": "kibana-int",
"temp": true,
"temp_ttl": "30d",
"status": "Stable"
}
]
},
{
"title": "Query",
"height": "50px",
"editable": true,
"collapse": false,
"collapsable": true,
"panels": [
{
"loading": false,
"error": false,
"span": 12,
"editable": true,
"group": [
"default"
],
"type": "stringquery",
"label": "Search",
"query": [
"googlebot",
"bingbot",
"adsbot"
],
"size": 100,
"sort": [
"_score",
"desc"
],
"multi": true,
"multi_arrange": "horizontal",
"status": "Stable",
"history": [
"googlebot",
"bingbot",
"adsbot",
"",
"@fields.cookies:"bnTrail"",
"NOT @fields.cookies:"bnTrail" AND @fields.agent:"\"Mozilla/5.0 (compatible; SpeelGoedkoperBot/0.1; http://speelgoedkoper.net/crawler/)\""",
"@fields.agent:"%bot"",
"@fields.agent:"*bot"",
"@fields.agent:"bot"",
"@fields.agent:"crawler" OR @fields.agent:"bot""
],
"remember": 10
}
]
},
{
"title": "Graph",
"height": "350px",
"editable": true,
"collapse": false,
"collapsable": true,
"panels": [
{
"loading": false,
"span": 12,
"editable": true,
"group": [
"default"
],
"type": "histogram",
"query": [
{
"query": "googlebot",
"label": "googlebot"
},
{
"query": "bingbot",
"label": "bingbot"
},
{
"query": "adsbot",
"label": "adsbot"
}
],
"interval": "1s",
"show": [
"points",
"lines",
"legend",
"x-axis",
"y-axis"
],
"timezone": "browser",
"spyable": true,
"zoomlinks": true,
"fill": 0,
"linewidth": 2,
"bars": false,
"stack": true,
"points": false,
"lines": true,
"legend": true,
"x-axis": true,
"y-axis": true,
"status": "Stable",
"mode": "count",
"value_field": null,
"auto_int": true,
"resolution": 1000,
"percentage": false,
"interactive": true
},
{
"loading": false,
"span": 0,
"editable": true,
"group": [
"default"
],
"type": "hits",
"query": [
{
"query": "googlebot",
"label": "googlebot"
},
{
"query": "bingbot",
"label": "bingbot"
},
{
"query": "adsbot",
"label": "adsbot"
}
],
"style": {
"font-size": "9pt"
},
"aggregate": false,
"arrangement": "horizontal",
"chart": true,
"counters": true,
"count_pos": "above",
"status": "Beta",
"counter_pos": "above",
"donut": false,
"tilt": false,
"labels": true
}
]
},
{
"title": "Events",
"height": "350px",
"editable": true,
"collapse": true,
"collapsable": true,
"panels": [
{
"loading": false,
"error": false,
"span": 2,
"editable": true,
"group": [
"default"
],
"type": "fields",
"style": {},
"arrange": "vertical",
"micropanel_position": "right",
"sort": [
"@timestamp",
"desc"
],
"query": "googlebot",
"status": "Beta"
},
{
"loading": false,
"error": false,
"span": 10,
"editable": true,
"group": [
"default"
],
"type": "table",
"query": "googlebot",
"interval": "1y",
"show": [
"bars",
"y-axis",
"x-axis",
"legend"
],
"fill": 3,
"overflow": "min-height",
"timezone": "browser",
"spyable": true,
"zoomlinks": true,
"size": 50,
"pages": 10,
"offset": 0,
"sort": [
"@timestamp",
"desc"
],
"style": {
"font-size": "9pt"
},
"fields": [
"@timestamp",
"@message"
],
"sortable": true,
"status": "Stable",
"highlight": [],
"header": true,
"paging": true
}
]
}
],
"editable": true,
"last": null
}

@brunorro
Copy link

brunorro commented Jul 5, 2013

Good morning!

Here I'm experiencing the very same problem, too.

kibana_multiquery_problem

After having a closer look at it, everytime I push the search button, even if I don't modify the query fields, the graph order showing them is modified: it swaps the last and the first query field. But it should only change the line (and shaded areas) instead of changing the graph the way it does.

Is there anything else I could provide to solve this problem ?

@nielsbasjes
Copy link
Author

I also see an important effect both you and I have: The actual lines of the graphs not only change color but they also change value in a VERY significant way. In your top graph and the left there is a line that is "almost 0" and in the bottom graph this is not the case.

@brunorro
Copy link

brunorro commented Jul 5, 2013

Of course, that was the first point :)

Anyway, I noticed that the problem is only the stacked graph. If you untick the "stack" option, the graph is quite the same everytime you search (but the swap between the last and the first query, which changes the colour of those entries)

It's not a real workaround (you are not getting what you want) but at least is a good thing to know...

@rashidkpc
Copy link
Contributor

Fixed in milestone pre3, queries are assigned colors that stick with them

@brunorro
Copy link

Thank you very much !

spalger pushed a commit to spalger/kibana that referenced this issue Mar 3, 2016
- Closes elastic#173 - Adding significant_terms to KB
- Closes elastic#172 - Adding percentiles to KB
- Closes elastic#171 - Adding cardinality agg to KB
- Closes elastic#176 - Removing custom_score and custom_boost_factor from query for 1.0
- Closes elastic#178 - Add script support to value_count agg
- Closes elastic#180 and Closes elastic#179 - Adding _cat/plugins and _cat/segments endpoints
- Closes elastic#191
harper-carroll pushed a commit to harper-carroll/kibana that referenced this issue Jul 11, 2016
w33ble added a commit to w33ble/kibana that referenced this issue Sep 13, 2018
* feat: add inline css style to font function

* fix: add 10 second inFlight timeout

this is pretty hacky, but it's good enough for now
Sign up for free to join this conversation on GitHub. Already have an account? Sign in to comment
Labels
None yet
Projects
None yet
Development

Successfully merging a pull request may close this issue.

3 participants