-
Notifications
You must be signed in to change notification settings - Fork 8.3k
New issue
Have a question about this project? Sign up for a free GitHub account to open an issue and contact its maintainers and the community.
By clicking “Sign up for GitHub”, you agree to our terms of service and privacy statement. We’ll occasionally send you account related emails.
Already on GitHub? Sign in to your account
[Alert details page] Show group information as source and in the chart title #155698
Comments
|
Pinging @elastic/actionable-observability (Team: Actionable Observability) |
|
To be planned as part of https://github.com/elastic/actionable-observability/issues/47 |
|
@maciejforcone Do we have a design for multiple groupBy fields information? I only see one groupBy field in the design. I was trying to show this information on the alert details page, and it looked like this in the current implementation: 
|
|
@maciejforcone Btw, we also have the field names related to each groupBy value, in case you want to show them in the page as well: |
@maryam-saeidi do we know how many "source" field/value sets we will display? For this specific example, I'd like to separate the tags part, into it's own section, and link to specific values (to host details in infra, etc). Clicking of Nag would send user to alerts view, with this tag set as a filter. Design file |
|
Pinging @elastic/obs-ux-management-team (Team:obs-ux-management) |
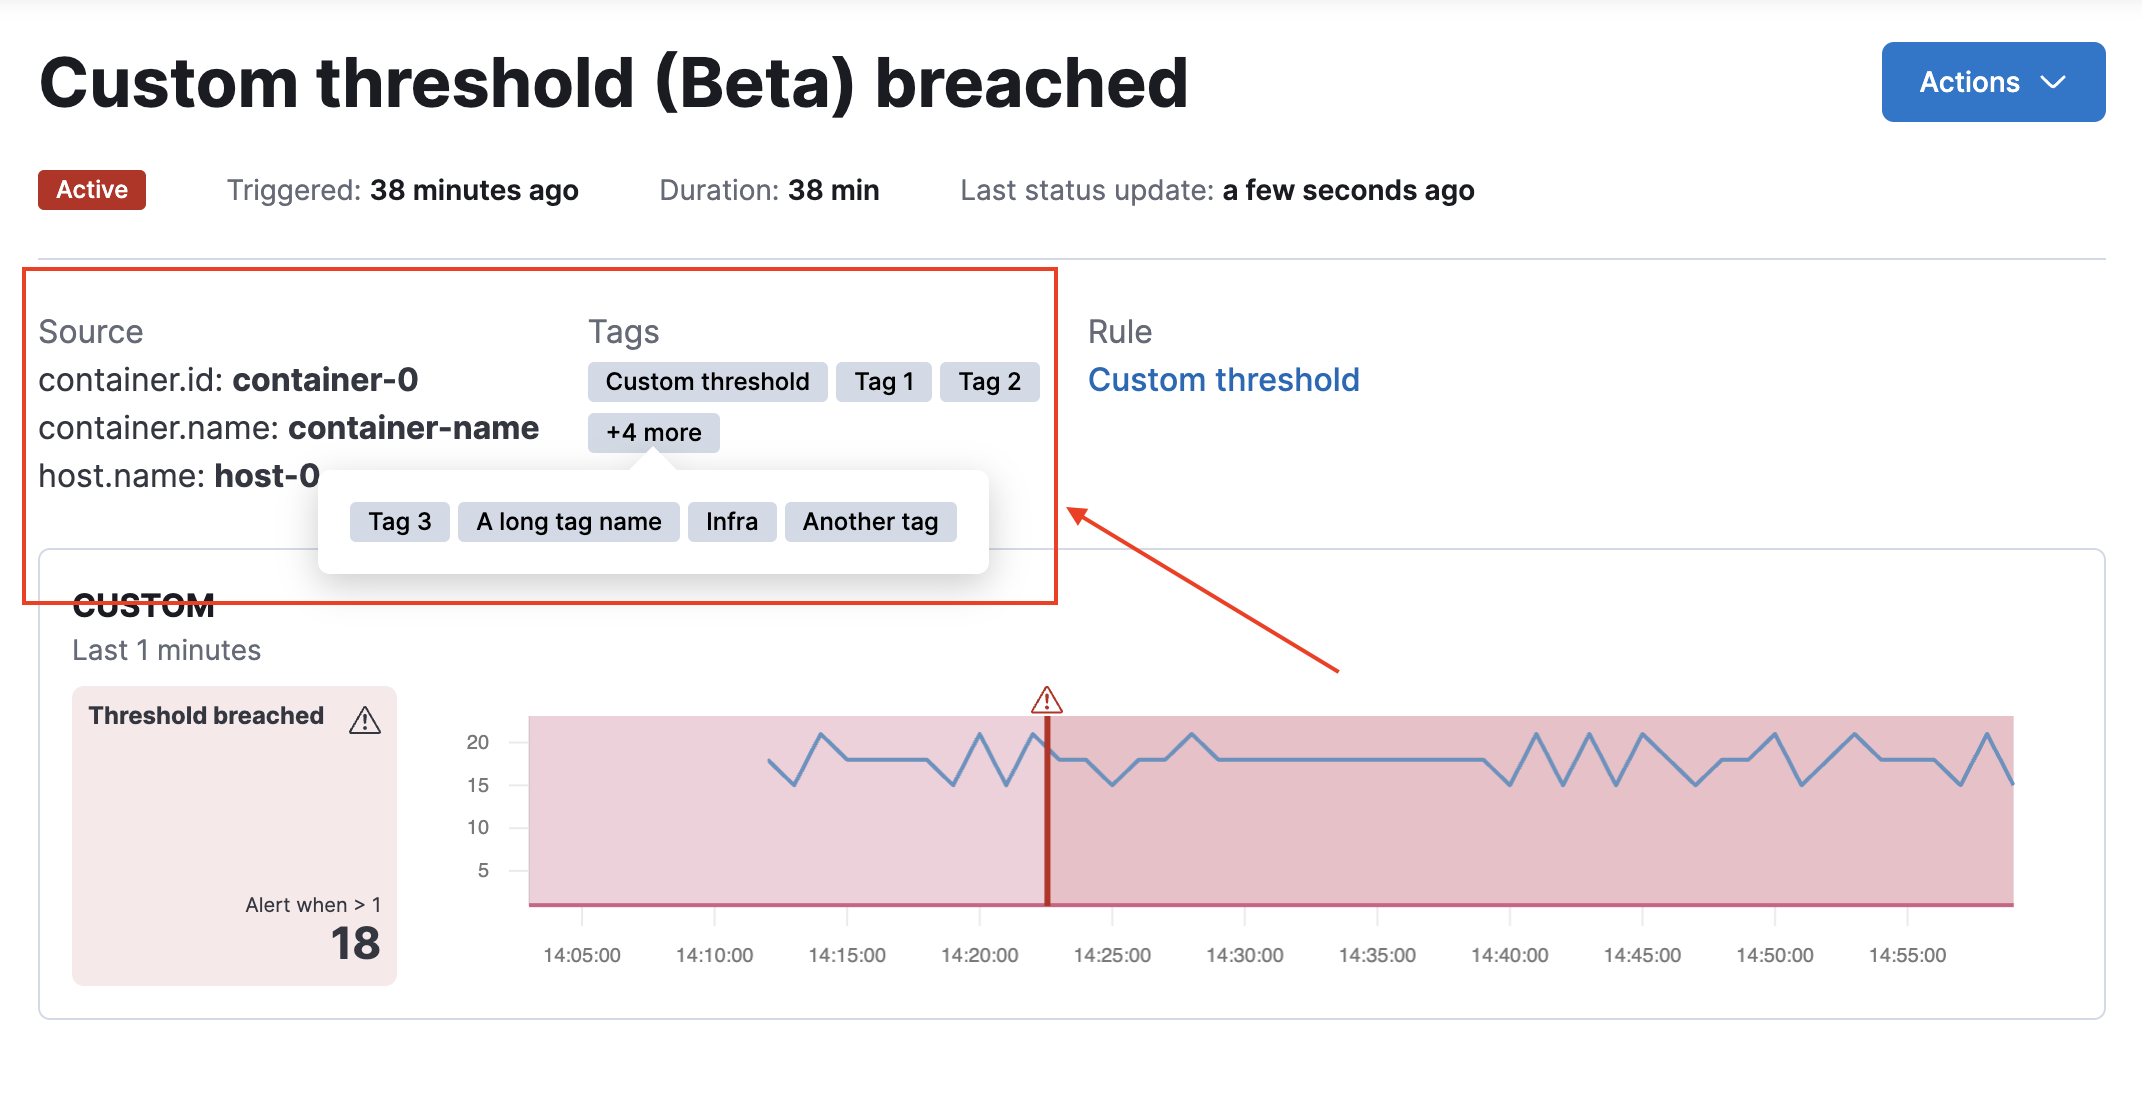
…o the alert details page summary (#174254) Closes #155698 Closes #174236 ## Summary This PR adds group and tag information to the alert details page summary fields for the custom threshold rule:  ## 🧪 How to test - Enable alert details page config ``` xpack.observability.unsafe.alertDetails.observability.enabled: true ``` - Create a custom threshold rule with a group by and add more than 3 rule tags - After the alert is fired, go to the alert details page (from alert flyout or menu action in the alert table); you should see the group by and tags information there.
…o the alert details page summary (elastic#174254) Closes elastic#155698 Closes elastic#174236 ## Summary This PR adds group and tag information to the alert details page summary fields for the custom threshold rule:  ## 🧪 How to test - Enable alert details page config ``` xpack.observability.unsafe.alertDetails.observability.enabled: true ``` - Create a custom threshold rule with a group by and add more than 3 rule tags - After the alert is fired, go to the alert details page (from alert flyout or menu action in the alert table); you should see the group by and tags information there.


📝 Summary
After adding metric threshold grouping information in #154126, we should show that information in both in source and chart title as shown in design:
✅ Acceptance Criteria
Show group information in the chart title--> Moved to [Alert details page][Custom threshold] Adjust main chart title #174249The text was updated successfully, but these errors were encountered: