-
Notifications
You must be signed in to change notification settings - Fork 0
Bayesian Approach
With a Bayesian approach, the results are consistent with an easily visualized model. Modifications and adjustments to the model are straightforward to make and don’t require re-evaluation of the entire code (as is typically required with hardcoded logic implementation).
EmbeddedAI implementation can be divided into the following steps:
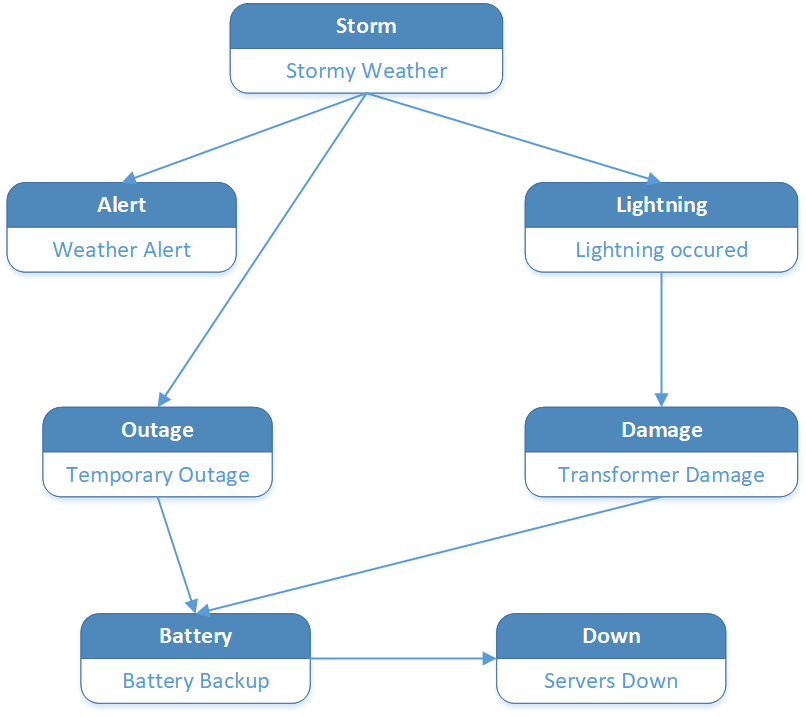
Find all variables that can define your system. These variables can define events that can occur in the system, the states of the system that are affected by these events, and the manifestations of these events and states that can be observed or measured. For example, an electrical backup system can have the following variables:
- Storm. Presence of a storm. Not directly observable (by the system)
- Lightning. Occurrence of lightning. Not directly observable
- Temporary Outage. Whether a temporary power outage occurred. Not directly observable
- Weather Alert. Weather alarm notifications. Directly observable (but not specific to lightning)
- Transformer Damage. Transformer receives physical damage - can have multiple causes. Not directly observable
- Battery Power. Battery backup became active. Directly observable
The links define causal dependencies. This should be a directed, acyclic graph.

In the scenario pictured above, Storm Weather can cause Lightning, and a Weather Alert is a consequence of Storm Weather.
A Temporary Outage can be caused by Storm Weather or other reasons -- that will be reflected by probability values in the next section.
Transformer Damage can be caused by Lightning or other factors -- these are also defined by probability table.
Battery Power due to being needed as a backup is a result of Power Outages as described in the diagram.
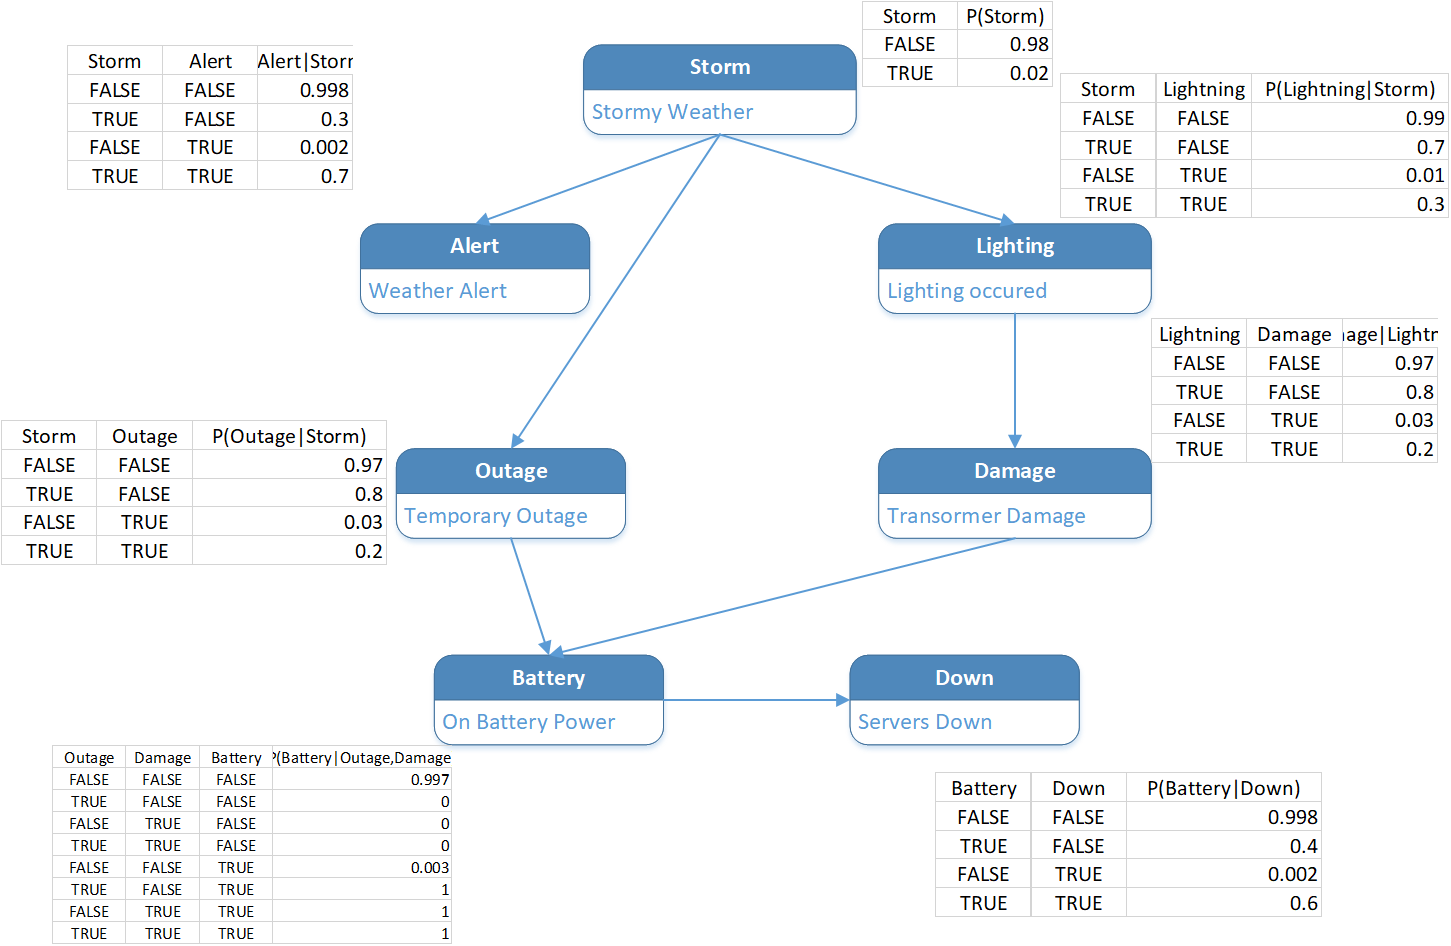
The image below combines the previous Bayesian Graph with probability factors.

The first-order variables that are not dependent on other nodes in a graph (such as Weather in this example) only need statistical probability. Other factors define conditional probabilities of their causes.
For example, the Alert variable is dependent on Weather. Notice that the probability factor for Alert allows for a non-zero probability of an Alert being issued even in good weather -- P(Alert=TRUE | Storm = FALSE) = 0.005. Also, Storm does not always cause an Alert to be issued -- P(Alert=FALSE | Storm = FALSE) = 0.1.
Similarly, the non-zero probabilities of Transformer Damage and Power Outage, even in absence of weather conditions, is reflected in the corresponding tables.
Observe that the rules of statistical arithmetic represented by the sum of all dependent variable probabilities values for each combination of causes always equals 1.0.
The sample is the set of variables that will be measured and applied to the graph. In our case those are Weather Alert and Battery Power. In some systems, different sets of variables can be measured in different inference runs. The same Bayesian Graph can still be used for such runs.
After the sample is applied, software can ask the Bayesian model certain questions. The following queries can be defined:
- Find the probability of a particular state/event or set of states/events. In this example the query could be --
"Find probability of Damaged Transformer"after sample"Weather Alert=TRUE, Battery Power=TRUE"was applied - Find the full state of the system that is most likely based on the sample read
- Find the Value of a single Variable of subset of Domain Variables that is most likely based on the sample read. In many cases, the answer to this question can differ from the one generated by only taking a fragment of the query results above
Intro
Getting Started
Walkthroughs