-
Notifications
You must be signed in to change notification settings - Fork 1
Using VHELIBS (EiFMM)
This is a basic tutorial on how to use VHELIBS.
VHELIBS only requires Java.If you do not have it already installed, install it from java.com or from your package manager (GNU/Linux)
Download the lastest version of VHELIBS from the downloads page. Save the jar file to the location you want VHELIBS installed (it needs no installation, it can be directly run from the jar file).
If you have Java properly installed and configured, you should be able to start VHELIBS by just double-clicking the jar file. Otherwise, try to open it with java. From the command-line it would be:
java -jar /path/where/VHELIBS/is/VHELIBS-VERSION.jar
And it should start (it will print some classloader errors, it is ok to ignore them). Now you should be presented with the windows below:
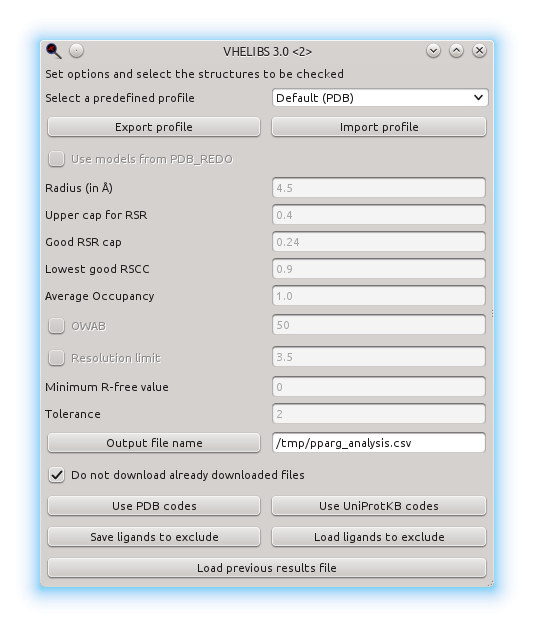
Here you will see an example of use of VHELIBS. In this example, we are going to choose human PPARg structures with well-modelled binding sites. In order to do so, we can set some values in the start window, but the default values are usually fine. VHELIBS labels ligands and residues based on a score and a tolerance for that score: the score starts at 0, and the higher the score, the less conditions are met (Good residues are those with a score of 0; Bad ones are those with a score over the tolerance, and those between are the Dubious ones). The values which can be adjusted are:
- Radius: residues within this distance of the ligand will be considered part of the binding site
- Upper cap for RSR: residues and ligands with an RSR over this value will increase their score.
- Good RSR cap: residues and ligands with an RSR over this value will have their score incremented. This is cumulative with the upper cap for RSR.
- Lowest Good RSCC: residues and ligands with a lower RSCC will see their score increased.
- Average [Occupancy] (http://spdbv.vital-it.ch/TheMolecularLevel/ModQual/#Occupancy (crystallography) ): Residues and ligands with an average occupancy below this value will have an increased score.
- OWAB (Occupancy-weighted [B-factor](http://spdbv.vital-it.ch/TheMolecularLevel/ModQual/#Temperature factor (crystallogr)): if used, residues and ligands exceeding this value will have their score increased.
- Resolution limit: if used, all models from data with a resolution over this value will have their score increased.
- Minimum [R-free](http://spdbv.vital-it.ch/TheMolecularLevel/ModQual/#Free R-factor (crystallography)) value: models with an R-free below the specified value will have their score increased.
- Tolerance: sets the maximum score for the Dubious residues/ligands. Higher scores will be labelled as Bad
- Output file name: where we want to save the results of the analysis. If the button is clicked, it can be chosen with a dialogue, otherwise its path can be manually entered. If no directory is specified (i.e. just a file name), the file will be saved to the current working directory.
All this values (except output file name) can be modified only when using the "Custom" profile. When selecting a different profile they will be shown, but the fields won't be enabled for editing. Choosing the "Custom" profile does not change any value from the fields, but enables edition in them. Custom profiles can be exported and imported using the corresponding buttons.
The button Load ligands to exclude and Save ligands to exclude are for managing ligand exclude lists, which is for users with special needs and can be seen more in depth here
Then we click the Use UniProtKB codes button and there we enter the code manually: PPARG_HUMAN

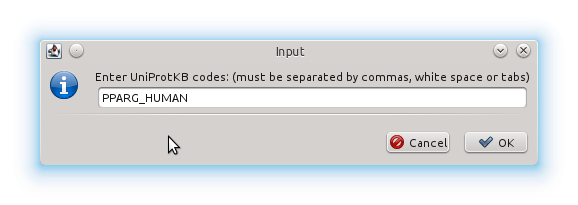
After providing VHELIBS with PDB or UniProtKB codes, it will start calculating the binding sites and to check their quality and that of their ligands. This process may take some time, depending on the number of structures to be analyzed, bandwidth and CPU performance.
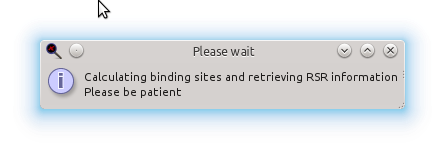
Instead of manually entering an UniProtKB code, we could also have entered PDB codes or provided a file containing a list of UniProtKB or PDB codes. Here is a sample file (sample_pdb_list.txt) with a list of 110 PDB codes. You can use it instead of entering "PPARG_HUMAN" in this tutorial with identical results, because the 110 PDB codes in the file are those that referenced by "PPARG_HUMAN". Although in this example all of the code reference to the same protein, it is not necessary; you can run VHELIBS over a list of PDB or UniprotKB codes referring to any number of different proteins without any limitation.
Once it has finished the analysis, the results are saved to the file we previously specified: pparg_analysis.csv. This file is in VHELIBS-CSV-format and can be optimally opened by any modern spreadsheet editor (such as Microsoft Excel or LibreOffice Calc).
But we also get this notification:
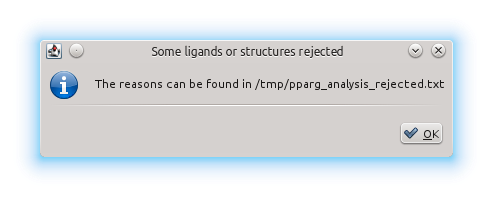
This means there have been some structures or ligands which have not been included in the results file for a variety of reasons. The list of rejected structures can be found in the same directory as the results file, with the same file name + "_rejected" and with .txt extension. Here's the rejections file from this example: pparg_analysis_rejected.txt. In this case, we can see that 8 structures where rejected because of lack of data at the EDS (most likely because of a lack of crystallographic data for those structures). Then we have a number of rejected ligands (and therefore rejected binding sites) in several structures for several different reasons:
- Blacklisted ligand: The ligand is in one of the exclude lists (like ZN, CL, SO4 and others) and is therefore rejected.
- Covalently bound to the sequence: this means that the ligand is closely bound to a residue of the protein or nucleic acid, and is therefore not considered a ligand anymore but part of the sequence. Note that even if a structure has rejected ligands, it may still have valid ligands and binding sites, which will be present in the results file.
Now that the automatic analysis is finished, we can pass to visualization and manual (re)classification of ligands and binding sites when needed. So the next dialogue asks for which structures to view:
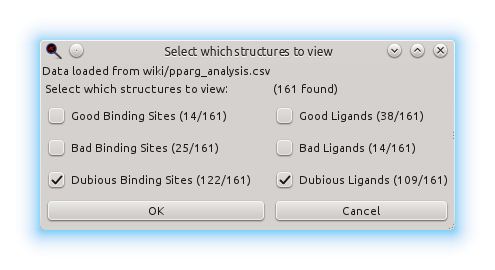
If no checkbox is marked or if the dialogue is cancelled, no structure will be viewed, but they can be viewed anytime later without repeating the automatic analysis by loading the results file through the starting dialogue (i.e., by choosing the Load previous results file button). If you check some of the options, the structures matching your choice will be shown, if any. So how does the combination of two of these options work? They are additive, that is, if you mark "Dubious ligand" and "Dubious binding site", any structure with a dubious ligand or a dubious binding site will be shown (it does not need to match all the criteria simultaneusly, it just needs to match one of them). In this case we leave it with the default choice ("Dubious ligand" and "Dubious binding site") and continue to visualization:
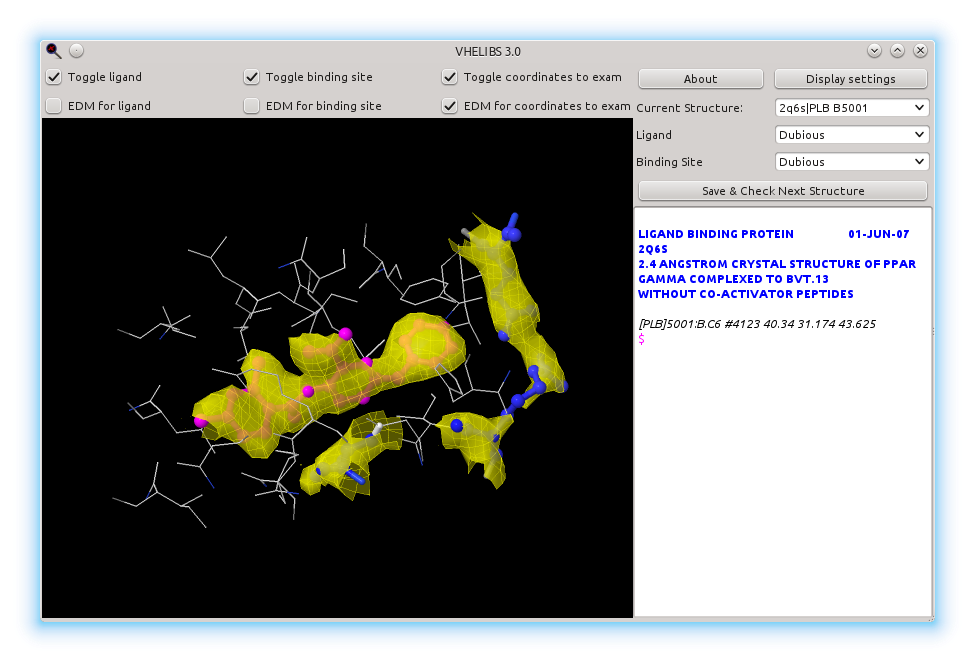
This is the main viewer window. In the left side we have a canvas where the ligand and the binding site are drawn, with their Electron Density Maps. Here are only shown the electron density maps for those residues and ligands labelled as "Dubious", but this can be changed checking and unchecking the options above the canvas.
In the right side of the window, we have three dropdown lists:
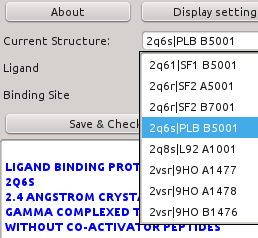
- Current Structure: Displays current structure id as "PDBID | HETID residue_number". It can be used to change from one structure to another one.
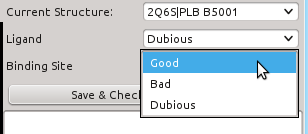
- "Ligand" and "Binding site": these two show how the ligand and the binding site are labelled, respectively. Through this lists one can change their label: if you see that a "Dubious" ligand is actually fitting well to its EDM, you can change it to "Good", or if it doesn't fit at all, change it to "Bad". The same applies to binding sites. If you need help considering a "Dubious" ligand as "Bad" or "Good".
Once you have finished assessing how well the ligand and the binding site fit to their electron Density Maps and you have relabelled them accordingly, you can click the button "Save & Check next Structure" to save your changes and load the next structure in the list. Where are these changes saved? They are saved to a file named after the results file used to load the structures, but with a suffix appended. In this case, the resulting file would be "pparg_analysis_checked.csv". This file includes all the information of the results file, but with your modifications to the labelling of the structures you reviewed. Here is the example checked results file: pparg_analysis_checked.csv
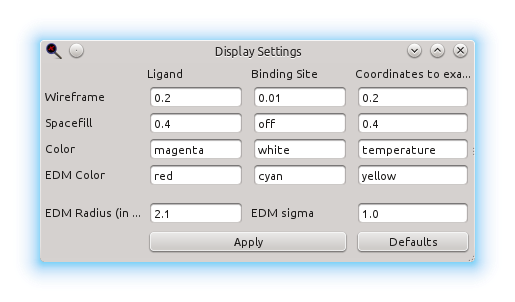
The appearance and rendering of the models and their Electron Density Maps can be customized through the Display Setting dialogue:
In the lower part of the right side of the window, there is a Jmol console for advanced scripting. It accepts all Jmol commands, which includes RasMol and Chime commands.
Most components of VHELIBS have contextual help explaining what are they for or what they do. However, if you still do not understand something or something seems to work unexpectedly, feel free to contact me at [email protected].
If you stumble upon a bug, find some unwanted or unexpected behaviour or have some suggestions, feel free to create and issue for it here. Although emailing me directly may seem more straightforward, by opening an issue you save time to any other user having your same issue, because that user will be able to see it and maybe apply a possible solution or workaround showed there, or know that it is being worked on.