Analysis Module Configuration
Welcome to the analysis module config page. Here you can learn how to add custom analysis modules. The property in resources.js that you will need to edit is analysisModules. It is an array of analysis module objects that describe the analysis and any UI elements that may need to accompany it.
MapBuilder analysis leverage endpoints in the GFW API for running analysis and also uses VEGA widgets stored in the API to render the analysis results. To do this, MapBuilder passes params to a VEGA widget which are then appended to the analysis url contained in the VEGA specification. For more information on how to configure VEGA widgets and for examples of existing widgets in MapBuilder please consult the MapBuilder Vega wiki.
For more information on how to post VEGA widgets for MapBuilder to the API consult the Resource Watch API documentation.
Every analysis included in the analysis module should include the following information:
| Fiele | Description |
|---|---|
| analysisId | Unqiue ID for the analysis |
| chartType | The type of VEGA chart, available options are "pie", "badge", "bar", and "line". For more information on available chart types please consult the Chart Types section of the wiki. |
| Label | Object containing a label for the analysis. You may configure the analysis to support multiple languages by listing multiple label key-attribute pairs. The label will be visible in the drop-down of your analysis. At a minimum, you must configure a label for the application's active language. |
| Title | Object containing a title for the analysis. You may configure the analysis to support multiple languages by listing multiple title key-attribute pairs. The title will be once you select an analysis from the drop down. At a minimum, you must configure a title for the application's active language. |
| Description | Object containing a description for the analysis. You may configure the analysis to support multiple languages by listing multiple title key-attribute pairs. The Description will be once you select an analysis from the drop down. At a minimum, you must configure a description for the application's active language. |
| useGfwWidget | Set to "true" to use a widget hosted in the GFW API. Since Vega is now the default for MapBuilder, all widgets should be stored in the GFW API. Thus, this property should always be set to true. |
| widgetId | The ID for your widget in the GFW API. |
| params | The params property is used to specify any static query params you want to pass along with the request to the VEGA widget. This property should be an array of objects. The objects should have two properties name and value. Please consult the params section of additional information on configuring params. |
| uiParams | The uiParms property is used to specify and query params which you want to let your users control. Currently, three types of uiParams are supported Range Slider, Datepicker, and Tree Cover Density. You may optionally choose to allow a user to select param values before running the analysis. Note: This is not required. If you don't need/want to use uiParams you will need to add "uiParams": "none" to your configuration. Please consult the UI Params section of additional information on configuring params. |
This is an example of a module that you may configure with no UI elements or parameters.
analysisModules = [
...,
{
"analysisId": "NEW_ANALYSIS_MODULE",
"chartType": "badge",
"label": {
"en": "New Analysis Module"
},
"title" : {
"en": "New Analysis Module"
},
"description" : {
"en": "Description for New Analysis Module"
},
"useGfwWidget": true,
"widgetId": "95c2c559-ca78-4b7a-b18b-7b2bca14ce83",
"uiParams": "none"
}
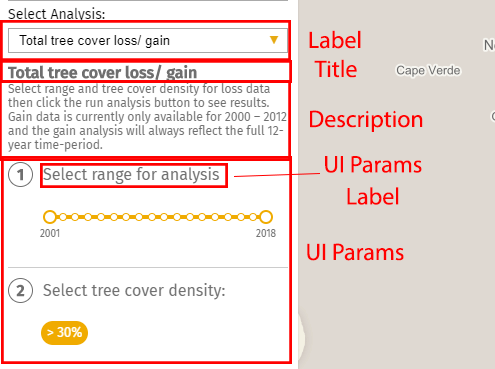
]This is an example of the analysis Module used for the GFW Tree Cover Loss Analysis. The analysis includes two UI Params. One is a "rangeSlider" and lets the user select the time period for analysis. The other is type "tcd"and lets the user select a tree cover density threshold for the analysis.
{
			"analysisId": "TC_LOSS_GAIN",
			"chartType": "badge",
			"label": {
				"en": "Total tree cover loss/ gain",
				"fr": "Perte/gain total de la couverture arborée",
				"es": "Pérdida/ganancia de cobertura arbórea total",
				"pt": "Perda/ganho total de cobertura arbórea",
				"id": "Total kehilangan/perolehan tutupan pohon",
				"zh": "总森林覆盖减少/增加面积量",
				"ka": "ხის ვარჯის საერთო კარგვა / მატება"
			},
			"title": {
				"en": "Total tree cover loss/ gain",
				"fr": "Perte/gain total de la couverture arborée",
				"es": "Pérdida/ganancia de cobertura arbórea total",
				"pt": "Perda/ganho total de cobertura arbórea",
				"id": "Total kehilangan/perolehan tutupan pohon ",
				"zh": "总森林覆盖减少/增加面积量",
				"ka": "ხის ვარჯის საერთო კარგვა / მატება"
			},
			"description": {
				"en": "Select range and tree cover density for loss data then click the run analysis button to see results. Gain data is currently only available for 2000 – 2012 and the gain analysis will always reflect the full 12-year time-period.",
				"fr": "Sélectionner la plage et la densité de couverture arborée pour les données de perte, puis cliquer sur le bouton « lancer l’analyse » pour voir les résultats. Les données de gain ne sont actuellement disponibles que pour 2000 – 2012 et l’analyse de gain reflétera toujours la plage de 12 ans entière.",
				"es": "Para obtener los datos sobre pérdida, seleccione el rango y la densidad de la cobertura arbórea, después haga clic en el botón ejecutar análisis para ver los resultados. Los datos sobre ganancia actualmente solo están disponibles para los años 2000 a 2012 y el análisis de la ganancia siempre reflejará el periodo de 12 años completo.",
				"pt": "Selecione o período e a densidade de cobertura arbórea para dados de perda; em seguida, clique no botão para executar a análise e ver os resultados. Os dados de ganho estão disponíveis atualmente apenas para o período 2000 – 2012 e a análise de ganho sempre refletirá o período completo de 12 anos.",
				"id": "Pilih rentang dan kerapatan tutupan pohon untuk data yang hilang, kemudian klik tombol mulai analisis untuk melihat hasilnya. Data perolehan saat ini hanya tersedia untuk periode 2000 – 2012 dan analisis perolehan akan selalu mencerminkan periode waktu 12 tahun penuh.",
				"zh": "选择要考察减少量数据的范围和森林覆盖密度,然后点击“运行分析”按钮查看结果。目前仅有 2000 – 2012 年的增加量数据,增加分析始终反映这 12 年的完整情况。",
				"ka": "შეარჩიეთ საზღვრები და ხის ვარჯის სიხშირე კარგვის მონაცემებისთვის, შემდეგ დააჭირეთ ღილაკს ანალიზის  ჩატარება შედეგების სანახავად. მატების მონაცემები ამჟამად ხელმისაწვდომია 2000-2012 წლებისთვის და მატების ანალიზი ყოველთვის ასახავს სრულ 12-წლიან დროის პერიოდს."
			},
			"useGfwWidget": true,
			"widgetId": "95c2c559-ca78-4b7a-b18b-7b2bca14ce83",
			"uiParams": [{
				"inputType": "rangeSlider",
				"startParamName": "period",
				"combineParams": true,
				"valueSeparator": ",",
				"bounds": [2001,
				2018],
				"valueType": "date",
				"label": {
					"en": "Select range for analysis:",
					"fr": "Sélectionner une plage pour l’analyse:",
					"es": "Seleccione un rango para el análisis:",
					"pt": "Selecione o período para análise:",
					"id": "Pilih rentang untuk analisis:",
					"zh": "选择分析范围:",
					"ka": "საზღვრების შერჩევა ანალიზისთვის:"
				}
			},
			{
				"name": "thresh",
				"inputType": "tcd",
				"label": {
					"en": "Select tree cover density: ",
					"fr": "Sélectionner la densité de couverture arborée: ",
					"es": "Seleccione la densidad de la cobertura arbórea: ",
					"pt": "Selecione a densidade de cobertura arbórea: ",
					"id": "Pilih kerapatan tutupan pohon: ",
					"zh": "选择森林覆盖密度: ",
					"ka": "ხის ვარჯის სიხშირის შერჩევა: "
				}
			}]
		}
The screenshot below shows an example of what the Analysis Module will look like to your users.
For information on how to set up your Vega Chart GFW Widget, see GFW Widget
For information on the supported chartTypes, see Chart Types wiki page.
If you would like to add parameters see the Params wiki page.
If you would like one of your api endpoint parameters to be configured by the user see the UI Params wiki page.