Determine stellar masses by fitting MIST stellar evolution models to observed atmospheric parameters. Uses the Markov chain Monte Carlo method as implemented in EMCEE.
The simplest way to install EMCMASS is using pip from the terminal. This will install EMCMASS in the local folder.
pip install git+https://github.com/vosjo/emcmass.git#egg=emcmass
To uninstall EMCMASS, run:
pip uninstall emcmass
EMCMASS will fit theoretical evolution models to observed atmospheric parameters as effective temperature, surface gravity, radius, luminosity and metallicity. The best fitting model will determine the mass and potentially the age of the observed star.
EMCMASS can be used directly from the command line. The most basic use only supplies the observables with their errors and uses the default settings of the MCMC algorithm. In the case below we use emcmass to determine the mass of the sun:
emcmass Teff 5778 250 log_g 4.43 0.25 R 1.0 0.5 L 1.0 0.5 M_H 0.0 0.05
The output of this process will look like this:
================================================================================
                                   EMCMASS
================================================================================

Stellar evolution models:  mist

Limits applied to the model grid parameters:
   mass_init = 0.1 -> 5.0
   M_H_init = -1.5 -> 0.5
   phase = 0 -> 400

Observables included in fit:
   log_Teff = 3.7617775375081783 +- 0.01879067151263413
   log_g = 4.43 +- 0.25
   log_R = 0.0 +- 0.217145
   log_L = 0.0 +- 0.217145
   M_H = 0.0 +- 0.05

MCMC setup:
   # walkers: 100
   # steps: 1000
   # a: 2
================================================================================
New limits to match up with grid points:
[(0.1, 5.0), (-1.5, 0.5), (0.0, 400.0)]
100%|████████████████████████████████████████████████████████████| 1100/1100 [00:14<00:00, 73.50it/s]
================================================================================

Resulting parameters values and errors:
   Par          Best    Pc      emin     emax
   mass_init  = 1.000   1.015   -0.077   +0.073
   M_H_init   = 0.047   0.042   -0.058   +0.056
   phase      = 192.465   180.403   -74.394   +65.995
Not surprisingly the best fitting model has a mass of 1 Msol. You may have notices that EMCMASS automatically takes the logarithm of the observables. This is because the MIST models provide only the logarithm of these variables. EMCMASS can recognize the following observables:
- Teff, log_Teff
- g, log_g
- R, log_R
- L, log_L
- M_H ([M/H] usually equivalent with [Fe/H])
More options can be seen with the help command:
emcmass -h
Writing all parameters on the command line can be cumbersome. Therefore EMCASS provides an option to use an input file containing all parameters and the requested setup. This file has to follow the 'yaml' format. A default file can be created with the '-empty' option:
emcmass -empty test_star
will create an yaml file with the default setup named 'test_star.yaml'
The format of such an input file is the following:
# parameters of the evolution models to fit
parameters: [mass_init, M_H_init, phase]
# limits that you want to apply to the parameters (same order as parameters)
limits:
- [0.1, 2.0]
- [-1.5, 0.5]
- [100, 400]
# Observables name: [value, error]
observables:
  Teff: [5778, 250]
  L: [1.0, 0.05]
  R: [1.0, 0.05]
  log_g: [4.43, 0.25]
  M_H: [0.0, 0.05]
# The name of the evolution model to use (only mist is supported for now)
model: mist
# setup for the MCMC algorithm
nwalkers: 100    # total number of walkers
nsteps: 2000     # steps taken by each walker (not including burn-in)
nrelax: 500      # burn-in steps taken by each walker
a: 10            # relative size of the steps taken
# set the percentiles for the error determination
percentiles: [16, 50, 84] # 16 - 84 corresponds to 1 sigma
# output options
datafile: none   # filepath to write results of all walkers
plot1:
 type: fit
 path: test_star_fit.png
plot2:
 type: distribution
 path: test_star_distribution.png
 parameters: ['mass_init', 'phase', 'M_H_init']
plot3:
 type: HR
 path: test_star_HR.png
This file can be used as input for emcmass with the '-f' option
emcmass -f test_star.yaml
The main output of EMCMASS is of course the best fitting mass and its error. But EMCMASS can produce several figures that can help with the interpretation of the results. When using the command line option, you can add the '--plot' flag to get the three possible figures. When using the input file option, you can specify which figures you want in the plot part of the input file. The three possible figures are:
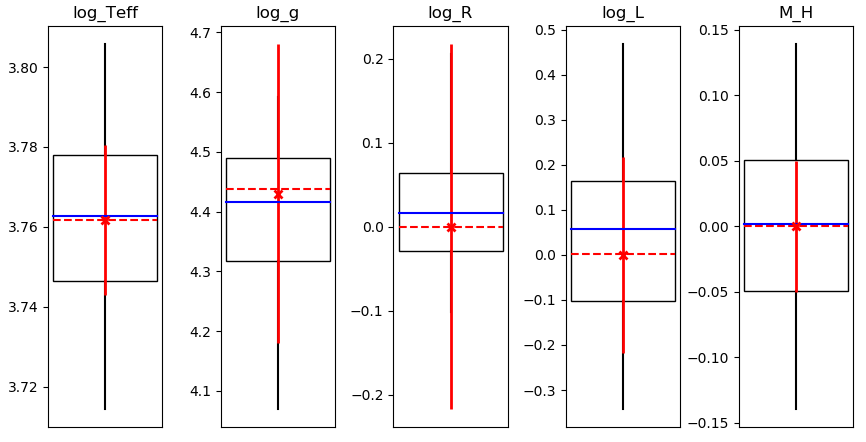
- The 'fit' image, which shows for each observable how it compares to the samples in the MCMC process.
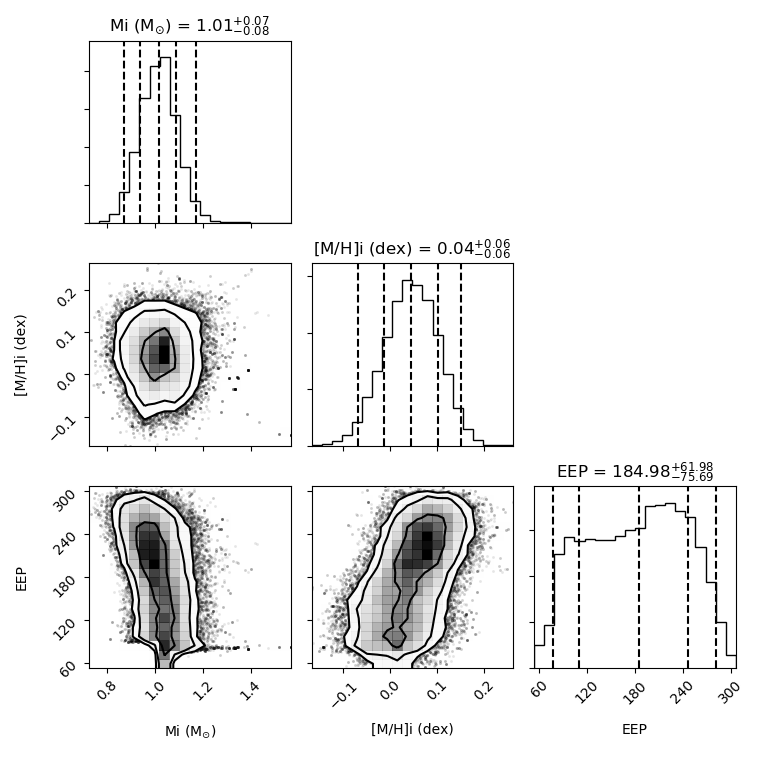
- The distribution plot shows the location of all samples of the MCMC process for the 3 included parameters, as well as the distribution for each parameter individually with the 1 and 3 sigma confidence levels indicated on the plot. Requires the corner package.
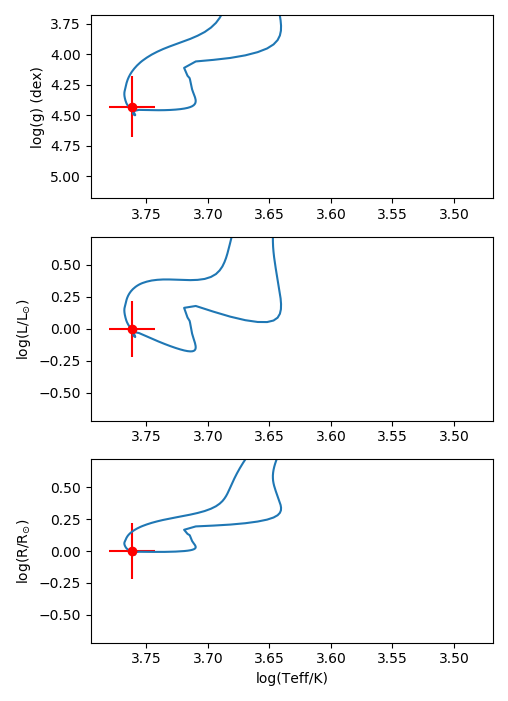
- The observations with the best fitting model in the HR diagram


