-
Notifications
You must be signed in to change notification settings - Fork 84
uBlock vs. ABP: efficiency compared
Note: The data presented in this page were collated in 2015, so they shouldn't be considered up to date (the section Added memory footprint to web pages is still relevant though).
The code base of all content blockers have undergone significant changes since then. Still, in recent benchmarks, uBO still comes out as the most efficient memory- and CPU-wise when compared to content blockers with similar set of features and capabilities.
Here is a quick illustrated comparison of efficiency using various angles. Each extension was tested alone, with no other extensions enabled. Benchmarks were performed on Linux Mint 64-bit using Chromium.
- Own memory footprint
- Added CPU overhead to each net request
- Added memory footprint to web pages
- Added CPU overhead to web pages
These screenshots show the memory footprint of Adblock Plus (ABP) and uBlock Origin (uBO) after they have gone through this demanding benchmark. Once benchmarking was complete, I forced the browser to garbage collect the memory in each extension by clicking the trash icon (in the dev console) a couple of times. (This is an important step, or else the shown memory footprint is not too reliable.)
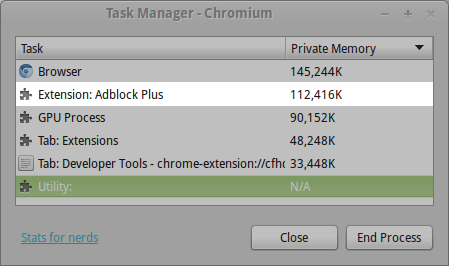
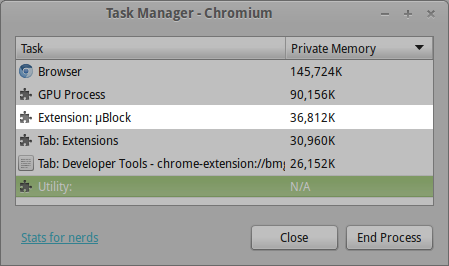
Both extensions had EasyList, EasyPrivacy, Peter Lowe's Ad Server list, and malware protection (there are more filters in uBO for this last one).
Last updated on: 30 January 2015.
ABP and uBO need to evaluate the URL of each net request against their dictionary of filters and tell the waiting browser to cancel it or not. Since the browser is waiting for an answer, this is a time-critical part, and determining whether to allow the request must be done immediately.
Below is the average time for each extension to handle a net request in their respective chrome.webRequest.onBeforeRequest handler, using the same benchmark.
ABP> onBeforeRequest: 0.425 ms (9141 samples)
ABP> onBeforeRequest: 0.423 ms (9230 samples)
ABP> onBeforeRequest: 0.423 ms (9233 samples)
ABP> onBeforeRequest: 0.423 ms (9310 samples)
ABP> onBeforeRequest: 0.423 ms (9390 samples)
ABP> onBeforeRequest: 0.423 ms (9477 samples)
ABP> onBeforeRequest: 0.423 ms (9524 samples)
ABP> onBeforeRequest: 0.422 ms (9687 samples)
ABP> onBeforeRequest: 0.421 ms (9704 samples)
ABP> onBeforeRequest: 0.421 ms (9861 samples)
uBO> onBeforeRequest: 0.131 ms (8664 samples)
uBO> onBeforeRequest: 0.131 ms (8763 samples)
uBO> onBeforeRequest: 0.131 ms (8839 samples)
uBO> onBeforeRequest: 0.130 ms (8914 samples)
uBO> onBeforeRequest: 0.131 ms (8988 samples)
uBO> onBeforeRequest: 0.131 ms (9033 samples)
uBO> onBeforeRequest: 0.130 ms (9192 samples)
uBO> onBeforeRequest: 0.130 ms (9206 samples)
uBO> onBeforeRequest: 0.129 ms (9324 samples)
uBO> onBeforeRequest: 0.129 ms (9329 samples)
Note that the results above are the tail end of running the reference benchmark, except wait set to 15 and repeat set to 1. ABP and uBO both use EasyList, EasyPrivacy, "Peter Lowe’s Ad server list" and "Malware domains". ABP-specific: "Acceptable ads" disabled. uBO-specific: default settings.
The results depend heavily on the processor: I benchmarked on an i5-3xxxK CPU @ 3.4 GHz x 4.
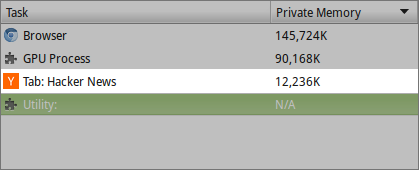
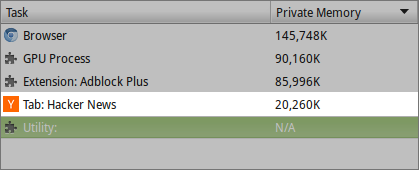
Extensions have their memory footprint, but they also cause an increased memory footprint in web pages. Below you can see the added memory footprint in a simple web page like Hacker News. The first screenshot is when there is no extension used. Therefore, consider it as the reference memory footprint for this web page. Other screenshots show the increased memory footprint caused by each one. The browser was idle after loading the page to allow the garbage collector to kick in.
No extension:
ABP:
uBO:
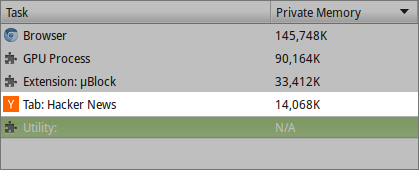
Now keep in mind this is the added footprint for a simple web page that has no embedded frames. You can multiply the added footprint on the main page by the number of frames embedded, so pages with frames can consume a lot more memory than they would have otherwise. For instance, a simple web page with a couple of iframe in it, The Acid3 Test:

Added memory footprint: Left = no extension. Middle = ABP. Right = uBO.
A good stress test that demonstrates this is the infamous vim test.
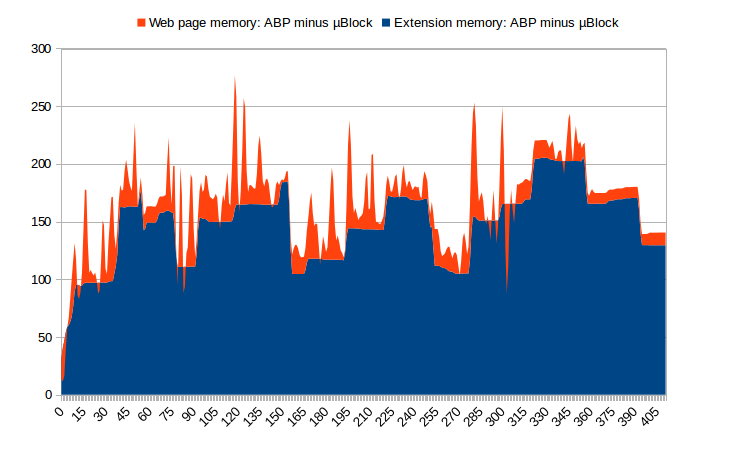
The above picture shows how much more memory ABP consumes over uBO. It represents the extra memory ABP consumes relative to uBO, so, essentially, uBO is the horizontal axis. If memory consumption of ABP and uBO were the same, there would be no graph. The reference benchmark, consisting of visiting 60 front pages of high-traffic websites, was used.
The vertical axis represents MB. The horizontal axis is time in seconds. Data extraction occurred from this video. (Consider the video to be the raw data. Here is the spreadsheet so people in doubt can double-check).
The blue area represents how much more memory ABP consumes than uBO. The orange area depicts how much more ABP causes the web pages to consume more memory. ABP systematically causes web pages to consume more memory, and often quite a lot, north of 100 MB for some sites. This kind of added short-term memory overhead is not cheap, as it also means the CPU is working harder.
Here is the benchmark comparing CPU usage in the background page when loading si.com ten times (so you can shift one decimal to the left for per page figures). Each page load was triggered after the last completed.
Top: ABP 1.8.3. Bottom: uBO 0.5.1.0.
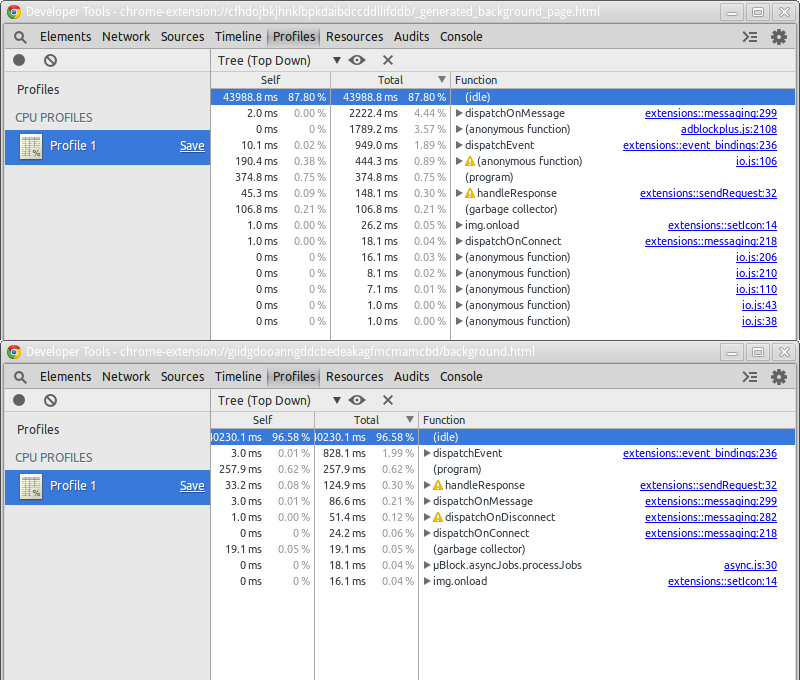
Note: I measured CPU usage for content scripts, but any information was drowned in a sea of noise because the web page used for the benchmark is quite bloated. But the fact that ABP inserts 14,000+ CSS rules caused the CPU to use much more than uBO (2-3 to 1 ratio) when comparing content script CPU usage (again, above is background page CPU usage).
Also, the amount of work uBO does in its content scripts is proportional to the complexity of a web page. Although uBO did much better CPU-wise than ABP in its content script for such a bloated website, this was a worst-case scenario for uBO, and yet it did its job of hiding elements between 2 and 3 times faster.
uBlock Origin - An efficient blocker for Chromium and Firefox. Fast and lean.
- Wiki home
- About the Wiki documentation
- Permissions
- Privacy policy
- Info:
- The toolbar icon
- The popup user interface
- The context menu
-
Dashboard
- Settings pane
- Filter lists pane
- My filters pane
- My rules pane
- Trusted sites pane
- Support
- Keyboard shortcuts
- The logger
- Element picker
- Element zapper
-
Blocking mode
- Very easy mode
- Easy mode (default)
- Medium mode (optimal for advanced users)
- Hard mode
- Nightmare mode
- Strict blocking
- Few words about re-design of uBO's user interface
- Reference answers to various topics seen in the wild
- Overview of uBlock's network filtering engine
- uBlock's blocking and protection effectiveness:
- uBlock's resource usage and efficiency:
- Memory footprint: what happens inside uBlock after installation
- uBlock vs. ABP: efficiency compared
- Counterpoint: Who cares about efficiency, I have 8 GB RAM and|or a quad core CPU
- Debunking "uBlock Origin is less efficient than Adguard" claims
- Myth: uBlock consumes over 80MB
- Myth: uBlock is just slightly less resource intensive than Adblock Plus
- Myth: uBlock consumes several or several dozen GB of RAM
- Various videos showing side by side comparison of the load speed of complex sites
- Own memory usage: benchmarks over time
- Contributed memory usage: benchmarks over time
- Can uBO crash a browser?
- Tools, tests
- Deploying uBlock Origin
- Proposal for integration/unit testing
- uBlock Origin Core (Node.js):
- Troubleshooting:
- Good external guides:
- Scientific papers