GraphiteMRCounterExecutor
graphite-mr-counter is all about pushing your (already available) map-reduce counters into
graphite for each of your coordinator runs.
So lets say you have a coordinator executing a workflow every six hours ? And you want some nice charts from stuff like number of input records, bytes read from HDFS or even your own custom counters from these executions ? Charts that get updated on reruns ?
That's exactly what graphite-mr-counter was made for :-) .
See HowToInstallOozieGraphite.
So lets dive into the usage pattern:
Lets start with the your coordinator. Theres nothing special about it, but you need to make sure that you pass the nominal time into your workflow (but you most certainly already do so).
#!xml
<!--
	note the frequency (2 hours) ... you need to align your carbon configuration with this
-->
<coordinator-app frequency="${coord:hours(2)}" ....>


	<action>
		<workflow>
			<app-path>...</app-path>
			<configuration>
				...
				<!-- pass the nominal time into your workflow -->
                <property>
                    <name>nominalTime</name>
                    <value>${coord:nominalTime()}</value>
                </property>
				....
			</configuration>
		</workflow>
	</action>
</coordinator-app>
Insert a new action (graphite-mr-counter) after your mr-job action.
You need to provide the obvious graphite configuration (graphite-hostname, graphite-port and graphite-transport (TCP/UDP)),
nominal-time (set by the coordinator) and the metrics-path-prefix to use.
Then configure as many counter elements as you need to configure your metrics. Because of the group+name counter hierarchy , you need
one counter element for every counter group you want to access. Each counter element must contain an source element and you must
utilize the (oozie-)internal EL function hadoop:counters (click here for more info)
to access your map-reduce counters and then pick one group by using ['GroupName']. Be aware that you need to use the internal group names, not the names you see on the job tracker's web UI (see comments in the workflow).
You may add multiple elements. Use these mapping elements if you do not want to add all available counters or if you need to rename / regroup your metrics.
#!xml

<?xml version="1.1" encoding="UTF-8"?>
<workflow-app xmlns="uri:oozie:workflow:0.2" ....>

	<start to="mr-job" />

	<action name="mr-job">
		<map-reduce>
			<job-tracker>${jobTracker}</job-tracker>
			<name-node>${nameNode}</name-node>
			<configuration>
			....
			</configuration>
		</map-reduce>
		<ok to="graphite-transmit" />
		<error to="fail" />
	</action>

 <action name="graphite-transmit">
	<graphite-mr-counter
		xmlns="uri:oozie:graphite-mr-counter-action:1.0"
		graphite-host="graphite.your.org"
		graphite-transport="TCP"
		graphite-port="2003"
		metrics-path-prefix="oozie.bundle-xyz.coordinator-name"
		nominal-time="${nominalTime}">
		<counter>
		<!--
		make sure to use the internal counter group name
		(i.e. org.apache.hadoop.mapred.Task$Counter (old api)
		or org.apache.hadoop.mapreduce.TaskCounter (new api) for the group
		labeled "Map-Reduce Framework" in the job tracker's web ui
		-->
			<source>${hadoop:counters('mr-job')['org.apache.hadoop.mapred.Task$Counter']}</source>
			<!-- this mapping will add a prefix ("mr_framework.") to all counters -->
				<mapping matches="(.*)" rename-to="mr_framework.$1" />
		</counter>

		<counter>
			<source>${hadoop:counters('mr-job')['org.apache.hadoop.mapred.JobInProgress$Counter']}</source>
			<!-- this mapping will add a prefix ("job.") to all counters -->
				<mapping matches="(.*)" rename-to="job.$1" />
		</counter>
		<counter>
			<source>${hadoop:counters('mr-job')['FileSystemCounters']}</source>
			<!-- this mapping will add a prefix ("file_system.") to all counters -->
				<mapping matches="(.*)" rename-to="file_system.$1" />
		</counter>
		<counter>
			<source>${hadoop:counters('mr-job')['YourCustomGroupOne']}</source>
				<!-- grab only a subgroup of counters and only a part of their names and apply a prefix -->
				<mapping matches="INPUT_RECORD_TYPES_(.*)" rename-to="inputRecordsByType.$1" />
				<!-- static rename of a single counter -->
				<mapping matches="PARSE_EXCEPTIONS" rename-to="errors.parseExceptions" />
		</counter>
		<counter>
			<source>${hadoop:counters('mr-job')['YourCustomGroupTwo']}</source>
			<!-- without any explicit mapping all available counters within this group are transformed into metrics -->
		</counter>
	</graphite-mr-counter>

        <ok to="end" />
        <error to="fail" />
    </action>

	<kill name="fail">
		<message>workflow failed</message>
	</kill>
	<end name="end" />

</workflow-app>
Edit carbon's local_storage.conf file to match your coordinators frequency (and don't forget to restart carbon afterwards).
Note: Dont use multiple retention policies, simply use the coordinator frequency for the whole timeframe you want to monitor.
[oozie-bundle-xy]
pattern = oozie.bundle-xyz.coordinator-name.*
retentions = 2h:180d
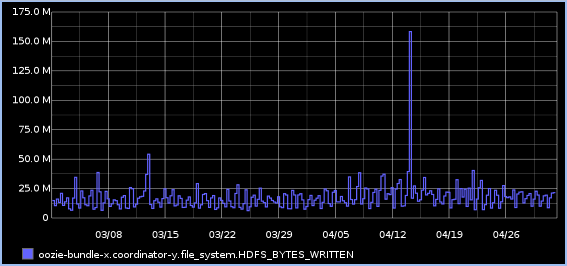
You are all set ... submit your coordinator / bundle and watch your metrics floating into graphite.
- Blog post on syscrest.com : Installing GraphiteMRCounterExecutor
- Blog post on syscrest.com : Tapping into hadoop counters with GraphiteMRCounterExecutor