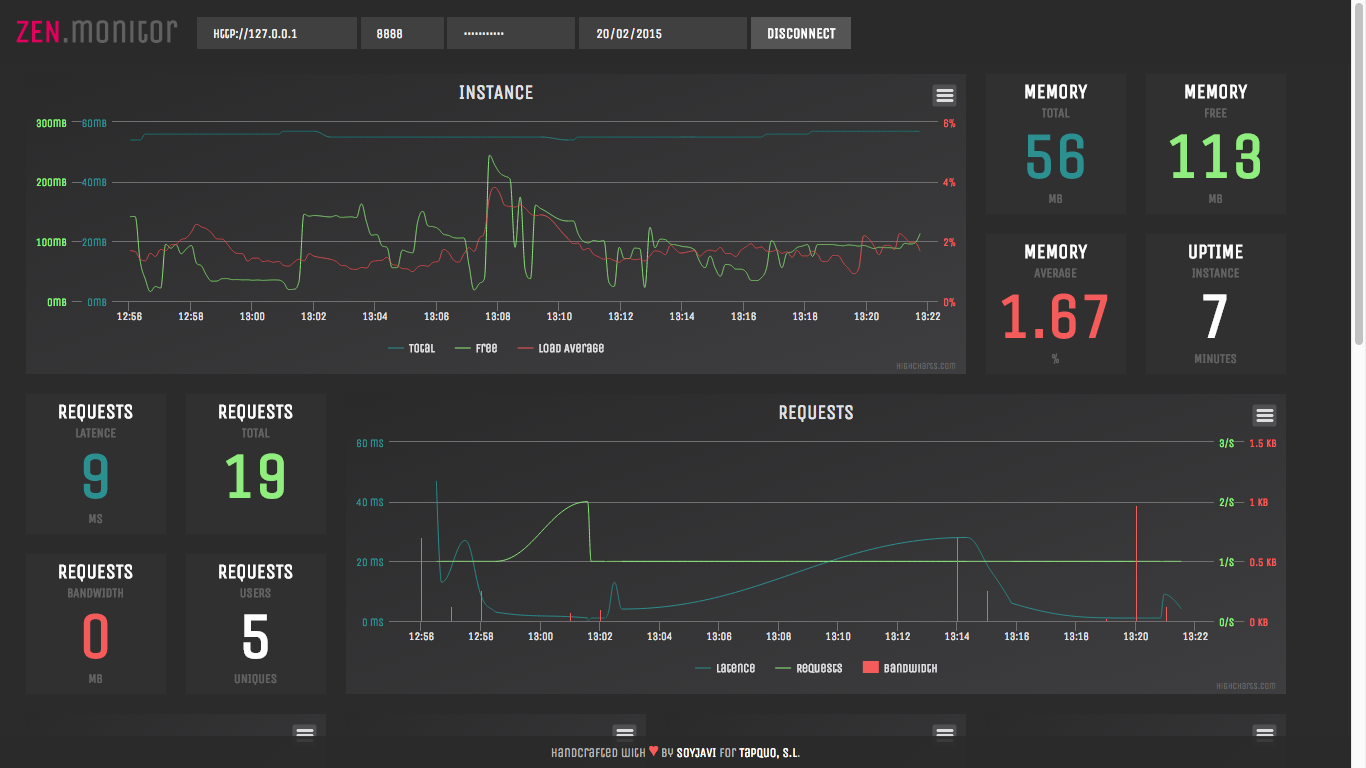
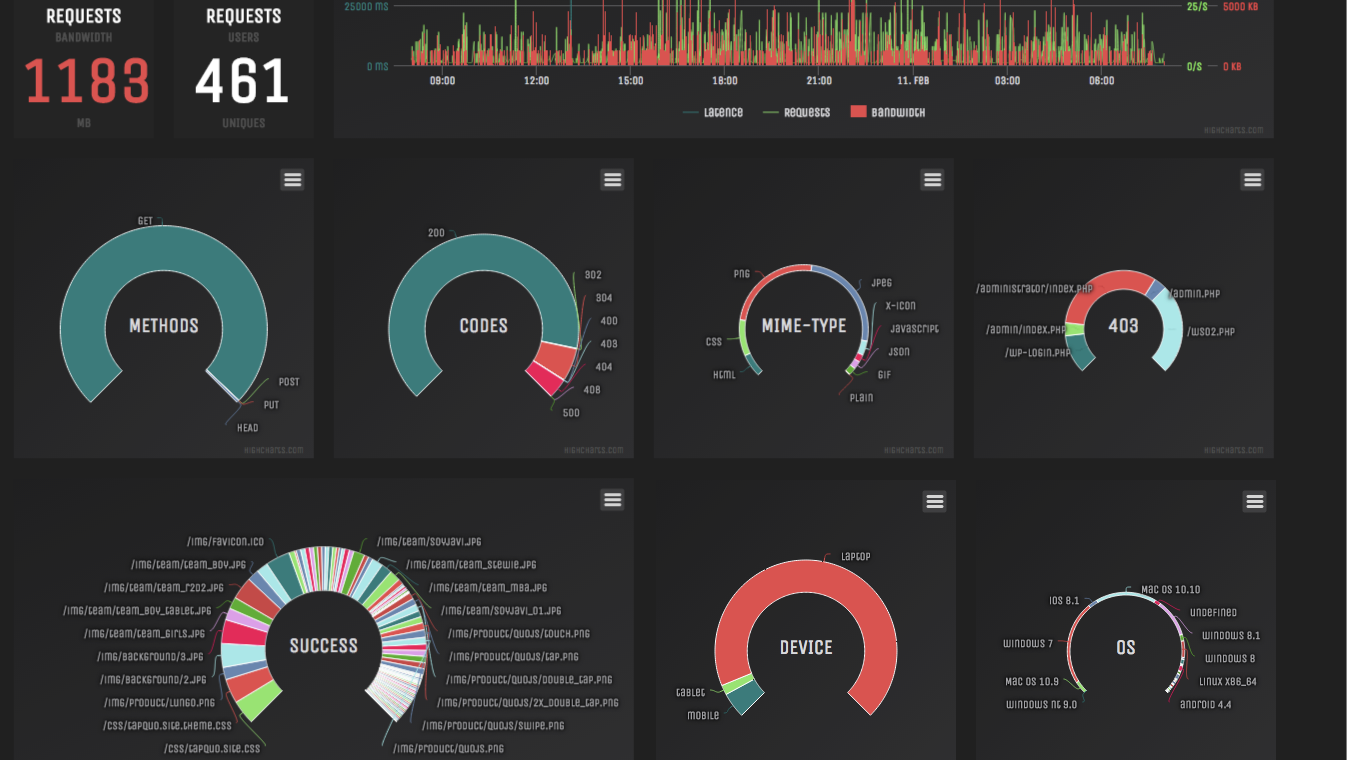
You can use this module of ZEN to visualize data from ZENserver audit.
ZENserver provides information about:
- Memory usage
- Requests to the instance
- Methods: : GET, POST, PUT, DELETE, OPTIONS,...
- Response codes: 200, 403, 404
- mime-types serverd
- Devices, OS, and browsers used
Remember that to use ZENmonitor first we need configure at zen.yml the monitor rule:
zen.yml:
...
# -- Monitor -------------------------------------------------------------------
monitor:
  password: mypassword
  process : 300000 #ms
  request : 1000 #ms
...
ZENserver will store two types of files into monitor's folder: request y server. This files have information about request to application and status machine. With process and request attributes you are configuring when ZENserver will store this information.
To use ZENmonitor first you need clone the project:
$ git clone https://github.com/soyjavi/zen-monitor.gitNow, install all dependencies:
$ npm install
$ bower install
Finally, you just need compile and run de server:
$ gulp init
$ gulpThe gulp command starts a server at http://localhost:8000:
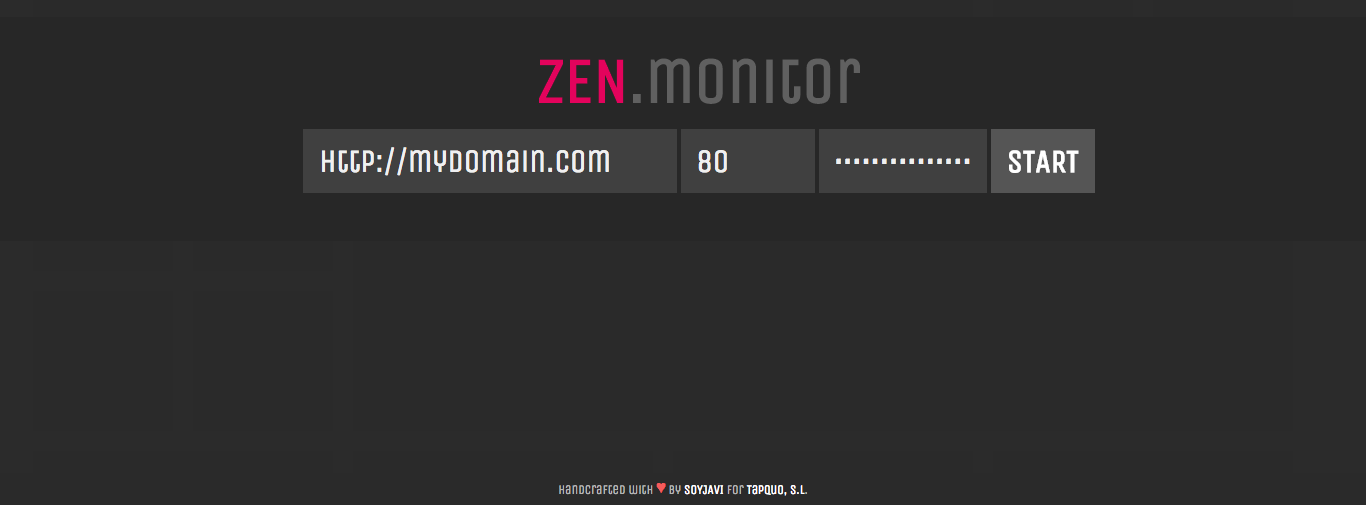
Now, you can type information about your instance: URL, PORT and PASSWORD. This password must be the same as you configured at zen.yml file.
You can export all graph to png, jpeg, pdf, svg formats.


