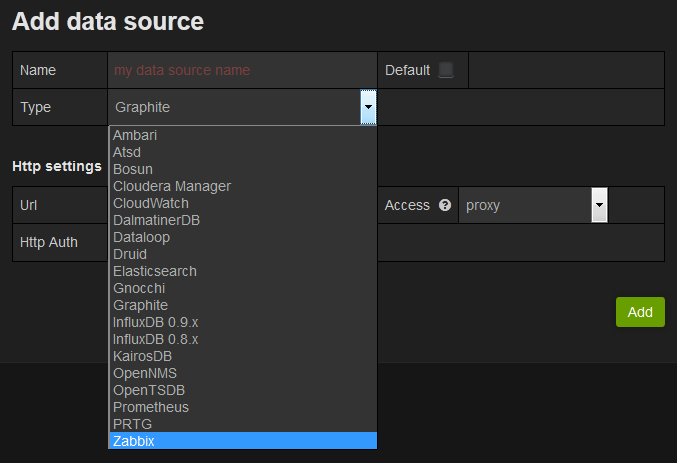
Official Grafana with unofficial plugins: Zabbix, DalmatinerDB, Bosun, Cloudera Manager, OpenNMS, Druid, Atsd, Chnocchi, PRTG, Ambari, ...
Official inbuilt plugins: Graphite, InfluxDB, OpenTSDB, CloudWatch, Elasticsearch, Grafana, Prometheus, SQL, KairosDB.
Please donate to author, so he can continue to publish another awesome projects for free:
Start your image binding the external port 3000:
docker run -d --name=grafana-xxl -p 3000:3000 monitoringartist/grafana-xxl
Try it out, default admin user is admin/admin.
All options defined in conf/grafana.ini can be overriden using environment variables, for example:
docker run \
  -d \
  -p 3000:3000 \
  --name=grafana-xxl \
  -e "GF_SERVER_ROOT_URL=http://grafana.server.name" \
  -e "GF_SECURITY_ADMIN_PASSWORD=secret \
  monitoringartist/grafana-xxl
# create /var/lib/grafana as persistent volume storage
docker run -d -v /var/lib/grafana --name grafana-xxl-storage busybox:latest

# start grafana-xxl
docker run \
  -d \
  -p 3000:3000 \
  --name grafana-xxl \
  --volumes-from grafana-xxl-storage \
  monitoringartist/grafana-xxl
# specify right tag, e.g. 2.6.0 - see Docker Hub for available tags
docker run \
  -d \
  -p 3000:3000 \
  --name grafana-xxl \
  monitoringartist/grafana-xxl:2.6.0
See plugin projects also for documentation:
Please report any plugin issues directly to the author.
Devops Monitoring zExpert, who loves monitoring systems, which start with letter Z. Those are Zabbix and Zenoss.
Professional monitoring services:


