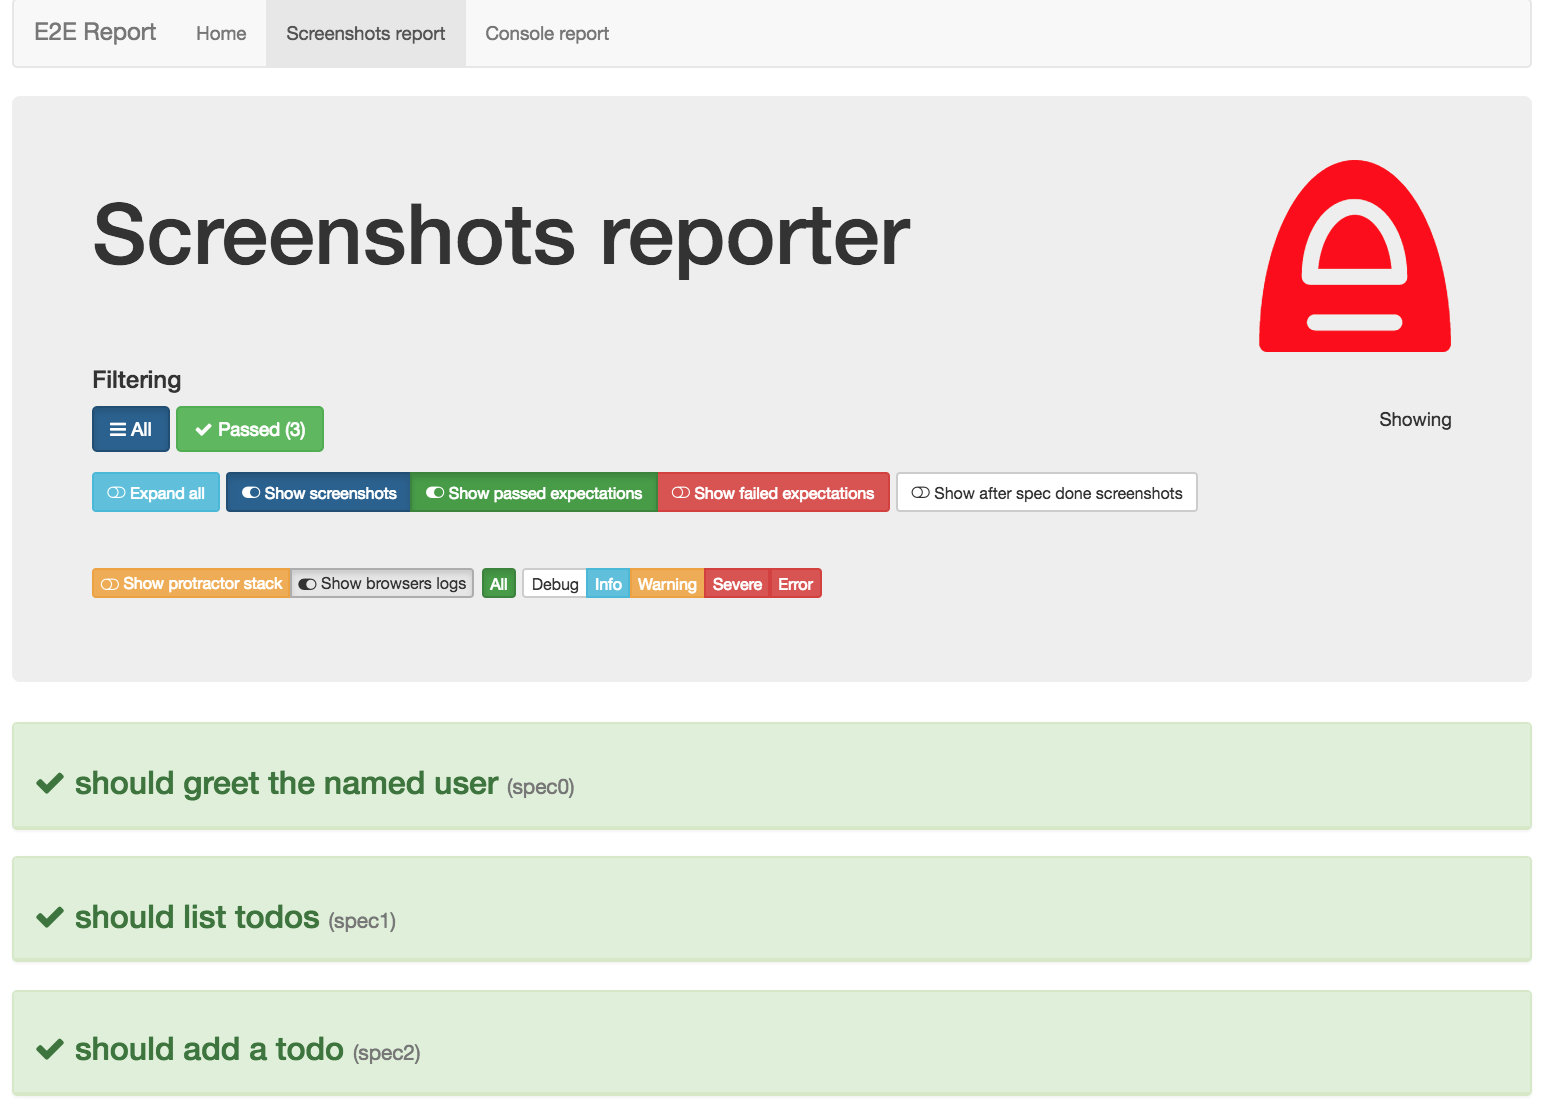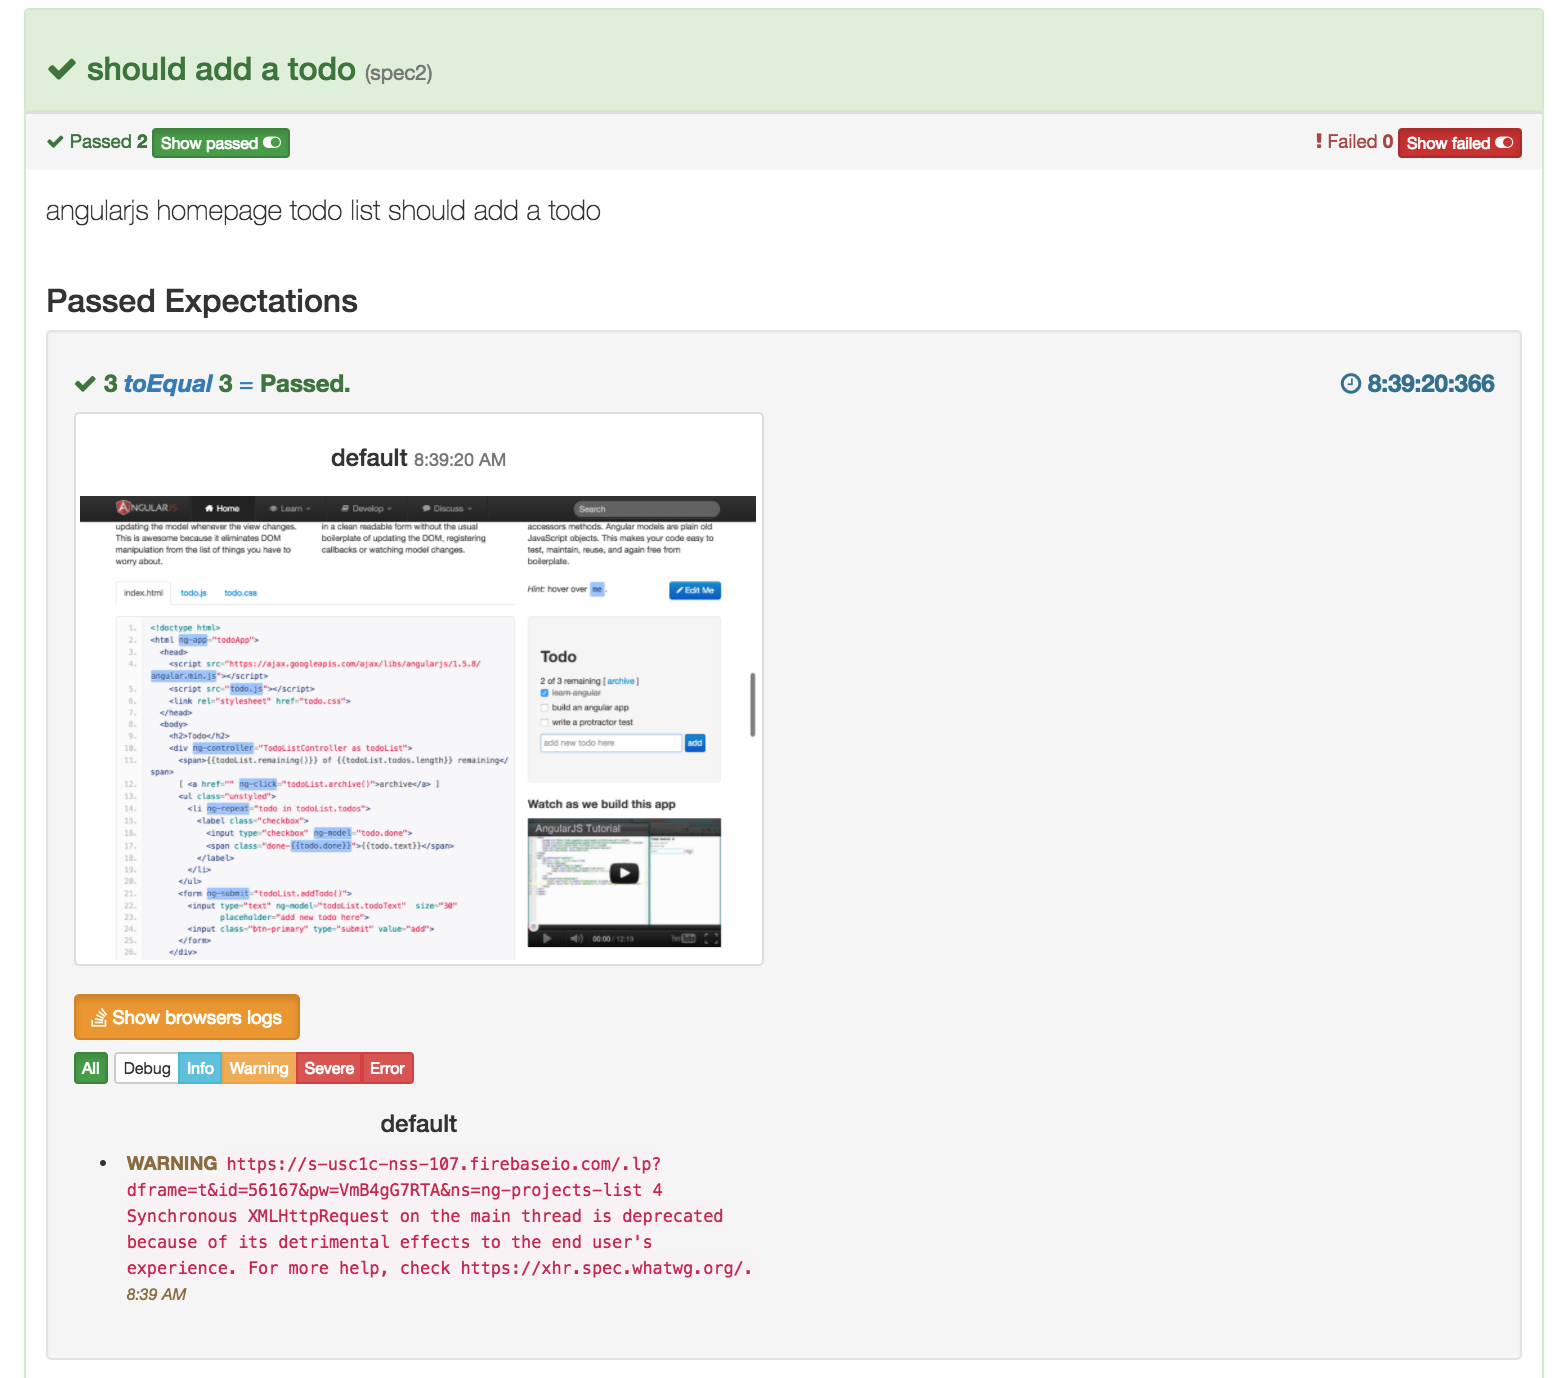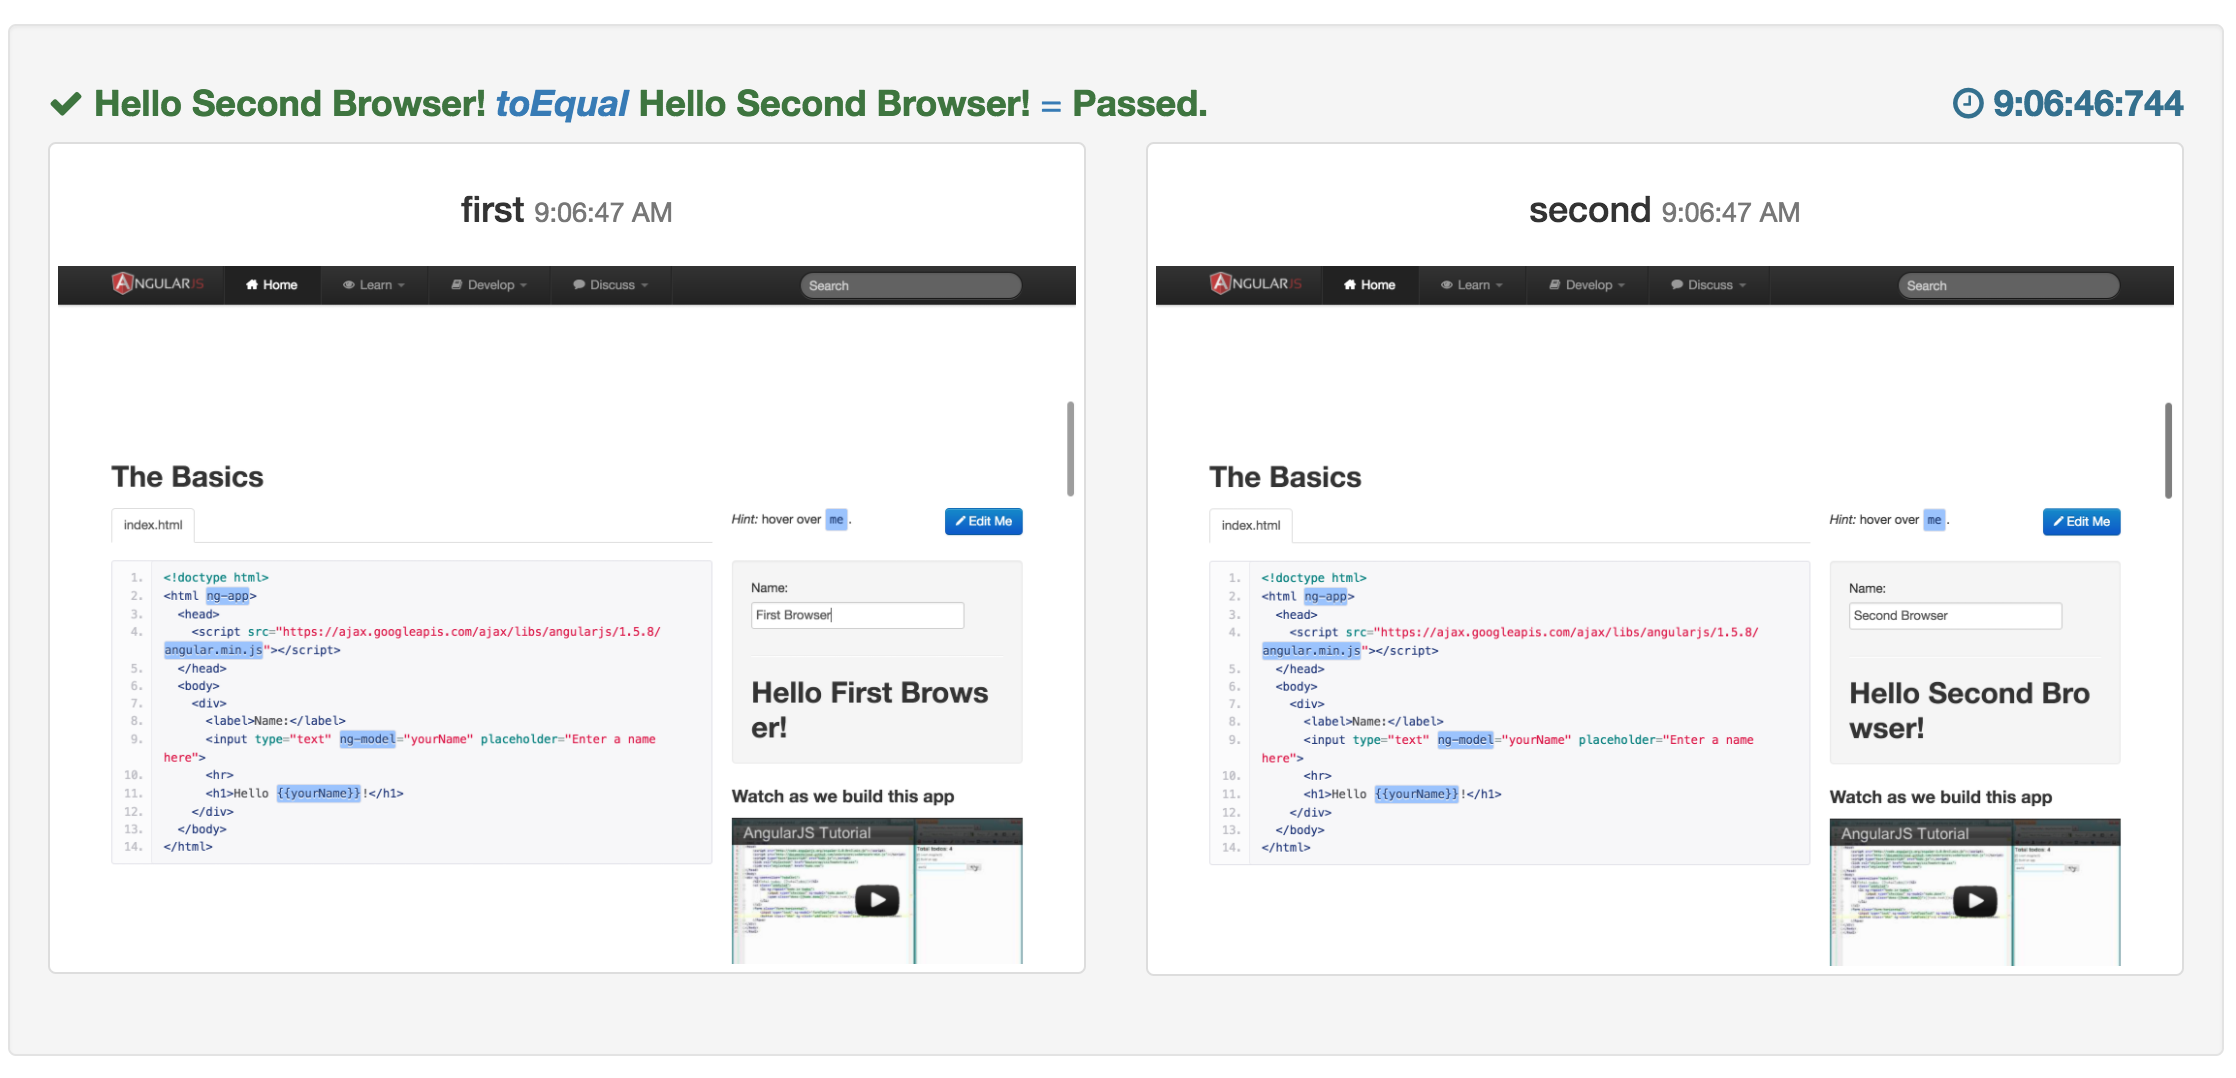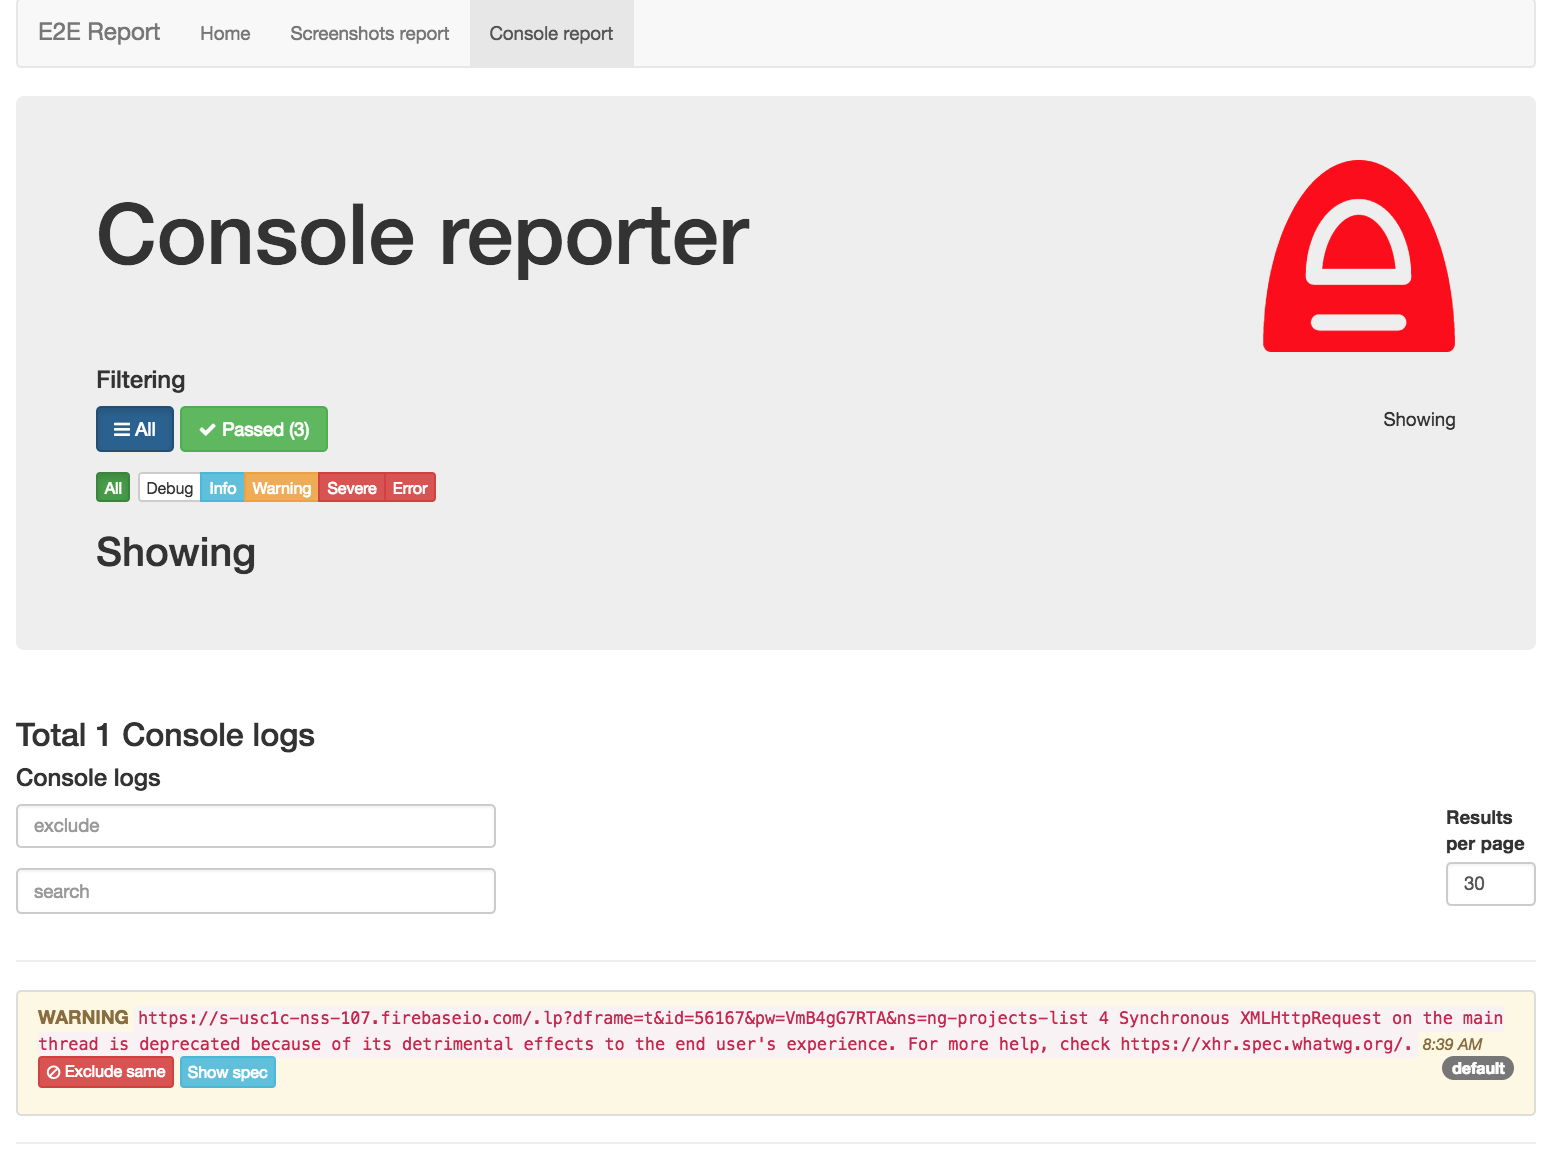
This plugin captures for each expectation or spec console logs and makes screenshots for each browser instance. Also it comes with a beautifull angular based HTML reporter for chat alike apps.
- This plugin can take screenshots for each Jasmine2 expect success/failure on multiple-browsers instances at once.
- It can take screenshots for each spec failure/success as well
- For each expectation or spec can capture console logs for each browser instance
- It can generate a report analyzer - angular+bootstrap HTML reports with active filtering to easy find out why your tests are failing
- HTML reports allow you to analyze your browser's console logs as well.
- Supports circleci.com (the report displays a build number, a branch, etc. )
- Supports parallel tests execution
- Makes optional Ascii screenshots
The main motivation to make this fork from https://github.com/abhishekswain/jasmine2-protractor-utils was taking screenshots from multiple browsers at once. So it would allow me to test a chat alike apps where 2+ browsers instances are required to be run from one single test.
Later on, I realized that I want to have a quick overview what is happening with my tests on the CI server. Without even re-running them locally. When something goes wrong you are basically unable to discover it. This plugin allows you to do so.
The included HTML reporter is Angular based standalone app with a beautiful Bootstrap theme. It allows filtering and narrows down to the root cause. Each screenshot has attached console logs. And we are making screenshots by every expectation not just when the spec is done (this is usually too late to find out, why your test is failing).
Using this plugin without the HTML report doesn't make sense. The main added value is to have a great analytics tool for your reports that visualize all possible available data to provide a holistic approach.
From the code perspective, I split up the report code from the protractor plugin. Perhaps you can plugin in your reporter instead. Also, I think that any open source project must have good test coverage. So I provided the initial set of unit and integrational tests. 🍺
Also, I created a list of alternatives to this plugin and why I think they are just not good enough.
npm install protractor-screenshoter-plugin
NOTE: This plugin depends on screenshoter-report-analyzer. So sometimes even if this plugin version is not updated, the reporter might be.
Please always check our branches started with feat-. There are some new and shiny features that are working but aren't yet published. Each branch has information how to use it and install it. Once it is stable enough, it will be merged to the master branch.
Feel free to provide feedback to them.
Add this plugin to the protractor config file:
exports.config = {
       plugins: [{
       package: 'protractor-screenshoter-plugin',
       screenshotOnExpect: {String}    (Default - 'failure+success', 'failure', 'none'),
       screenshotOnSpec: {String}    (Default - 'failure+success', 'failure', 'none'),
       withLogs: {Boolean}      (Default - true),
       htmlReport: {Boolean}      (Default - true),
       screenshotPath: {String}                (Default - '<reports/e2e>/screenshots')
       writeReportFreq: {String}      (Default - 'end', 'spec', 'asap'),
       verbose: {String} (Default - 'info', 'debug'),
       pauseOn: {String}    (Default - 'never', 'failure', 'spec'),
       imageToAscii: {String}    (Default - 'failure+success', 'failure', 'none'),
       imageToAsciiOpts:{Obbject} (Default - {bg:true})
       clearFoldersBeforeTest: {Boolean}       (Default - false),
       failTestOnErrorLog: {
                failTestOnErrorLogLevel: {Number},  (Default - 900)
                excludeKeywords: {A JSON Array}
           }
       }],
       onPrepare: function () {
        // returning the promise makes protractor wait for the reporter config before executing tests
        return global.browser.getProcessedConfig().then(function (config) {
          //it is ok to be empty
        });
       }
     };
Example:
exports.config = {
    framework: 'jasmine2',

    plugins: [{
        package: 'protractor-screenshoter-plugin',
        screenshotPath: './REPORTS/e2e',
        screenshotOnExpect: 'failure+success',
        screenshotOnSpec: 'none',
        withLogs: 'true',
        writeReportFreq: 'asap',
        imageToAscii: 'failure',
        clearFoldersBeforeTest: true
    }],

    onPrepare: function() {
        // returning the promise makes protractor wait for the reporter config before executing tests
        return global.browser.getProcessedConfig().then(function(config) {
            //it is ok to be empty
        });
    }
};No need to setup anything special to make screenshots or capture console logs.
In order to use multi-browser chat alike testing, you need to keep a track of all browser instances by yourself:
You can do it like this
var a  = browser.forkNewDriverInstance();
var b  = browser.forkNewDriverInstance();

global.screenshotBrowsers['anyCustomNameOfBrowserDisplayedInReports'] = a;
global.screenshotBrowsers.userB = b;
if you close the browser, remove it also from global.screenshotBrowsers After closing browser making screenshots won't work. Make sense, right no browser no screenshot.
delete global.screenshotBrowsers.userB;
to reset screenshotBrowsers from your previous spec use this code
beforeAll(function() {
    global.screenshotBrowsers = {};
  });
For each run of Protractor, it creates separate tests results that are in the end merged into one report.
The configuration such as this one are supported as of version 0.3.x:
exports.config = {
    framework: 'jasmine2',
    //like usual (no change in config api)
    plugins: [{
        package: 'protractor-screenshoter-plugin',
        screenshotPath: './REPORTS/e2e',
        screenshotOnExpect: 'failure+success',
        screenshotOnSpec: 'none',
        withLogs: 'true',
        writeReportFreq: 'asap',
        clearFoldersBeforeTest: true
    }],
    //this is new and supported
    capabilities: {
        'browserName':'chrome',
        'shardTestFiles': true,
        'maxInstances': 5
    }
};If there is a failure (based on the config) it creates also an ASCII image into a log file. For this feature, you need to install additional OS dependent libraries. For more information read the doc imageToAscii bellow.
If set to 'false', disables HTML report generation.
NOTE: This tool doesn't really make sense to use without the reports.
Default: 'true' Valid Options: true/false
Takes from each browser instance stored in global.screenshotBrowsers screenshots for each Jasmine2 expect failure or success, depending on value.
Default: 'failure+success' Valid Options: 'failure+success'/'failure'/'none'
Takes from each browser instance stored in global.screenshotBrowsers screenshots for each Jasmine2 spec failure or success, depending on value.
Default: 'failure' Valid Options: 'failure+success'/'failure'/'none'
If fails, pause browser on expectation failure or spec failure or never.
Default: 'never' Valid Options: 'failure'/'spec'
If set to debug display internal logging.
Default: 'info' Valid Options: 'debug'/'info'
Additionally, make an ASCII image into the console so you can find the issue of you test in your build easier.
Please note that one of the options of screenshotOnExpect or screenshotOnSpec must be used to generate the initial screenshot that as additionally transformed into an ASCII image.
If you are using multiple browsers instances you can disable generating ASCII images individually by setting
browser.skipImageToAscii = true;Then this browser instance will be not generated in the log file.
Default: 'failure' Valid Options: 'failure+success'/'failure'/'none'
To use this feature please follow instructions on https://github.com/IonicaBizau/image-to-ascii/blob/master/INSTALLATION.md
Options for imageToAscii conversion, more info can be found at https://github.com/IonicaBizau/image-to-ascii
Default: {bg:true}
If set to 'true', capture from chrome all logs after each expect or spec
NOTE: This works only on chrome!
Default: 'true' Valid Options: true/false
In order to make chrome' console works properly, you need to modify your protractor.conf as follows webdriverio/webdriverio#491 (comment)
By default, the output JSON file with tests results is written at the end of the execution of jasmine tests. However for debug process is better to get it immediately after each expectation - specify the option 'asap'. Also, there is a less usual option to write it after each test - use the option 'spec'. The recommended is to left it out for a CI server and for a local debugging use the option 'asap'.
Default: 'end' Valid Options: 'asap', 'spec', 'end'
The path where the final report including screenshots will be saved. If the path does not exist, will be created. e.g './reports/something/samewhere/', please take care of './' and '/' at the beginning and end.
Please note that due to an HTML reporter sugar, the final screenshots are stored in the subfolder relative to this $screenshotPath parameter, e.g. in the folder $screenshotPath/screenshots'
Default: 'reports/e2e'
If this flag set to true, screenshot and HTML report directories will be emptied before generating new reports and screenshots
Default: false
Contains a set of configuration for console log. When browser console has errors of a certain log level (default:>900), the spec/test is marked failed along with log in the error report/stacktrace.
NOTE: This works only on chrome!
Log level, test fails of the browser console log has logs more than this specified level.
Default: 900
An array of keywords to be excluded, while searching for error logs. i.e If a log contains any of these keywords, spec/test will not be marked failed.
Please do not specify this flag, if you don't supply any such keywords.
After cloning the project you can run tests as follows:
npm installnpm run setupnpm run server &npm test
Please use git-cz to format your commit message.
To deploy a new version run commands. If all tests are passed it will be published to npm on its own.
npm run release
git push --follow-tags origin master
- Convert to typescript based es6 npm plugin with a proper test infrastructure
- Support Mocha framework
- 100% Test coverage


