This Python package implements Edward Tufte's concept of sparklines, but limited to text only e.g. like this: ▃▁▄▁▅█▂▅ (this I likely not displayed correctly in every browser). You can find more information about sparklines on Wikipedia. This code was mainly developed for running simple plausibility tests in sensor networks as shown in fig. 1 below:
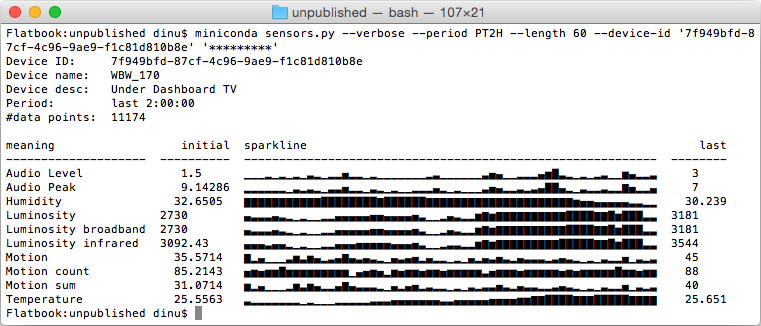
Fig. 1: Example usecase for such "sparklines" on the command-line, showing IoT sensor values (generating code not included here).
Due to limitations of available Unicode characters this works best when all values are positive. And even then true sparklines that look more like lines and less like bars are a real challenge, because they would need multiple characters with a single horizontal line on different vertical positions. This would work only with a dedicated font, which is way beyond the scope of this tool and which would significantly complicate its usage. So we stick to these characters: "▁▂▃▄▅▆▇█", including a blank when there is no value.
This code was tested ok for Python 2.6 to 2.7 and 3.2 to 3.5.
Here's a recorded sample session illustrating how to use sparklines:

Here is some example output on the command-line (please note that in some browsers the vertical alignment of these block characters might be displayed slightly wrong, the same effect can be seen for other repos referenced below):
Examples for the code below:
$ sparklines 2 7 1 8 2 8 1 8
▂▇▁█▂█▁█
$ echo 2 7 1 8 2 8 1 8 | sparklines
▂▇▁█▂█▁█
$ sparklines < numbers.txt
▂▇▁█▂█▁█
$ sparklines 0 2. 1e0
▁█▅You can clone this repository and install it via python setup.py install
or pip install -e ..
After installing, you will have access system-wide (or in your virtualenv
if you have used that) to sparklines programmatically or via the
command-line. At some later time it will be also available via
pip install sparklines from the Python Package Index.
To run the (still very small) "test suite", download and unpack this repository
or clone it, and run the command python setup.py test in the unpacked
archive. This will use a minified version of the pytest package included
in this package in the file test/runtests.py. If you have the excellent
pytest package installed you can also run py.test test from the
downloaded repository's root folder.
Please note that the samples below might look a little funky (misaligned or even colored) in some browsers, but it should be totally fine when you print this in your terminal, Python or IPython session or your Python IDE of choice. The following images shows better what you should expect than the copied sample code thereafter:
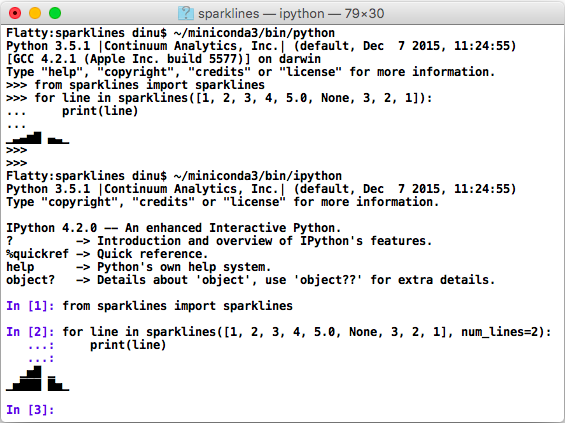
Fig. 2: Example invocation from a Python and an IPython session.
Here are two sample invocations from the command-line, copied into this README:
$ sparklines 1 2 3 4 5.0 null 3 2 1
▁▃▅▆█ ▅▃▁

$ sparklines -n 2 1 2 3 4 5.0 null 3 2 1
  ▁▅█ ▁
▁▅███ █▅▁And here are sample invocations from interactive Python sessions, copied into
this README. The main function to use programmatically is
sparklines.sparklines():
In [1]: from sparklines import sparklines

In [2]: for line in sparklines([1, 2, 3, 4, 5.0, None, 3, 2, 1]):
   ...:     print(line)
   ...:
▁▃▅▆█ ▅▃▁

In [3]: for line in sparklines([1, 2, 3, 4, 5.0, None, 3, 2, 1], num_lines=2):
    print(line)
   ...:
  ▁▅█ ▁
▁▅███ █▅▁This code was inspired by Zach Holman's spark, converted to a Python module by Kenneth Reitz as spark.py and by RegKrieg to a Python package named pysparklines. And Roger Allen provides an even shorter spark.py.
But since it is so short and easy to code in Python we can add a few nice extra features I was missing, like:
- increasing resolution with multiple output lines per sparkline
- showing gaps in input numbers for missing data
- issuing warnings for negative values (allowed, but misleading)
- (todo) highlighting single values exceeding some threshold with a different
color using
termcolor