This repository has been archived by the owner on Dec 15, 2022. It is now read-only.
Initial working feature addition of Node --inspect Metadata Server. #235
Add this suggestion to a batch that can be applied as a single commit.
This suggestion is invalid because no changes were made to the code.
Suggestions cannot be applied while the pull request is closed.
Suggestions cannot be applied while viewing a subset of changes.
Only one suggestion per line can be applied in a batch.
Add this suggestion to a batch that can be applied as a single commit.
Applying suggestions on deleted lines is not supported.
You must change the existing code in this line in order to create a valid suggestion.
Outdated suggestions cannot be applied.
This suggestion has been applied or marked resolved.
Suggestions cannot be applied from pending reviews.
Suggestions cannot be applied on multi-line comments.
Suggestions cannot be applied while the pull request is queued to merge.
Suggestion cannot be applied right now. Please check back later.
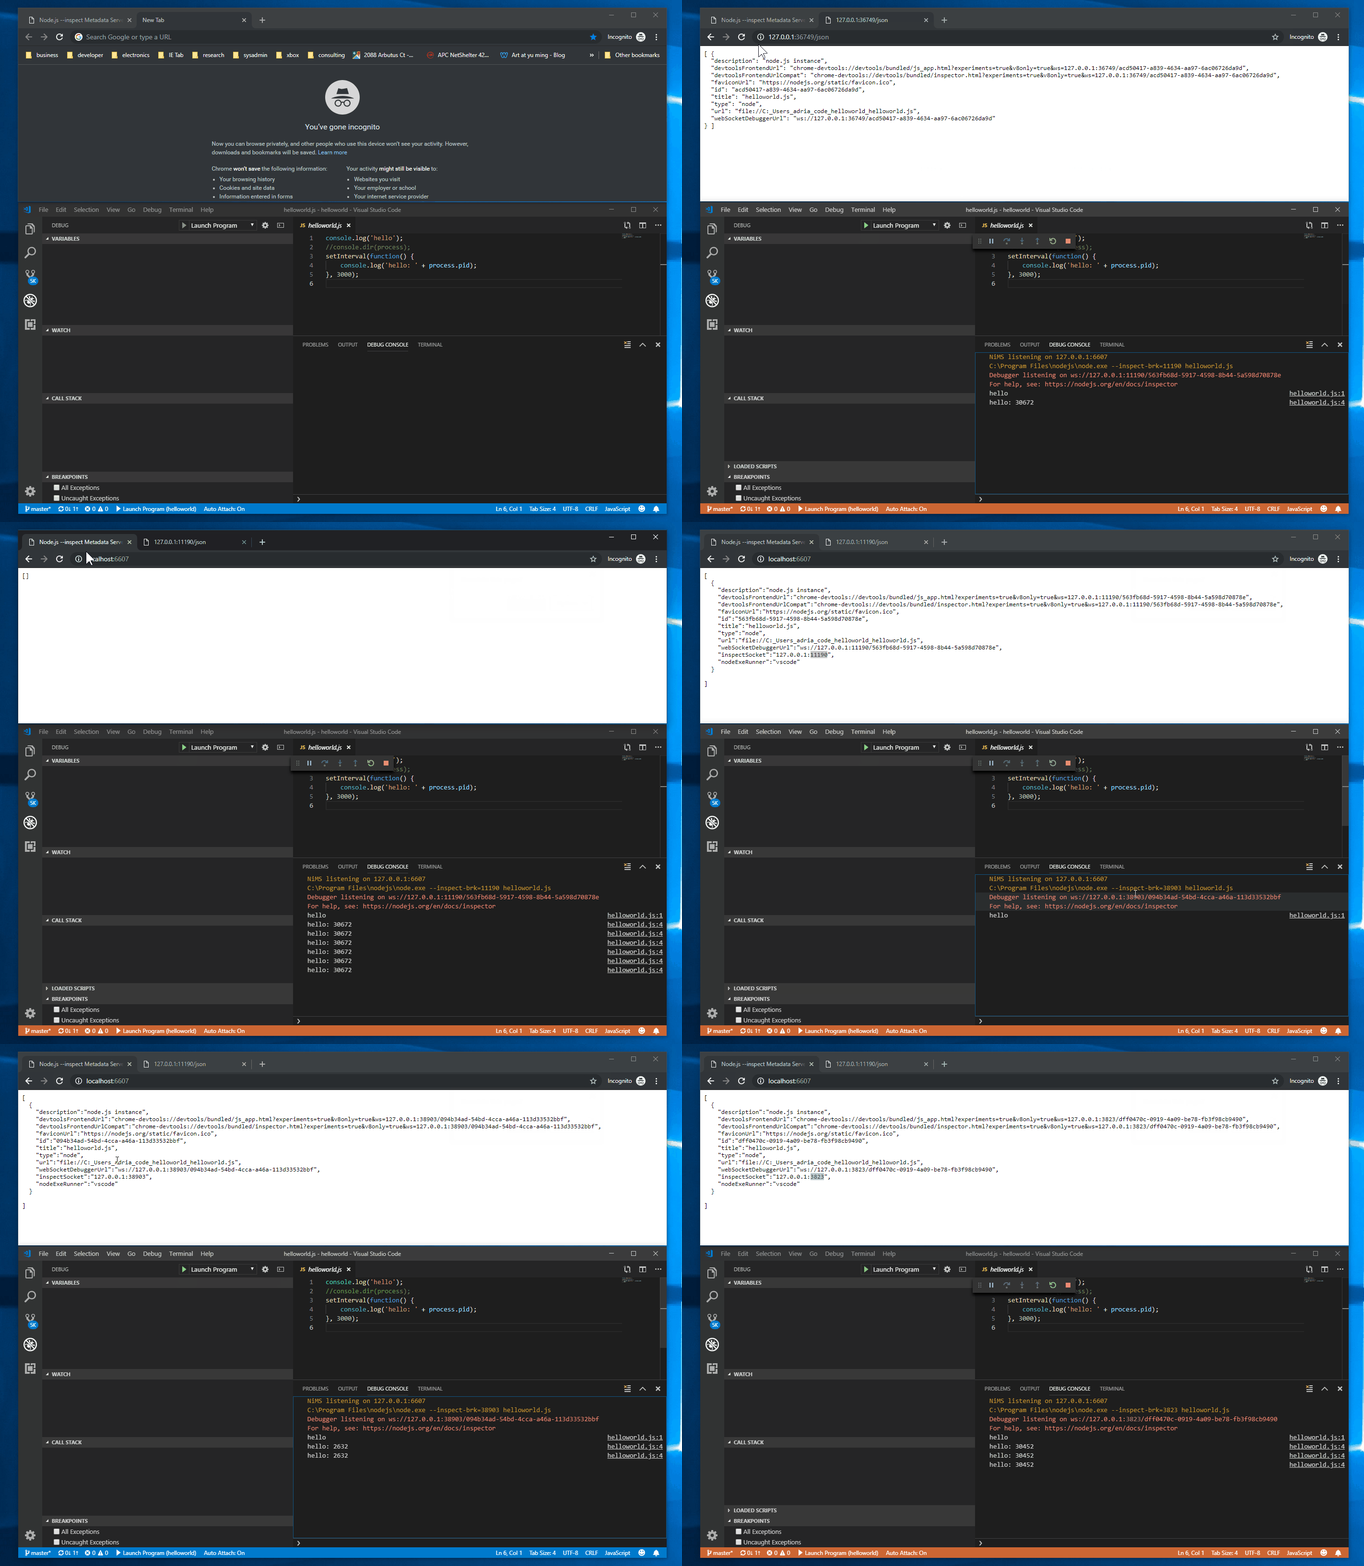
This feature would be helpful in cases where other applications need access to Node's debug socket metadata but where VSCode is the owner of the Node.js process. This addition publishes the metadata provided by the Node binary via http://localhost:9229/json to http://localhost:6607.
As VSCode calls the Node.exe such that Node chooses a random debug port, sharing this information is needed as no other way exists to know upon which port the debugger has started listening. This addition re-publishes said metadata by starting a local http instance and listening on a process independent port (tcp/6607). The metadata gathered from Node's /json URL is updated as processes are created and destroyed.
Here is an example of this in use:
