-
Notifications
You must be signed in to change notification settings - Fork 14
Clustering infrastructure
lgatto edited this page Apr 24, 2013
·
23 revisions
Defining a clustering infrastructure, similar to the supervised framework currently available.
- Simple/direct (naive) clustering for data exploration and QC. Should work out of the box on an
MSnSetand then be plotted withplot2D. - Optimisation infrastructure.
-
kmeans, as a baseline clustering method - spectral clustering (
kerlab::specc) - Gaussian mixture models (
mclust) - other
Taking kmeans as example, and using the supervised framework as template.
library("pRoloc")
library("pRolocdata")
data(dunkley2006)res <- kmeansClustering(dunkley2006, centers = 9)
head(fData(res)$kmeans)## [1] 5 5 5 5 5 5
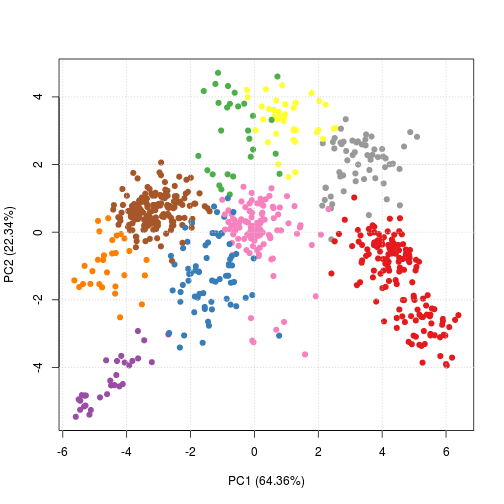
plot2D(res, fcol = "kmeans")
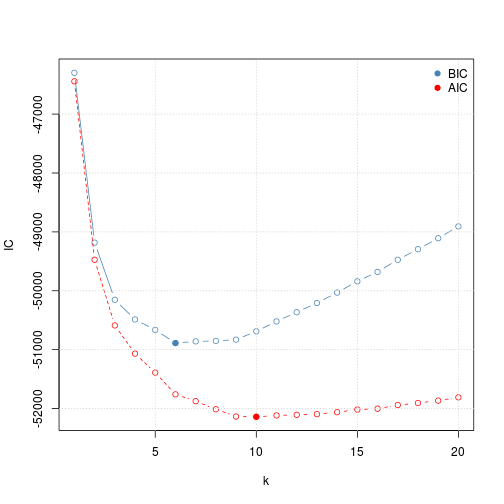
(param <- kmeansOptimisation(dunkley2006))## Object of class "ClustRegRes"
## Algorithm: kmeans
## Criteria: BIC AIC
## Parameters:
## k : 1 2 ... 19 20
getParams(param, "BIC")## k
## 6
getParams(param, "AIC")## k
## 10
plot(param)
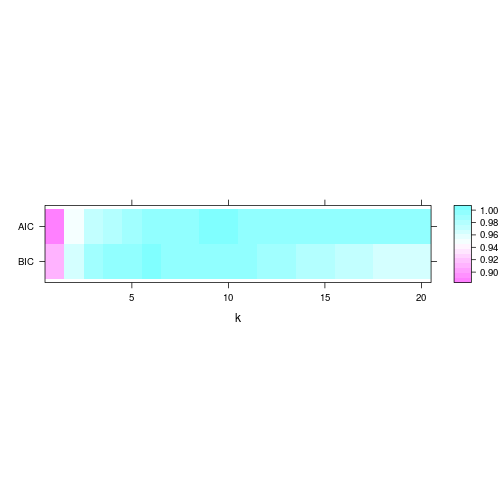
levelPlot(param)
fvarLabels(res2 <- kmeansClustering(dunkley2006, param))## [1] "markers" "assigned" "evidence" "method" "new"
## [6] "pd.2013" "pd.markers" "kmeans"
kmeansOptimisation(object, fcol), where fcol represents a feature data column with test cluster definitions, and the function would optimise kmeans and its parameter to match the priors. See clue package for criteria.
-
table(fData(res)$kmeans, fData(res)$specc)- possibly requires a renumbering of clusters. - something like
plotClust(res, fcol = c("kmeans", "specc"))or evenplot2D. - more than 2 clusters?
- The
cluepackage - tools to compute metrics to validate the quality of a clustering, as well as tools to deal with the comparison of a clustering with a known ground truth. - Quick-R Cluster Analysis page.