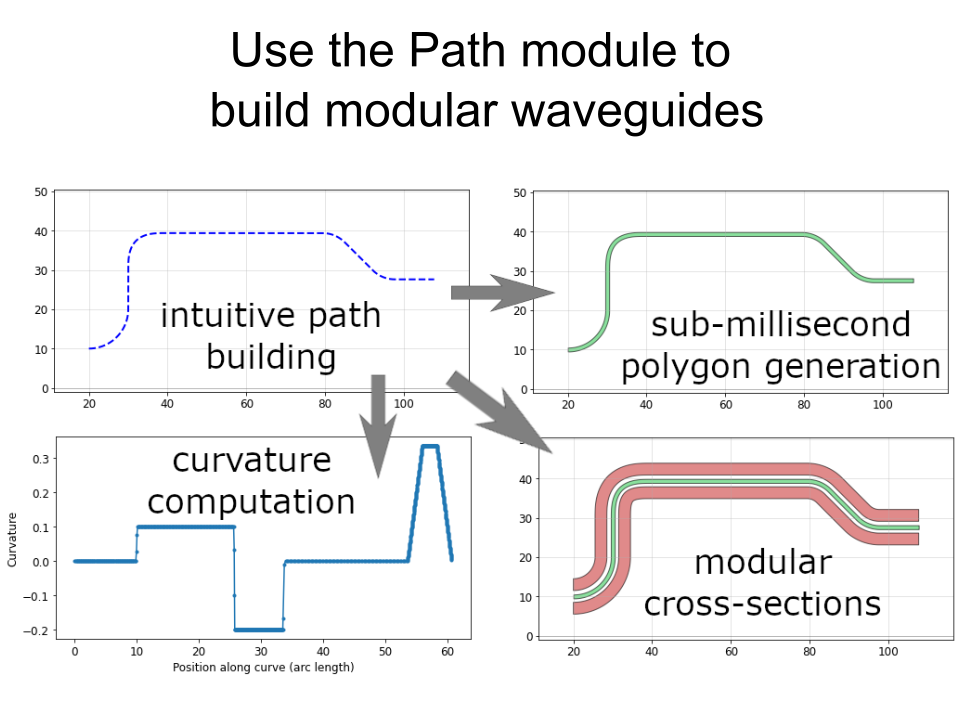
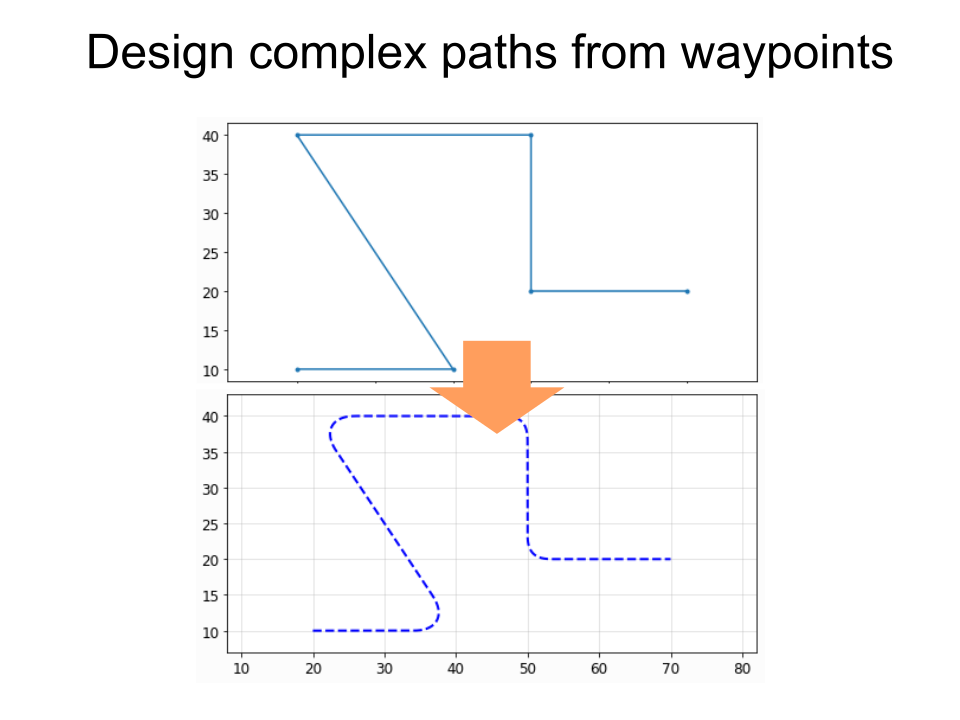
GDS scripting that's intuitive, fast, and powerful. For Python 2 and 3.
- Installation / requirements
- Tutorial + examples (or try an interactive notebook)
- Geometry library + function documentation
- Changelog (latest update 1.5.2 on May 19, 2021)
- Better interactive windows for
quickplot()! Now you can use the mousewheel/trackpad scroll to zoom in and out, and right-click or left-click to zoom to a region. - New
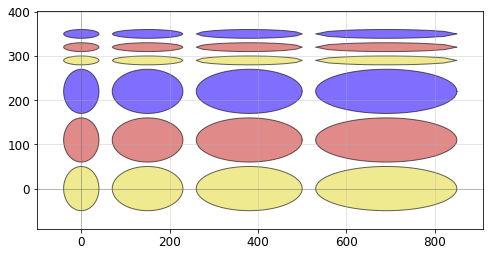
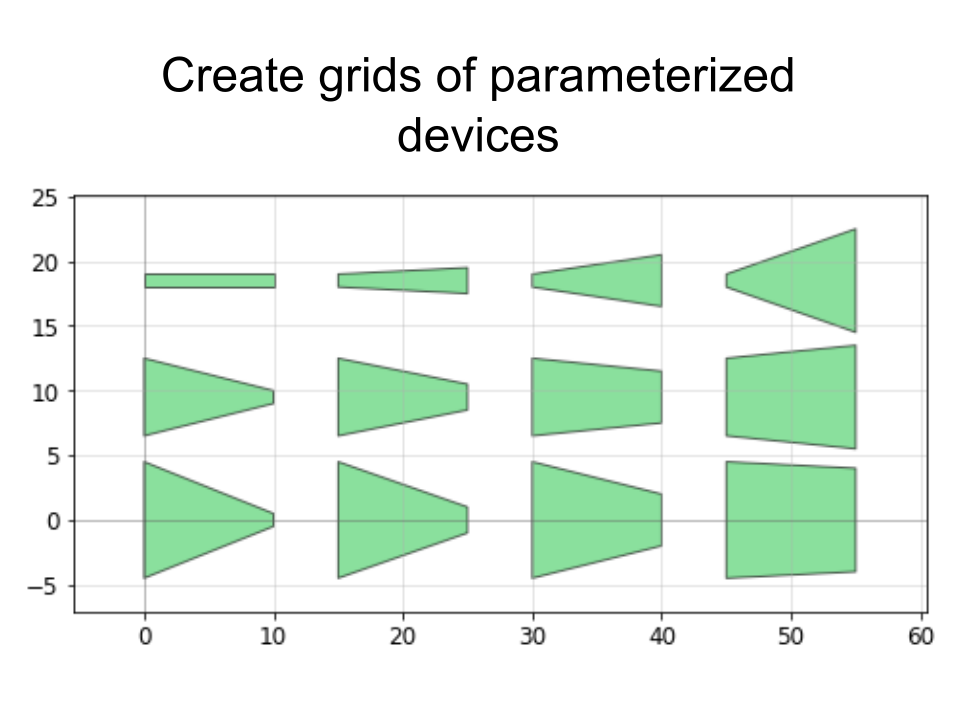
pg.gridsweep()function, allowing for easy creation of parameter sweeps on a grid. See the documentation for details.
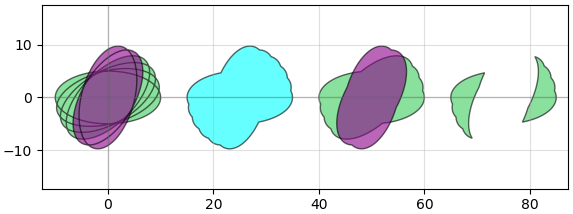
- Better interactive windows for
D = pg.gridsweep(
      function = custom_ellipse,
      param_x = {'width' :  [40, 80, 120, 160]},
      param_y = {'height' : [10, 50],
                 'layer' :  [1, 2, 3]  },
      spacing = (30,10))
- Install or upgrade with
pip install -U phidl - Python 2 >=2.6 or Python 3 >=3.5
- If you are on Windows or Mac and don't already have
gdspyinstalled, you will need a C++ compiler- For Windows + Python 3, install "Build Tools for Visual Studio" (make sure to check the "C++ build tools" checkbox when installing)
- For Windows + Python 2, install Microsoft Visual C++ Compiler for Python 2.7
- For Mac, install "Xcode" from the App Store, then run the command
xcode-select --installin the terminal
fiddle (verb) - /ˈfidl/ - to make minor manual movements, especially to adjust something
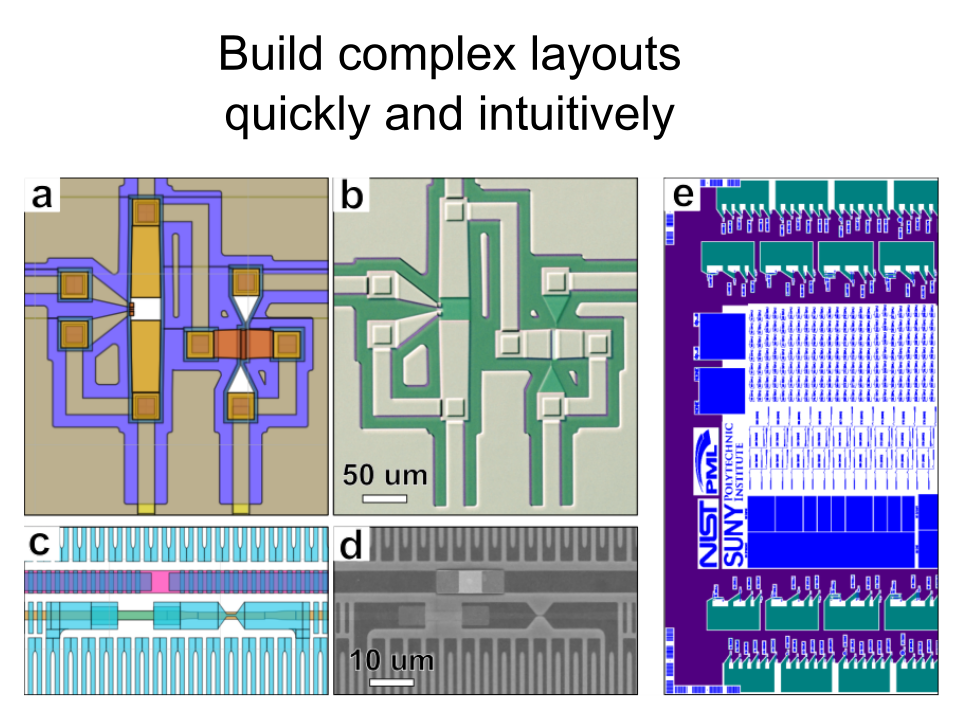
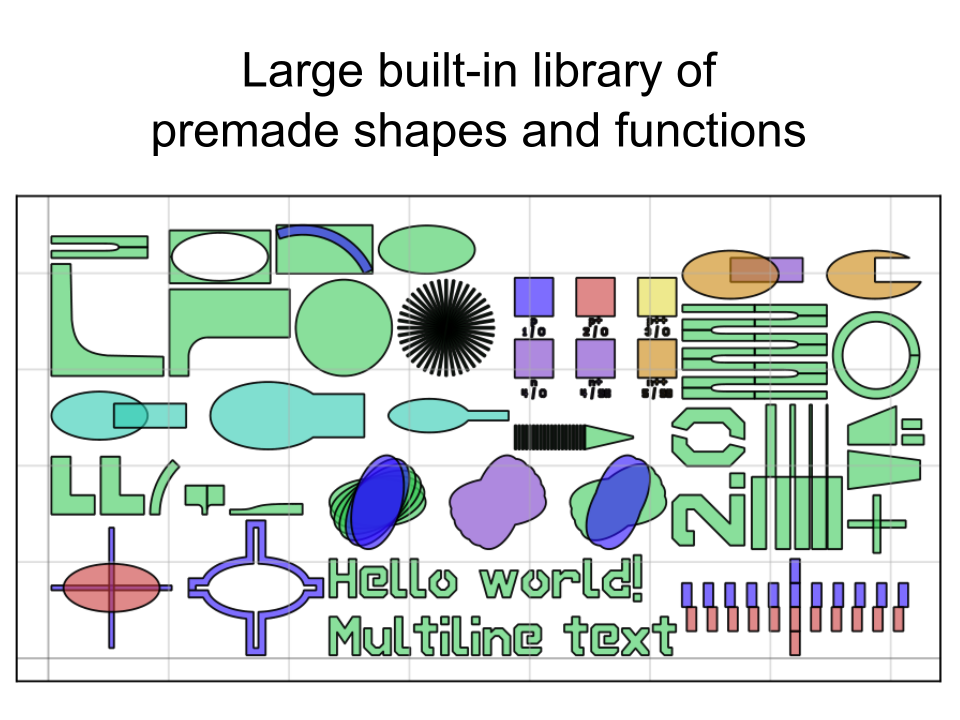
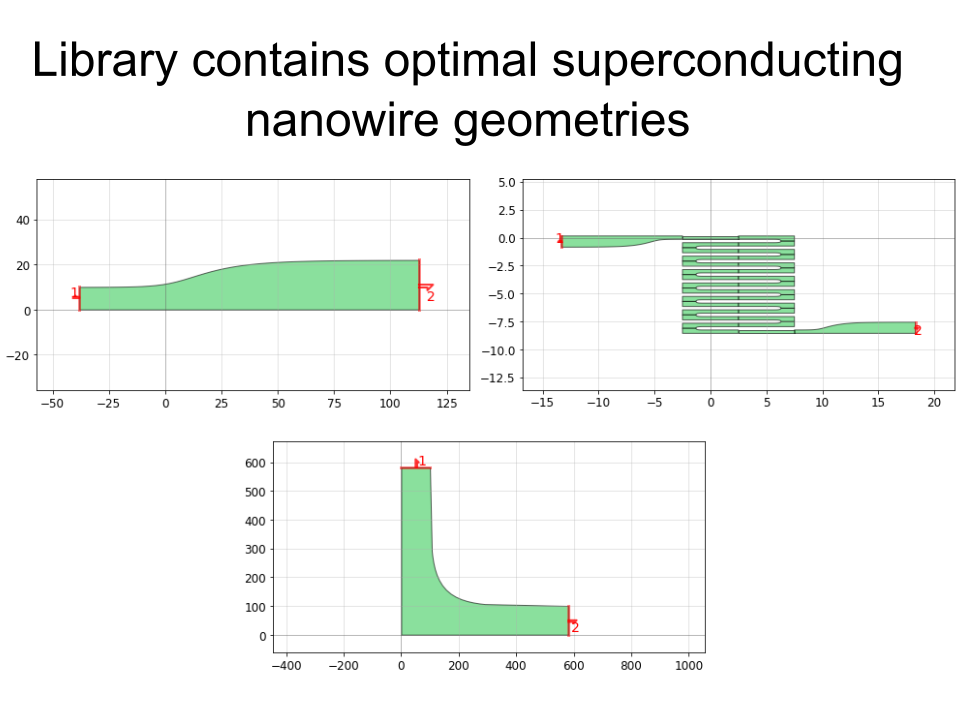
PHIDL is an open-source GDS-based CAD tool for Python 2 and 3 that significantly extends the excellent gdspy. The base installation includes a large library of simple shapes (e.g. rectangles, circles), photonic structures (e.g. sine curve waveguides), and superconducting nanowire shapes (e.g. single photon detectors) that are fully parameterized. It also has a built-in quick-plotting function based on matplotlib (or Qt) that allows you view the state of any GDS object, useful when scripting geometry-making functions. It also has a geometry library reference and a set of very thorough tutorials that will walk you through the process of getting acquainted with PHIDL.
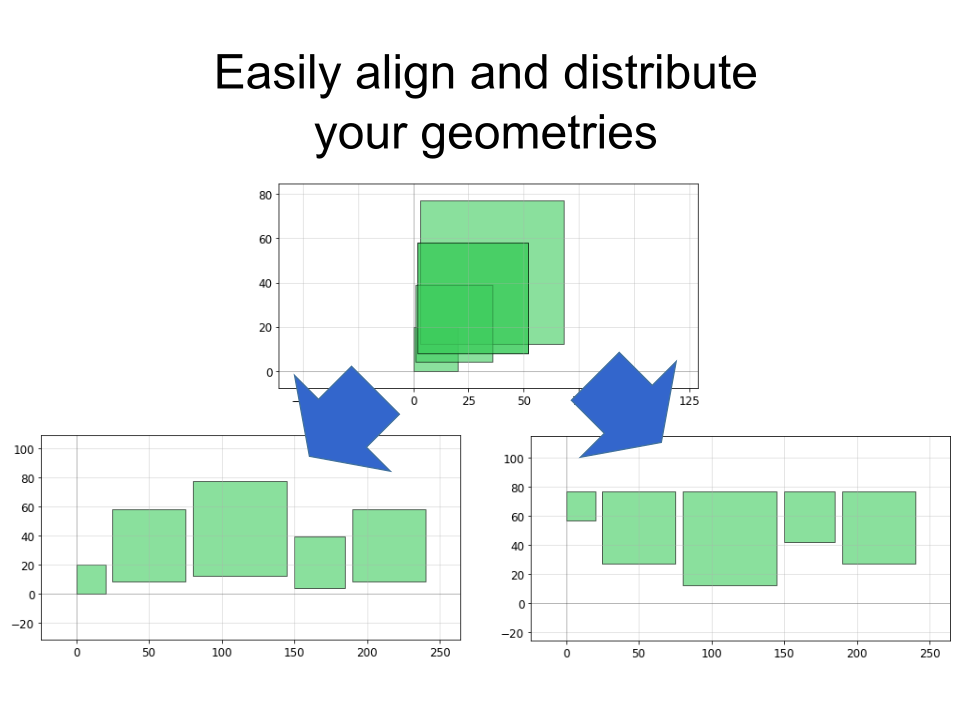
The goal is to bring the usability of Illustrator / Inkscape drawing programs to the GDS scripting world. Like Python itself, it aims to be readable, and intuitive. For instance, when building a geometry you don't have to worry about what the exact coordinates are anymore. If you want to separate two ellipses in the x direction by 5 units, you can do things like this:
ellipse1.xmin = ellipse2.xmax + 5
or if you want to move then rotate one ellipse by 45 degrees you can do
ellipse2.move([1,7]).rotate(45)
There's a few dozen shortcuts like this that make life easier built into PHIDL--they're simple, but they make a world of difference when you just want to e.g. space a ring resonator some distance from a waveguide without having to track each and every coordinate of the shape.
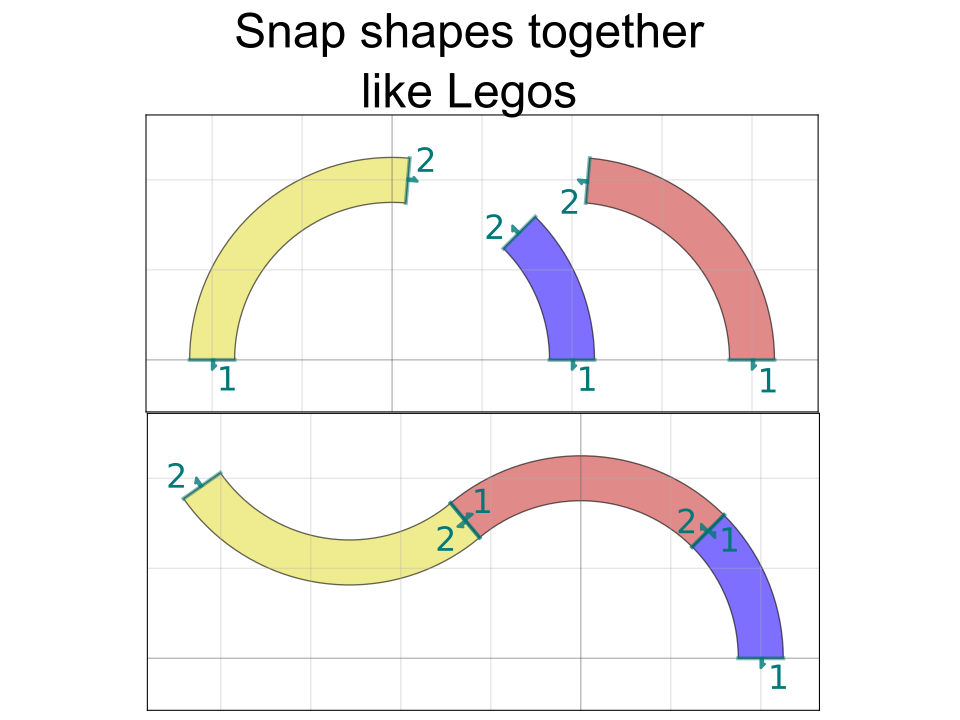
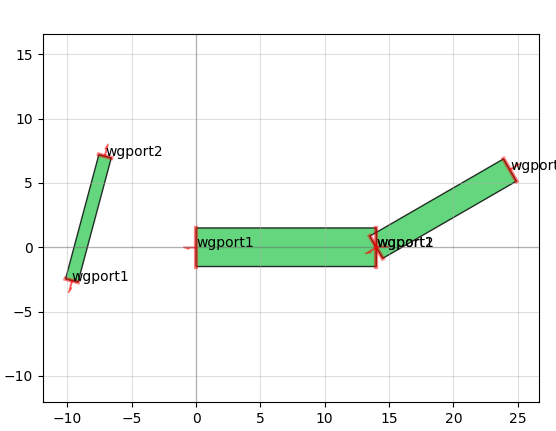
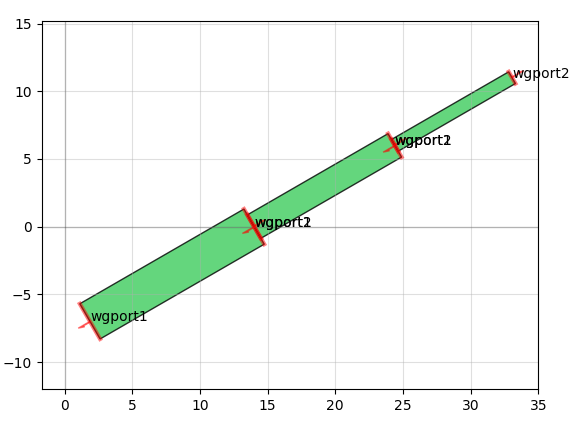
There's also a "port" functionality that allows you to snap together geometry like Legos without caring about where exactly the absolute coordinates of either geometry is. For instance, connecting the above misaligned rectangles is a two-line command:
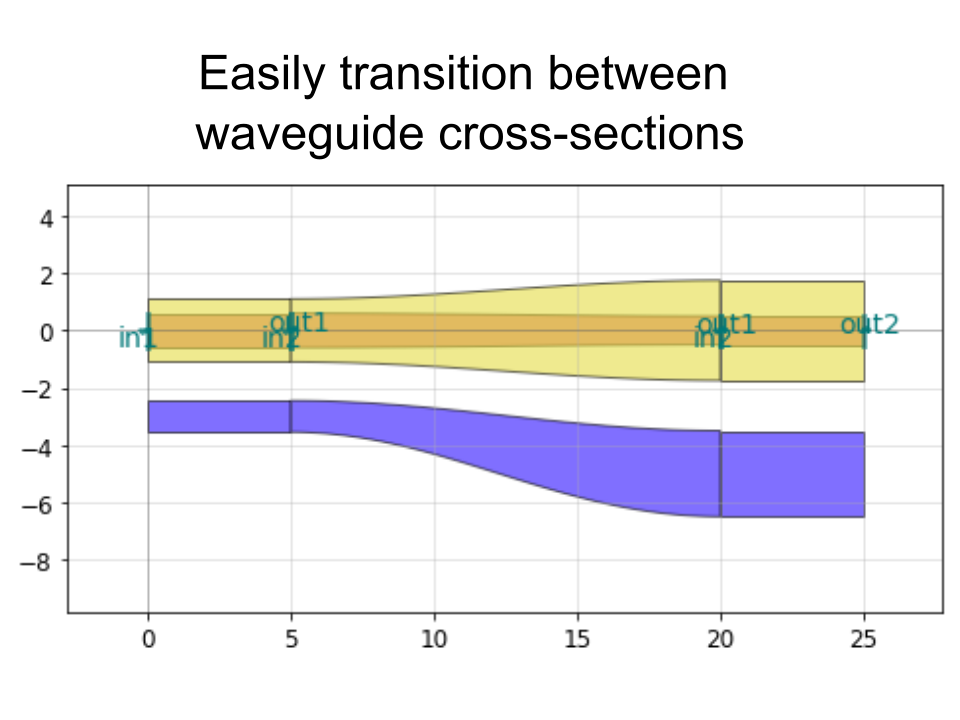
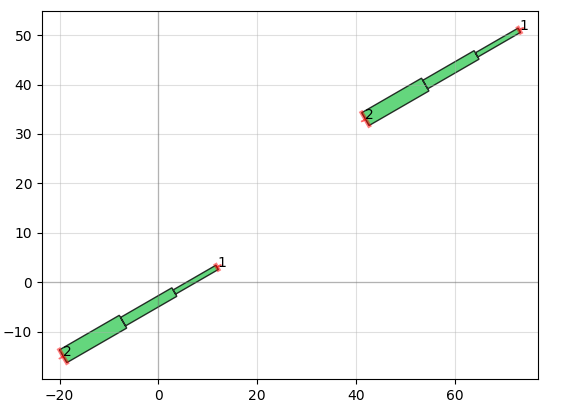
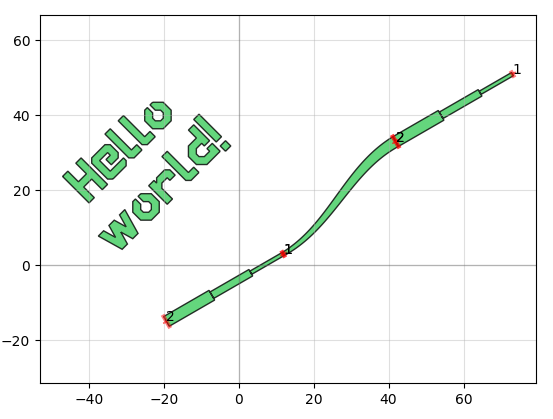
It also allows you to do things like add text and create smooth or straight routing curves between "ports" of different devices, convenient for making electrical or optical connections:
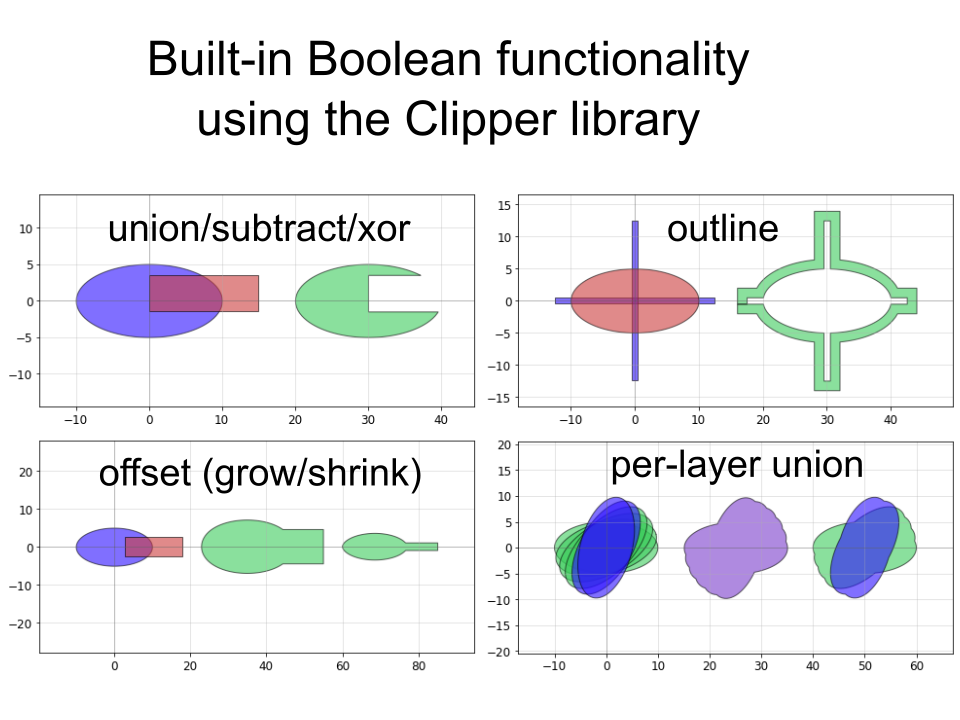
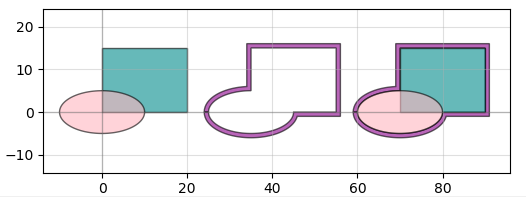
Other useful functionality available are standard operations like booleans:
and less standard ones like creating outlines. A whole layout can be outlined directly in the GDS without requiring you to use Beamer (useful for positive-tone resist structures):
pg.outline(D, distance = 0.7, layer = 4)
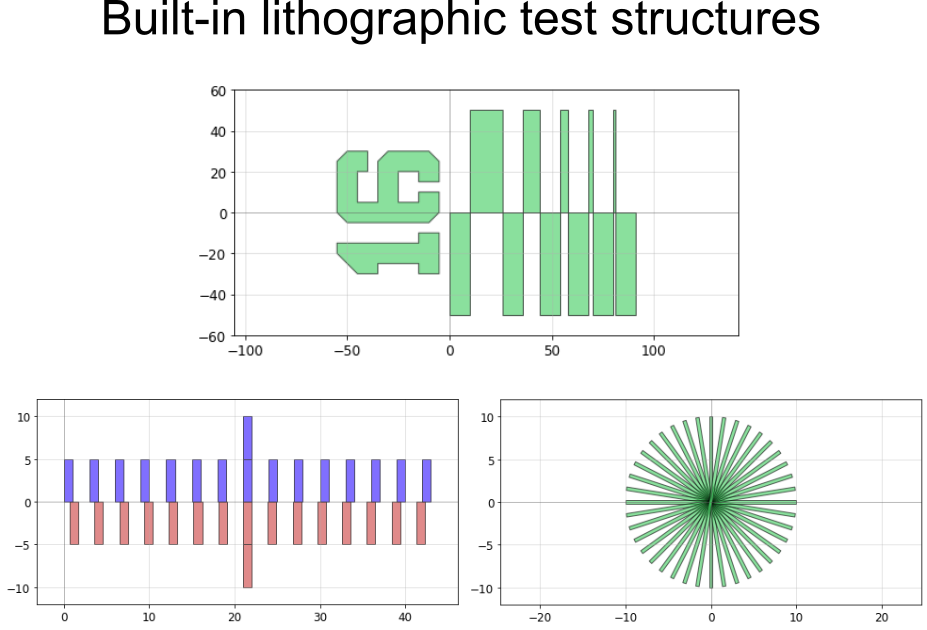
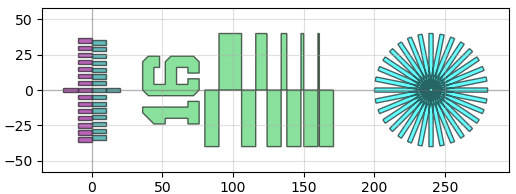
The geometry library also has useful resolution test-structures built into it, for instance
pg.litho_calipers(num_notches = 7, offset_per_notch = 0.1)
pg.litho_steps(line_widths = [1,2,4,8,16])
pg.litho_star(num_lines = 16, line_width = 3)
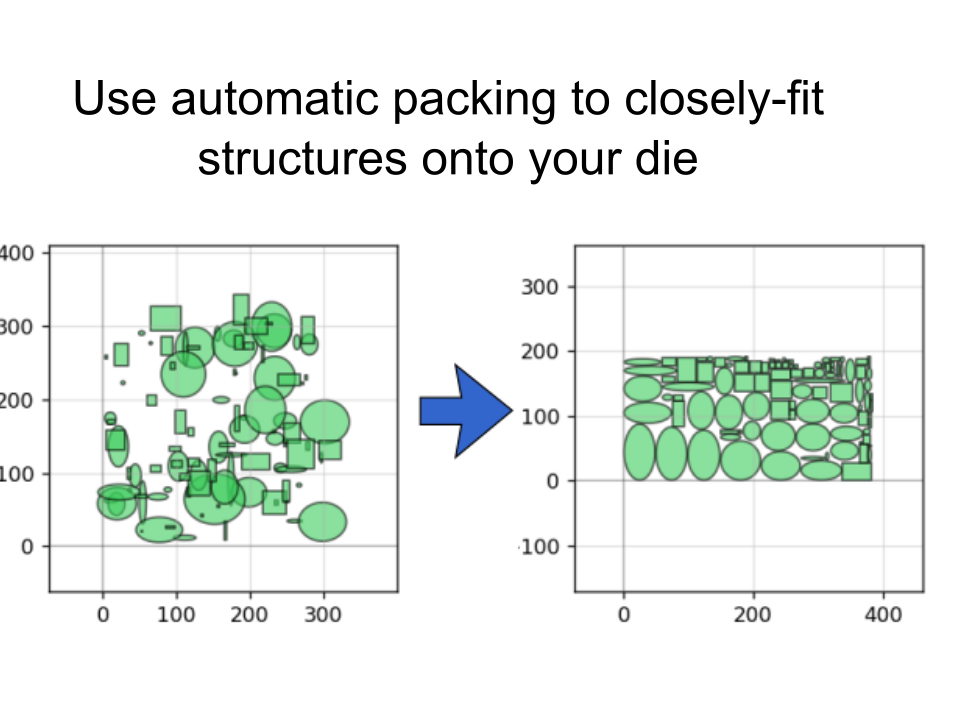
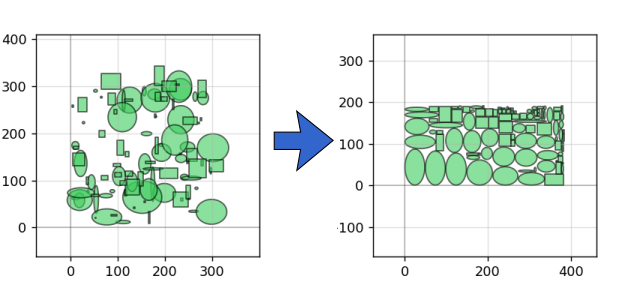
There are also handy functions to help pack shapes into as small an area as possible:
pg.packer(D_list, spacing = 1.25, aspect_ratio = (2,1))
