Add profiling support to the HAL API for use in benchmarks #45
Comments
|
1+ years on and progress is being made on this. New threading system will have statistics built-in and help me define the API we want to expose for this (likely something similar to feedback buffers). |
|
Maybe this year? :P |
|
Do you have some pointers on what would be needed to do to have tracy recoding Vulkan times and what would the result look like? On Android we have pretty much no useful tools for profiling within a command buffer. I hacked up some timestamp queries to be able to get a breakdown for mobile Bert but it is obviously not a sustainable solution. So this is probably our best bet to be able to do at least some basic profiling on phones and I can help out with implementation. |
|
I've got an old set of changes that enables Vulkan in tracy that I'll revive and get working. The issue I ran into last time (and what prevented me from committing it) was that tracy could not at the time render disjoint or overlapping zones, meaning that if there was any asynchronous or overlapping execution it would pad every zone out such that they were perfectly nested. I remember seeing that fiber support was getting added to tracy (in some form), and if it has landed then we can use that to allow the out-of-order zones. Otherwise, the tracy support only produces useful results if there's single dispatches between global barriers such that no two dispatches ever overlap and that's not very useful for anything but microbenchmarks (which could still be useful, but not general-purpose and with all the caveats of applicability microbenchmarks on GPUs have). |
|
Fiber support doesn't seem to have landed, but what we really want is wolfpld/tracy#149 - that's how I accomplished this in wtf and it worked really well. Unfortunately it looks like it's not planned work so I'm not sure what to do there. With the new feature allowing multiple GPU context tracks I can at least split up queues such that queues can overlap, but within each queue the numbers you'll be getting will not account for overlap :( |
|
I'm going to avoid doing any HAL work here and instead just add Vulkan support directly to the Vulkan HAL. When we want programmatic queries we'll need to add explicit APIs to the HAL but for just seeing timing in tracy we can avoid that. |
TLDR: configure with `-DIREE_ENABLE_RENDERDOC_PROFILING=ON`, pass the `--device_profiling_mode=queue` flag to the IREE tools, and launch the tools from the RenderDoc UI in order to get a capture (or use `renderdoccmd capture`): 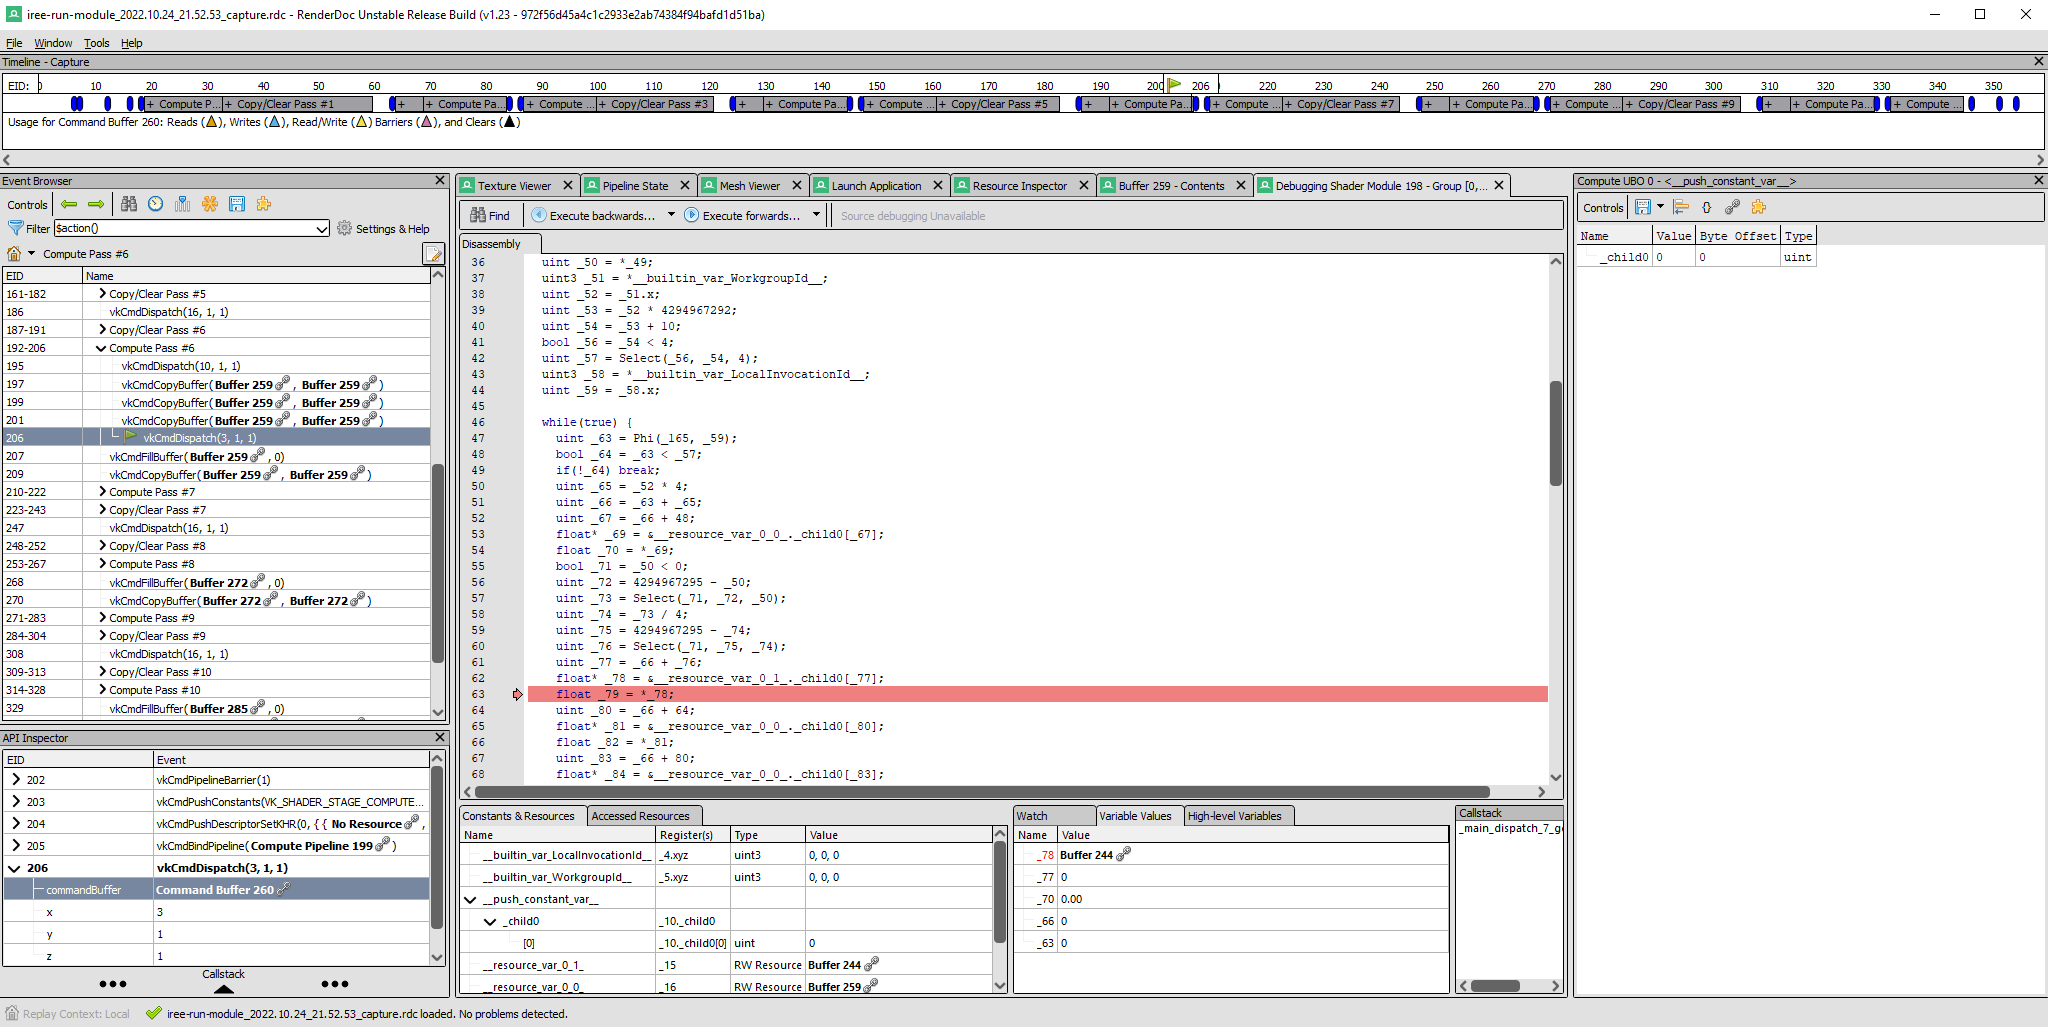 Things are set up to allow for other profiling modes in the future but how best to integrate those is TBD. We can figure out how to scale this with other tooling and on other backends but the rough shape of the API should be compatible with the various backend APIs we target (D3D/Metal/CUDA/Vulkan/perf/etc). Note that because RenderDoc will also capture D3D the cmake flag is generic but both the Vulkan and D3D HAL implementations will need to load it themselves (no real code worth sharing as D3D naturally only needs the Windows API query path). Docs have notes that I've verified on Windows. Someone looking to use this on Android will need to figure that out and can add what they find. Fixes #45. Forty five. Wow.
|
this was the year!!! thanks @benvanik |
Automatically created

Co-authored-by: OpenXLA Dep Roller <[email protected]>
We'll want a way to expose various metrics from the HAL implementations in a way that avoids excessive sequencer work. This could be accomplished by a begin/end profiling API and a resulting profile that contains cumulative, sampled, or averaged counter values per-backend. On Vulkan this may mean some vendor-specific performance counters in addition to timestamps inserted into command buffers.
The text was updated successfully, but these errors were encountered: