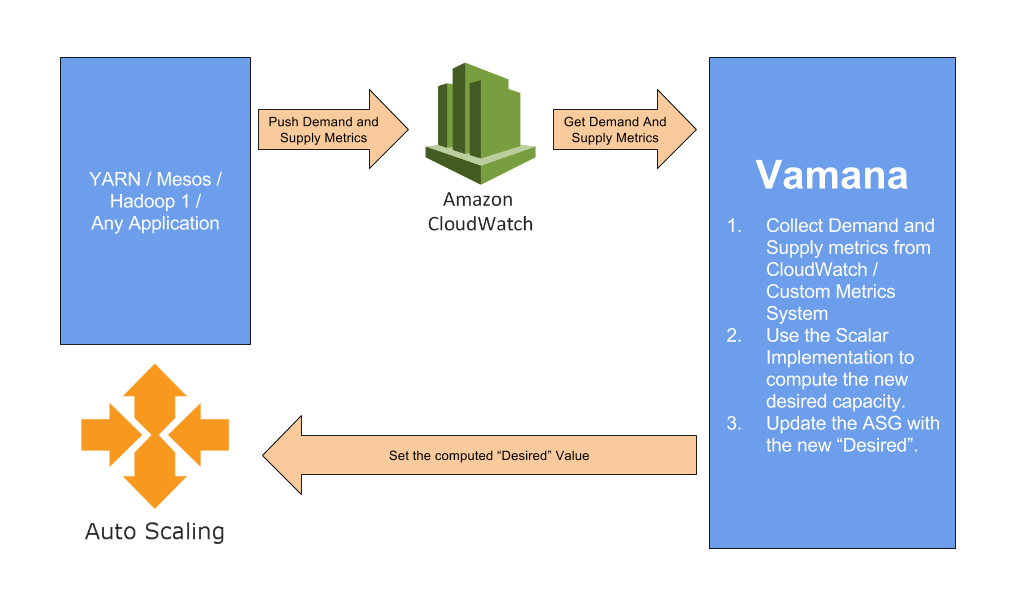
Vamana is an Autoscalar Abstraction that provides ability to scale clusters on the cloud. Vamana by itself doesn't do autoscaling (not yet), but uses the Autoscalar available on various cloud platforms. Some autoscalars on the cloud support scaling up / down based on application metrics collected on their platform. If you're already using a metric collection system you need not move away or send the same metrics to two different places instead Vamana can read metrics from any metrics store and perform autoscaling of your application.
I'm managing quite a number of Hadoop Cluster (across environments) whose TTs are backed by Auto Scaling Groups (ASG). Each cluster has its own usage patterns. Certain clusters run 24x7 while certain other clusters need to be up only during certain duration (when we have jobs running) and not always.
- We were forced to add Scale Up and Scale Down stages on the beginning and end of our job pipelines.
- Though using something like Anisble's ASG plugin made it trivial it was still a pain to add this everytime some one creates a new pipeline.
- It became a problem when we've more than 1 job pipelines sharing the same cluster, one's scale down shouldn't affect the other's runtime.
- Overnight / weekend failures makes the cluster remain idle.
Vamana is expected to be run on a Cron (with reasonable duration).
$ git clone https://github.com/ashwanthkumar/vamana2.git
$ cd vamana2 && mvn clean package
$ java -cp target/vamana2-1.0.0-SNAPSHOT.jar in.ashwanthkumar.vamana2.Vamana path/to/clusters.confSample configuration would be
vamana {
  clusters = [{
    # Name of the cluster
    name = "Hadoop1 Staging Cluster"

    # Identifier used by AutoScalar when resizing the cluster
    as-id = "as-hadoop-staging-spot"

    # Maximum number of nodes the cluster can scale upto
    max-nodes = 5

    # Minimum number of nodes in the cluster
    # We throw an RuntimeException if the Scalar returns less than this value
    min-nodes = 1

    metrics {
      # Metrics that represent your demand
      demand = ["map_count_demand", "reduce_count_demand"]

      # Metrics that represent your supply
      supply = ["map_count_supply", "reduce_count_supply"]

      # Namespace for your metrics (Optional)
      # Useful when using Amazon CloudWatch
      namespace = "Hadoop"

      # Dimension for your metrics (Optional)
      # Useful when using Amazon CloudWatch
      dimensions {
        name1 = "value1"
        name2 = "value2"
      }

      # Range of metrics to retrieve using collector
      range = "10m" # Range of metrics to retrieve
    }

    # Collector Implementation to use
    collector = "in.ashwanthkumar.vamana2.aws.CloudWatchCollector"

    # Autoscalar Implementation to use
    autoscalar = "in.ashwanthkumar.vamana2.aws.AutoScalingGroups"

    # Scalar Implementation to use
    scalar = "in.ashwanthkumar.vamana2.apps.HadoopScalar" # Use YARNScalar for YARN clusters
  }]
}
- Pluggable Metric Collector
- Amazon CloudWatch
- Pluggable Scalar
- Hadoop1 (works best with hadoop-as-publisher)
- YARN (works best with hadoop-as-publisher)
- Pluggable AutoScalar
- AutoScaling on AWS
- SpotFleet on AWS
- AutoScaler on GCE
Presentation "Introducing Vamana" shared with AWS Chennai Meetup October, 2015.
- http://techblog.netflix.com/2013/11/scryer-netflixs-predictive-auto-scaling.html - Closed source
- http://www.qubole.com/blog/product/industrys-first-auto-scaling-hadoop-clusters/ - Paid service
This project has been used in Production at Indix for more than 3 years for managing multiple Hadoop1 clusters with very good success. YARN Support has been added recently.
If you've any feature requests, please feel free to send a PR or create an issue.
Licensed under the Apache License, Version 2.0: http://www.apache.org/licenses/LICENSE-2.0
