This is a collection of R workflows to use Cytoscaep from R via cyREST app.
- 6/15/2015 - First release
- Mac OS X (tested on Yosemite)
- Windows (tested on Windows 8.1 64 bit)
- Linux (tested on Ubuntu 14.0.4)
- R (Tested on R version 3.2.0)
- Latest version of Java 8
- Cytoscape 3.2.1 or later
- RStudio
- Some of the examples are written in R Markdown format. RStudio is the best application to render and execute them.
In addition to main workflows, there are some small tutorials in rmarkdown directory. I recommend to try them first.
- Install all required software
- Start Cytoscape
- Open web browser and visit cyREST page in App Store
- Click Install button to directly install the App from this page
- Note: Do NOT install app from App menu. It installs older version of cyREST. This is a known bug in Cytoscape.
- Clone this repository
- Open the directory with RStudio
- Run
r_markdown/basic1.Rmdto start basic workflow
There are some workflow* R files in the top directory. They are designed to star from an empty Cytoscape session. To run these scripts, simply start Cytoscape and run the R script from R console. Make sure you installed all dependencies!
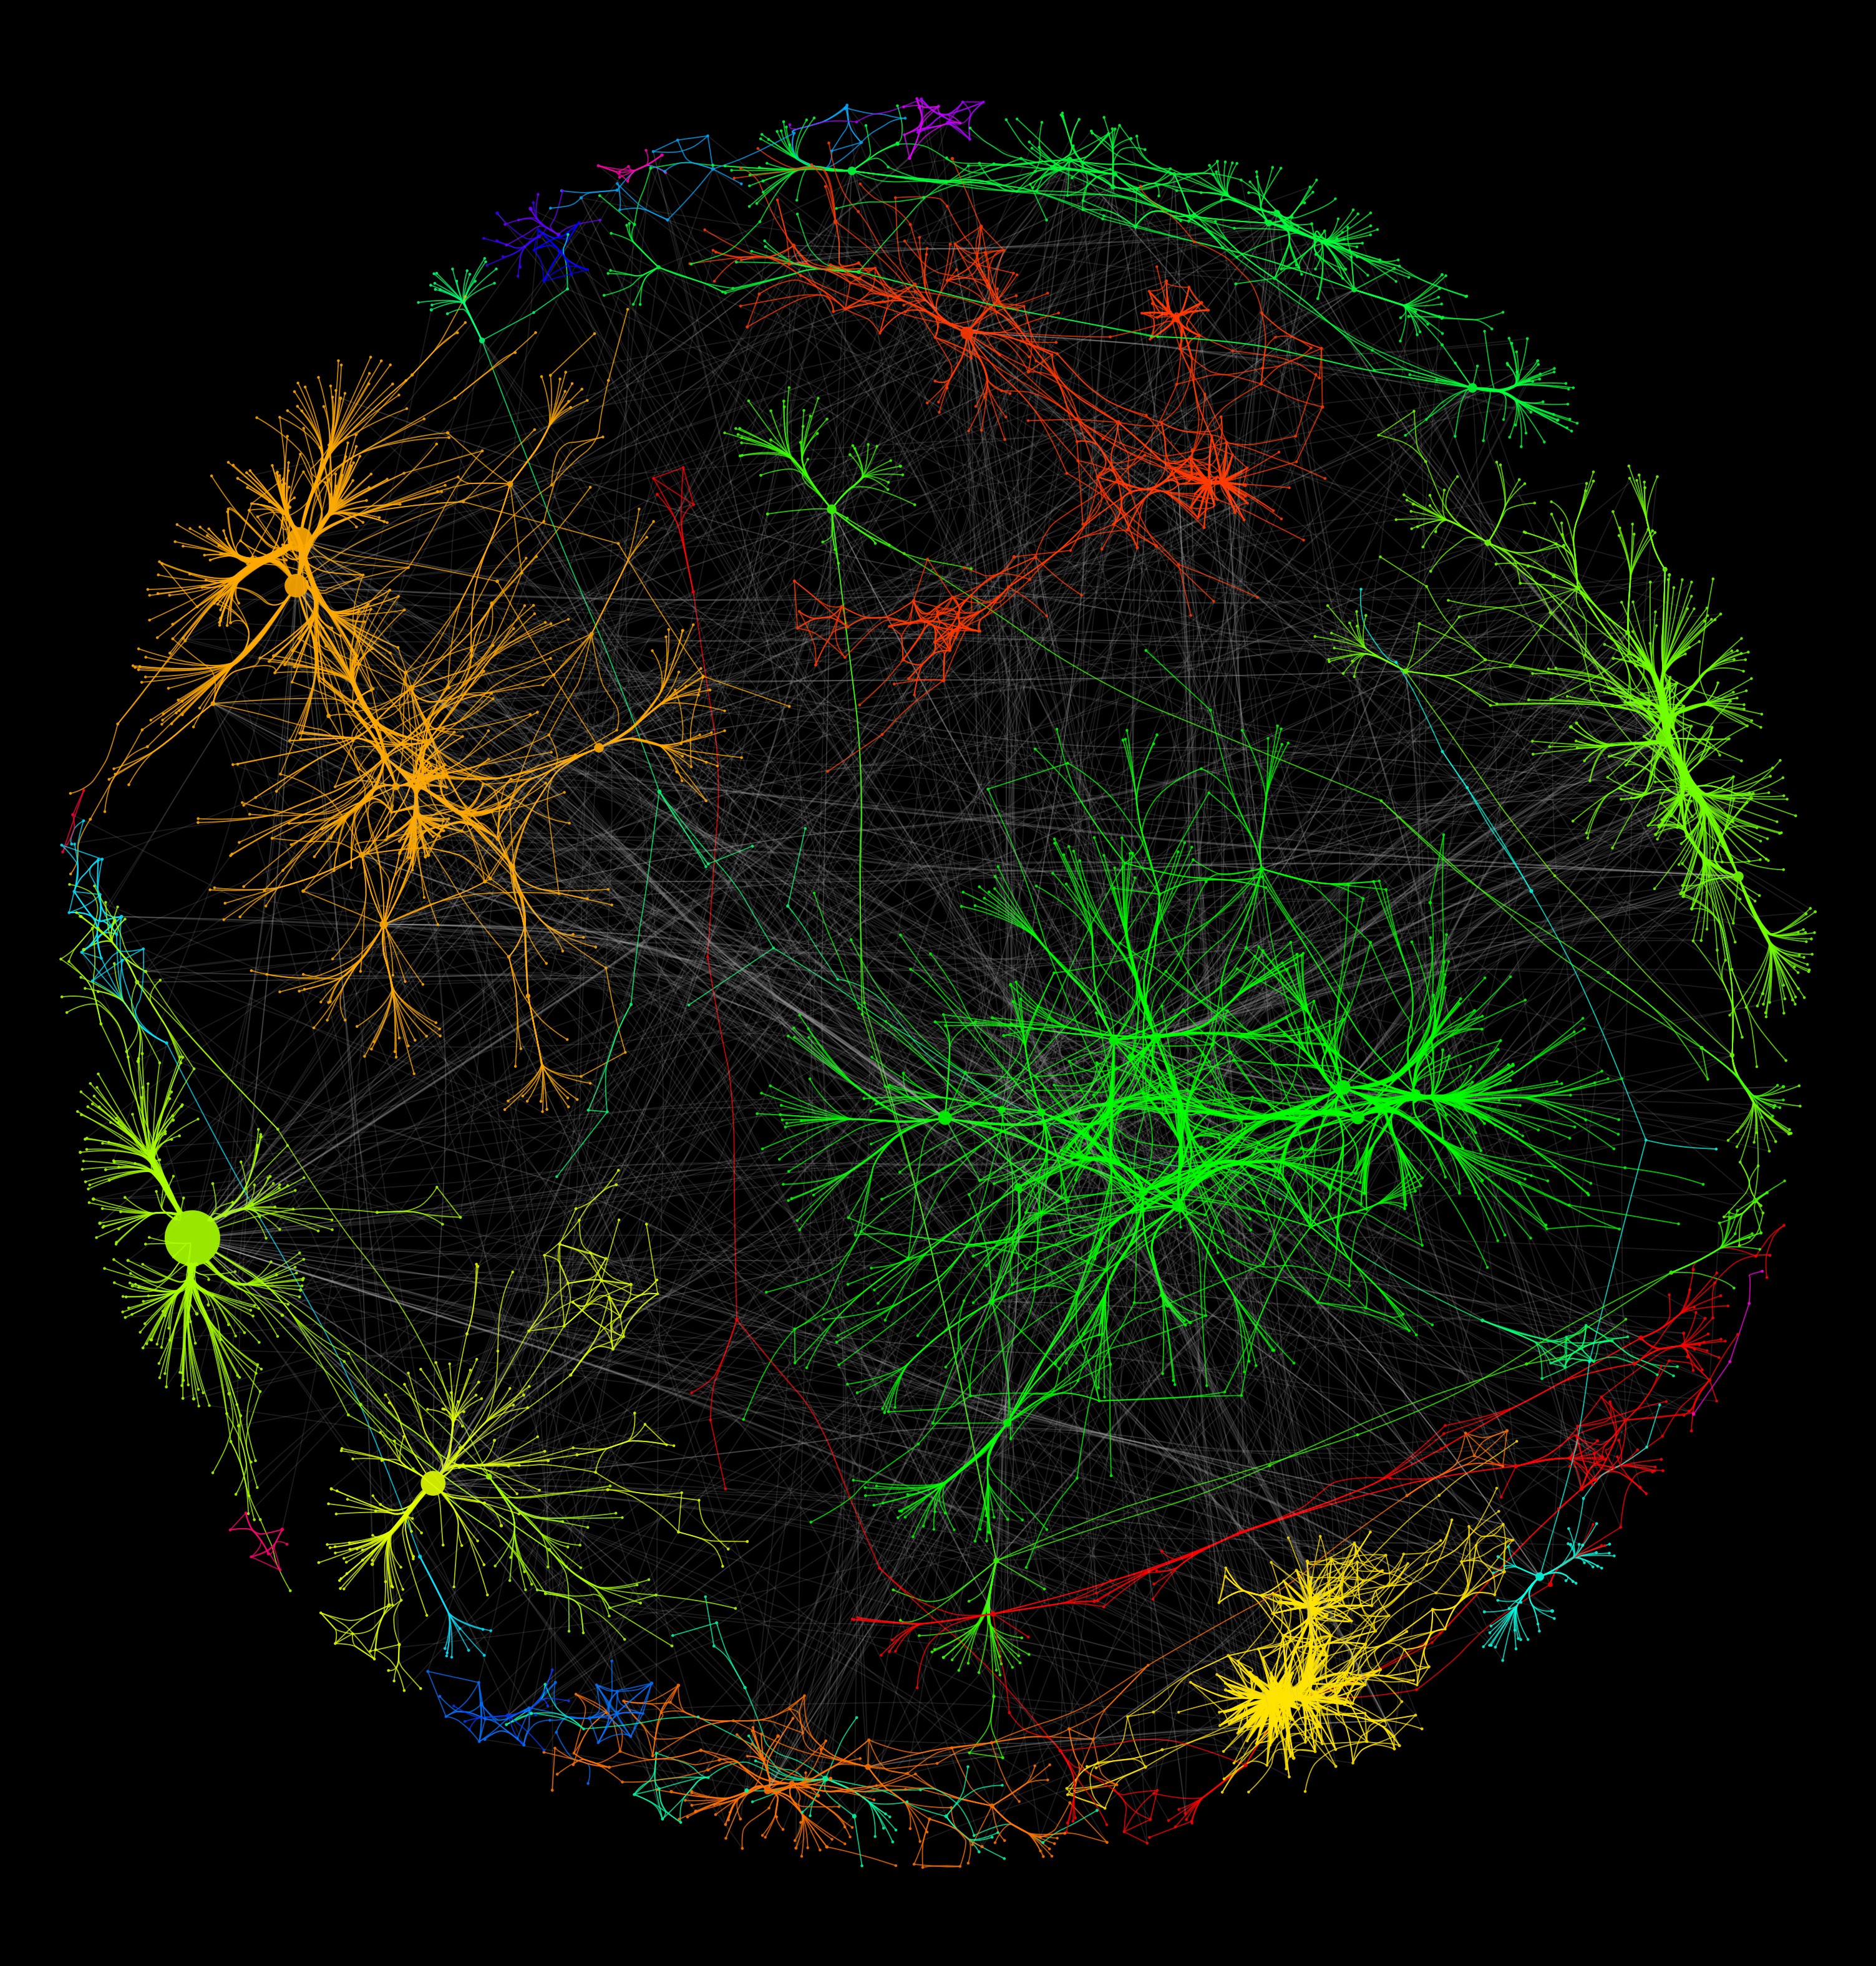
This workflow is designed to demonstrate how the combination of Cytoscape and igraph makes your network visualization better than manual visuaization. It executes the following steps automatically:
- Load SIF network file (yeast network)
- Extract largest connected component (subgraph)
- Remove duplicate edges
- Calculate basic statistics including:
- Betweenness
- PageRank
- Edge Betweenness
- Find community structures using multiple algorithms
- Convert it into Cytoscpae-conpatible JSON
- Generate visual style using statistics and community structure calculated above
- Send the data to Cytoscape
- Run Kamada-Kawai layout algorithm using community structure
- Visualize it
You can use your own network if you want.
- Start Cytoscape (w/ latest version of cyREST installed)
- Start RStudio
- Run workflow1_structure_based_visualization.R
This is a simple script to import HumanNet interactome data from their web site, and add some extra annotations using Bioconductor packages. It automatically generates subgraphs using chromosome name (1-22, X/Y, and mitocondrial DNA).
To run this workflow, you need to install some Bioconductor libraries first.
(TBD)
(TBD)
These examples are using low-level, raw cyREST API. It provides full access to most of the data objects, but you need a lot of boilerplate code to do simplu stuff. To avoid this issue, RCytoscape group is working on next generation of RCytoscape using cyREST as its backend:
Once this is ready, we'll add more examples using this Bioconductor package.
Please contact me (kono at ucsd edu).
© Keiichiro Ono (UC, San Diego Trey Ideker Lab)
Source code license: MIT
Texts and images are licensed under CC BY 4.0

