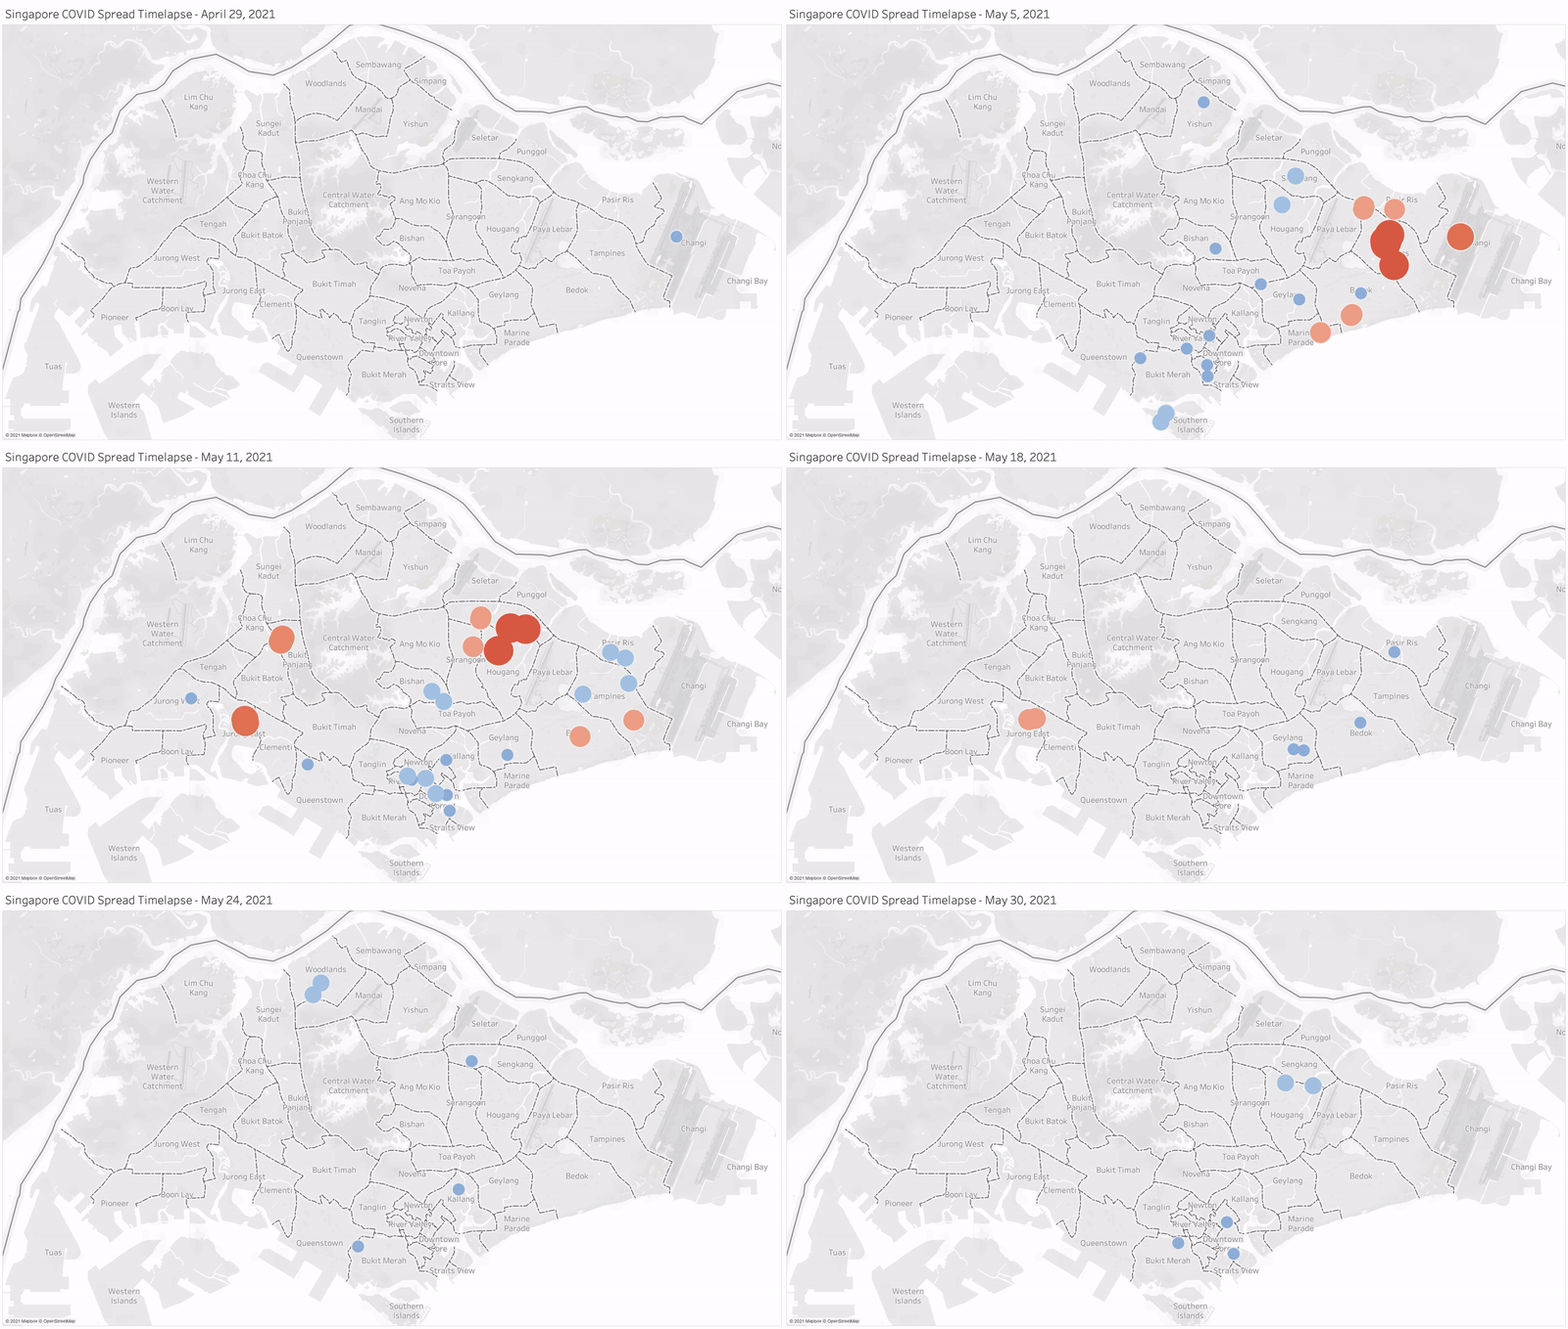
The jupyter notebook in this repository prepares data for a Tableu visualisation showing the spread of COVID-19 in Singapore across time.
Note: The data in this repository and the above visualisation is only updated until May 2021. To view the code for automated data preparation for the up-to-date Singapore COVID-19 Spread Tableau visualisation, visit the SG COVID-19 Spread Visualisation Data Preparation (Automated) repository instead.
