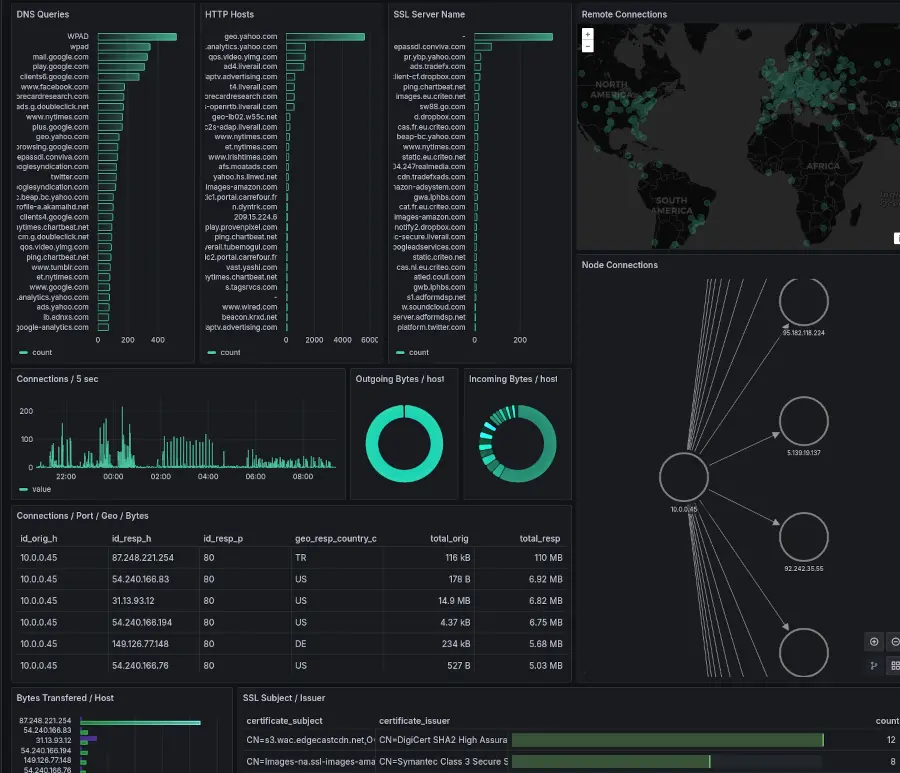
This repository provides a quick way to get started using Zeek with a practical use case. The focus is to analyse a network pcap and enable easy visual analysis using Grafana Charts.
The mini project consists of three parts.
-
Custom Zeek Docker build that generates zeek log files with GeoIP, ASN and JA3 / JA4 fingerprints.
-
Python Script to convert zeek log files to an SQLite database.
-
Custom Grafana Docker build with a pre-configured dashboard for analysing Zeek Data.
Keeping this project simple and broken up into three parts should help both Zeek newcomers and those with more experience get up and running quickly. Working from these base images it would be an easy task to add other packages, and extend the dashboard to suit your own environment or use case.
A two part article is available that goes into more detail about the project and getting started.
Zeek with GeoIP, ASN & JA4 in 5 minutes
The project is structured to use Docker containers for easy setup and portability. It includes a customized Zeek container for log generation and a Grafana container for data visualization.
- Dockerfile: Located at
./pcap-did-what/zeek-docker/Dockerfile, this file creates a Docker container based on the official Zeek image. It includes the installation of necessary packages for JA3 / JA4 fingerprinting and GeoIP, with a custom script for ASN enrichment. - local_asn.zeek:
./pcap-did-what/zeek-docker/local_asn.zeek, a small zeek script to add ASN information to the conn.log. The script uses the builtin zeek function (lookup_autonomous_system). - docker-compose.yml: Found in
./pcap-did-what/grafana-docker/docker-compose.yml, this Docker Compose file sets up the Grafana container, configuring it to use a custom SQLite datasource and including volumes for persistent storage and configuration. - dashboard.yml: Located at
./pcap-did-what/grafana-docker/dashboards/dashboard.yml, this configuration file specifies the dashboard provider settings for Grafana. - datasource.yml: Found in
./pcap-did-what/grafana-docker/datasources/datasource.yml, this file configures Grafana to use an SQLite database as the data source, pointing to the Zeek logs stored in SQLite format. - GeoLite2-ASN.mmdb: Place in
./pcap-did-what/zeek-docker/- required file needed to be downloaded from MaxMind. - GeoLite2-City.mmdb: Another required file from MaxMind. Register Free and Download file to
zeek-docker.
To get started with this setup, ensure you have Docker and Docker Compose installed on your system.
Requirement - You will need the MaxMind GeoIP and ASN databases, these require registration (free) and a download of the two files from MaxMind. Place in zeek-docker.
Follow these steps to deploy the environment:
- Clone this repository
git clone https://github.com/hackertarget/pcap-did-what.git
- Build Zeek Docker Image
From the ./pcap-did-what/ build zeek image.
cd zeek-docker
sudo docker build -t zeek-custom .
Running the docker will drop you into bash. From bash it is possible to generate the zeek logs and convert them to sqlite db.
# zeek -C -r /data/test.pcap local
# zeek-to-sqlite.py
- Start the Grafana Container
Use docker-compose to start the Grafana container:
cd ../grafana-docker
sudo docker-compose up -d
- Accessing Grafana: Once the containers are up and running, access the Grafana dashboard through your web browser:
http://localhost:3000
Use the default Grafana credentials (admin/admin) unless changed in the configuration. The dashboard should be loaded but there will be likely no data unless the zeek_log.db file has been generated and is in place.
- You can modify the
Dockerfileto include additional Zeek scripts or alter the existing configuration to suit your network analysis requirements. - The Grafana dashboard and data source configurations can be adjusted in
dashboard.ymlanddatasource.ymlrespectively, allowing for further customization of how data is displayed. - zeek-to-sqlite.py uses a hardcoded /data/ path to match the build. Modify this as required.
- The local_asn.zeek script could be used to learn more about zeek scripting or extend it to populate other log files.
Thanks to Zeek and Grafana for making high quality open source software.
Also, thanks to Christos @ Threat Hunting Tails for the ASN information and asn.zeek script.
