-
Notifications
You must be signed in to change notification settings - Fork 13
Views Datasource
Do you want to visualise data from Drupal content, this can be achieved by using Views to create your datasets, outputting as JSON, then providing the JSON URL to DVF. This page will show an example of how that might be done.
Before you start, read the JSON Datasource page to understand how DVF reads JSON documents. Then
setup a DVF field as per its instructions, the only difference being, make sure you use the field type
Visualisation URL and not Visualisation File.
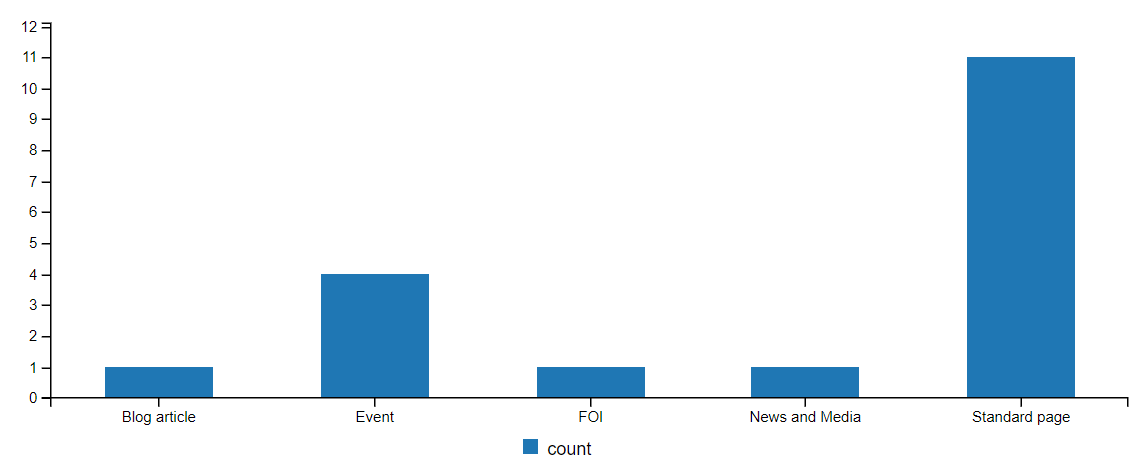
In this example, we will make a view that shows a Bar Chart that shows a count of different content types in Drupal.
The goal is to get views outputting something like below, when you visit the path /content-types.json
[
    {
        "type": "Blog article",
        "count": "1"
    },
    {
        "type": "Event",
        "count": "4"
    },
    {
        "type": "FOI",
        "count": "1"
    },
    {
        "type": "News and Media",
        "count": "1"
    },
    {
        "type": "Standard page",
        "count": "11"
    },
]There a few ways to output JSON in views, most require additional modules, for this example, we will just use Drupal
core REST module. Enable the following modules:
- RESTful Web Services
- REST UI
- Serialization
- Add a new view, give it a name and check
Provide REST export, set the path to becontent-types.jsonthen Save and edit - Make the following changes
- Format > Settings - check "JSON"
- Format > Show - Fields
- Advanced > Use aggregation - yes
- Remove all fields, filters, sorts
- Add Fields
- Content type (Aggregation type = Group results together, Uncheck link label to referenced entity)
- ID (Aggregation type = Count)
- Format > Show > Field Settings, add an alias for each, eg type = name, nid = count
Save and visit content-types.json, you should see your JSON view
- Create new content which has a
Visualisation URL JSON Filefield on it. - Add the path
/content-types.json- DVF will turn this into an absolute URL internally - Select
Bar ChartunderVisualisation style - Select
countunderFields(as per your alias in views) - Axis settings > X Axis > Tick values field select
name(as per your alias in views)
Save and view, it should look something like this
