runtime: scheduler is slow when goroutines are frequently woken #18237
Comments
|
@philhofer, any chance you could try Go 1.8beta1? Even if a bug were found in Go 1.7, that branch is closed for all but security issues at this point. Go 1.8 should be a drop-in replacement for 1.7. See https://beta.golang.org/doc/go1.8 for details. The SSA back end for ARM will probably help your little devices a fair bit. See https://dave.cheney.net/2016/11/19/go-1-8-toolchain-improvements |
|
(Tagging this Go 1.9, unless you can reproduce on 1.8 and @aclements thinks it's easily fixable enough for 1.8) |
|
@pilhofer. I'd be keen to see the .svg versions of those profiles if you
are able to attach them to the issue.
…On Thu, Dec 8, 2016 at 7:25 AM, Brad Fitzpatrick ***@***.***> wrote:
@philhofer <https://github.com/philhofer>, any chance you could try Go
1.8beta1? Even if a bug were found in Go 1.7, that branch is closed for all
but security issues at this point.
Go 1.8 should be a drop-in replacement for 1.7. See
https://beta.golang.org/doc/go1.8 for details. The SSA back end for ARM
will probably help your little devices a fair bit. See
https://dave.cheney.net/2016/11/19/go-1-8-toolchain-improvements
—
You are receiving this because you are subscribed to this thread.
Reply to this email directly, view it on GitHub
<#18237 (comment)>, or mute
the thread
<https://github.com/notifications/unsubscribe-auth/AAAcA3CKeXoytI49tHLwYxgUG6n5H54xks5rFzJJgaJpZM4LHL5e>
.
|
|
@bradfitz Yes, we're busy trying to get 1.8beta1 on some hardware to benchmark it. We're very excited about the arm performance improvements. (However, these profiles are on an Intel Xeon host, which I presume will perform similarly between 1.7 and 1.8, unless there have been substantial changes made to the scheduler that I missed?) @davecheney Yes; I'll try to post a slightly-redacted one. |
|
Update: most of the scheduler activity is caused by blocking network reads. The call chain goes across two call stacks, which makes it a little tough to track down through stack traces alone, but here it is:
The raw call counts suggest that roughly 90% of the @davecheney I haven't extracted our profile format into the pprof format yet, but I hope that answers the same question you were hoping the svg web would answer. |
Oh, sorry, missed that. In any case, please test 1.8 wherever possible in the next two weeks. It's getting increasingly hard to make changes to 1.8. The next two weeks are the sweet spot for bug reports. Thanks! |
|
We just finished our first set of runs on 1.8, and things look pretty much identical on our x86 machines. |
|
@aclements, what's the status here? |
|
Ping @aclements |
|
I have a little more information, in case you're interested. Fundamentally, the issue here is that Now, in a sane world we could wire up So, part of this is Linux's fault, and part of it is caused by the scheduler being generally slow. (Consider: in that profile, we spend nearly twice as much time in the scheduler as we do checksumming every single byte received over the network.) |
|
Thanks for the extra information, @philhofer. That's very useful in understanding what's going on here. Given how much time you're spending in I'm not really sure what to do about this. It would at least help confirm this if you could post an execution trace (in this case, a sufficiently zoomed-in screen shot is probably fine, since there's no easy way to redact the stacks in an execution trace). |
|
I have a similar issue, with no network involved. My project performs application protocol analysis against a libpcap capture. Different pools of goroutines perform reading the raw trace from disk, packet parsing, and TCP/IP flow reassembly. CPU profiling indicates > 25% of total time spent in @aclements description does not appear to fit my situation, since more data is always available throughout a run. Whenever individual goroutines block, it's because they have just dispatched work to one or more goroutines further down the pipeline. I'm running The project is open-source, so I can point you to the source and the SVG profiles generated from my perf tests. Would that be helpful, and would it be better to keep in this issue or file a new one? |
|
The project is open-source, so I can point you to the source and the SVG
profiles generated from my perf tests. Would that be helpful, and would it
be better to keep in this issue or file a new one?
Please file a new issue. If it turns out this is a duplicate we can merge
them. Thanks
…On Wed, Jan 3, 2018 at 10:22 AM, mspielberg ***@***.***> wrote:
I have a similar issue, with no network involved.
My project performs application protocol analysis against a libpcap
capture. Different pools of goroutines perform reading the raw trace from
disk, packet parsing, and TCP/IP flow reassembly. CPU profiling indicates >
25% of total time spent in findrunnable. I'm running on 64-bit OSX, so
most of that time is in kevent.
@aclements <https://github.com/aclements> description does not appear to
fit my situation, since more data is always available throughout a run.
Whenever individual goroutines block, it's because they have just
dispatched work to one or more goroutines further down the pipeline.
I'm running go version go1.9.1 darwin/amd64.
The project is open-source, so I can point you to the source and the SVG
profiles generated from my perf tests. Would that be helpful, and would it
be better to keep in this issue or file a new one?
—
You are receiving this because you were mentioned.
Reply to this email directly, view it on GitHub
<#18237 (comment)>, or mute
the thread
<https://github.com/notifications/unsubscribe-auth/AAAcA_493m6y3ni9ZWgPPnkt2c3WgXU-ks5tGrorgaJpZM4LHL5e>
.
|
|
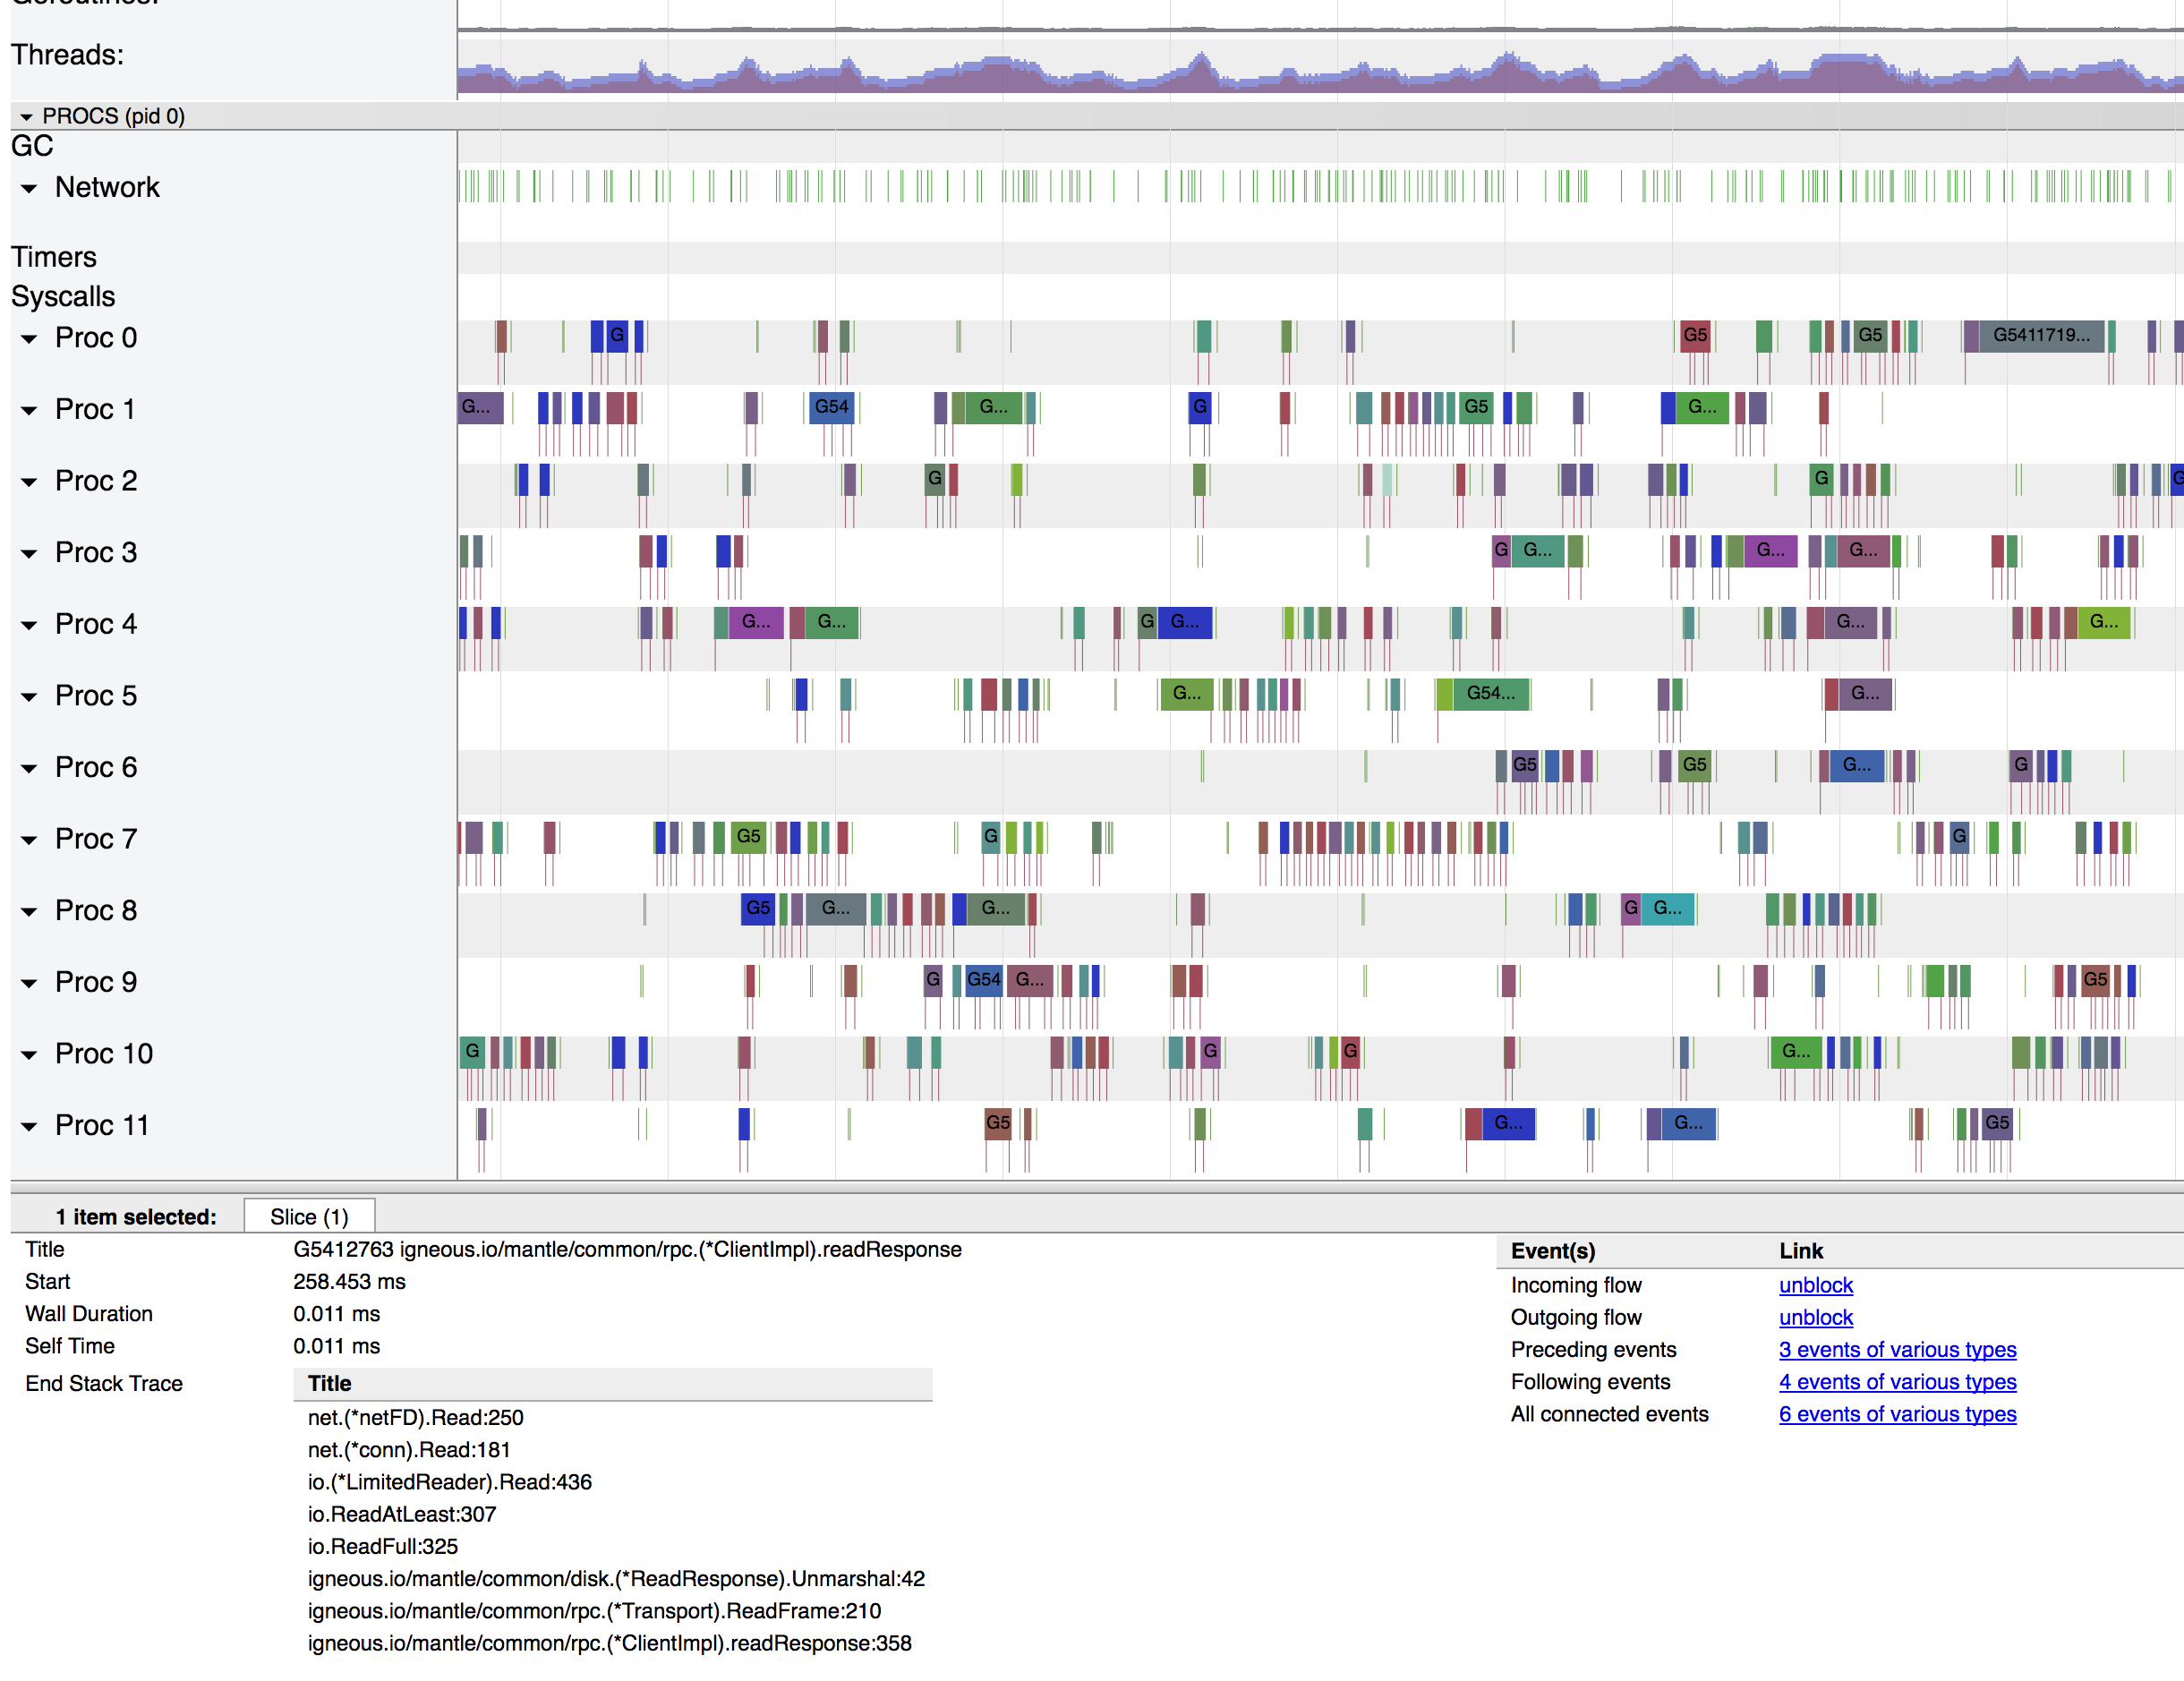
I was able to capture a trace of the original issue @philhofer described and wanted to add the requested screenshots to verify that this is the scheduler worst case scenario described by @aclements. Though the profiling samples nicely show the time being spent in From a macro view, here's about 40ms total: Most of the tiny slivers are network wake-ups to read an MTU off a particular socket, but not enough data to fill the desired buffer (think 1500 MTU but 64k desired buffers). The burst of longer operations on the right is processing that happened when enough data has been received to do higher level work with the data (Reed-Solomon computation in this case). Next screenshot is a zoom in to the small goroutine section (~2ms total): I've selected a tiny slice and that's the identical stack across all the very small routines. I think this tells the story of the scheduler constantly going idle, then being woken up by the network. Also willing to post some screenshots like this, if there's more specific questions. |

|
Change https://golang.org/cl/259578 mentions this issue: |
|
Change https://golang.org/cl/264477 mentions this issue: |
Work stealing is a scalability bottleneck in the scheduler. Since each P
has a work queue, work stealing must look at every P to determine if
there is any work. The number of Ps scales linearly with GOMAXPROCS
(i.e., the number of Ps _is_ GOMAXPROCS), thus this work scales linearly
with GOMAXPROCS.

Work stealing is a later attempt by a P to find work before it goes
idle. Since the P has no work of its own, extra costs here tend not to
directly affect application-level benchmarks. Where they show up is
extra CPU usage by the process as a whole. These costs get particularly
expensive for applications that transition between blocked and running
frequently.

Long term, we need a more scalable approach in general, but for now we
can make a simple observation: idle Ps ([1]) cannot possibly have
anything in their runq, so we need not bother checking at all.

We track idle Ps via a new global bitmap, updated in pidleput/pidleget.
This is already a slow path (requires sched.lock), so we don't expect
high contention there.

Using a single bitmap avoids the need to touch every P to read p.status.
Currently, the bitmap approach is not significantly better than reading
p.status. However, in a future CL I'd like to apply a similiar
optimization to timers. Once done, findrunnable would not touch most Ps
at all (in mostly idle programs), which will avoid memory latency to
pull those Ps into cache.

When reading this bitmap, we are racing with Ps going in and out of
idle, so there are a few cases to consider:

1. _Prunning -> _Pidle: Running P goes idle after we check the bitmap.
In this case, we will try to steal (and find nothing) so there is no
harm.

2. _Pidle -> _Prunning while spinning: A P that starts running may queue
new work that we miss. This is OK: (a) that P cannot go back to sleep
without completing its work, and (b) more fundamentally, we will recheck
after we drop our P.

3. _Pidle -> _Prunning after spinning: After spinning, we really can
miss work from a newly woken P. (a) above still applies here as well,
but this is also the same delicate dance case described in findrunnable:
if nothing is spinning anymore, the other P will unpark a thread to run
the work it submits.

Benchmark results from WakeupParallel/syscall/pair/race/1ms (see
golang.org/cl/228577):

name                            old msec          new msec   delta
Perf-task-clock-8               250 ± 1%          247 ± 4%     ~     (p=0.690 n=5+5)
Perf-task-clock-16              258 ± 2%          259 ± 2%     ~     (p=0.841 n=5+5)
Perf-task-clock-32              284 ± 2%          270 ± 4%   -4.94%  (p=0.032 n=5+5)
Perf-task-clock-64              326 ± 3%          303 ± 2%   -6.92%  (p=0.008 n=5+5)
Perf-task-clock-128             407 ± 2%          363 ± 5%  -10.69%  (p=0.008 n=5+5)
Perf-task-clock-256             561 ± 1%          481 ± 1%  -14.20%  (p=0.016 n=4+5)
Perf-task-clock-512             840 ± 5%          683 ± 2%  -18.70%  (p=0.008 n=5+5)
Perf-task-clock-1024          1.38k ±14%        1.07k ± 2%  -21.85%  (p=0.008 n=5+5)

[1] "Idle Ps" here refers to _Pidle Ps in the sched.pidle list. In other
contexts, Ps may temporarily transition through _Pidle (e.g., in
handoffp); those Ps may have work.

Updates #28808
Updates #18237

Change-Id: Ieeb958bd72e7d8fb375b0b1f414e8d7378b14e29
Reviewed-on: https://go-review.googlesource.com/c/go/+/259578
Run-TryBot: Michael Pratt <[email protected]>
TryBot-Result: Go Bot <[email protected]>
Reviewed-by: Michael Knyszek <[email protected]>
Reviewed-by: Austin Clements <[email protected]>
Trust: Michael Pratt <[email protected]>
|
Change https://golang.org/cl/264697 mentions this issue: |
Following golang.org/cl/259578, findrunnable still must touch every
other P in checkTimers in order to look for timers to steal. This scales
poorly with GOMAXPROCS and potentially performs poorly by pulling remote
Ps into cache.

Add timerpMask, a bitmask that tracks whether each P may have any timers
on its timer heap.

Ideally we would update this field on any timer add / remove to always
keep it up to date. Unfortunately, updating a shared global structure is
antithetical to sharding timers by P, and doing so approximately doubles
the cost of addtimer / deltimer in microbenchmarks.

Instead we only (potentially) clear the mask when the P goes idle. This
covers the best case of avoiding looking at a P _at all_ when it is idle
and has no timers. See the comment on updateTimerPMask for more details
on the trade-off. Future CLs may be able to expand cases we can avoid
looking at the timers.

Note that the addition of idlepMask to p.init is a no-op. The zero value
of the mask is the correct init value so it is not necessary, but it is
included for clarity.

Benchmark results from WakeupParallel/syscall/pair/race/1ms (see
golang.org/cl/228577). Note that these are on top of golang.org/cl/259578:

name                        old msec           new msec   delta
Perf-task-clock-8           244 ± 4%           246 ± 4%     ~     (p=0.841 n=5+5)
Perf-task-clock-16          247 ±11%           252 ± 4%     ~     (p=1.000 n=5+5)
Perf-task-clock-32          270 ± 1%           268 ± 2%     ~     (p=0.548 n=5+5)
Perf-task-clock-64          302 ± 3%           296 ± 1%     ~     (p=0.222 n=5+5)
Perf-task-clock-128         358 ± 3%           352 ± 2%     ~     (p=0.310 n=5+5)
Perf-task-clock-256         483 ± 3%           458 ± 1%   -5.16%  (p=0.008 n=5+5)
Perf-task-clock-512         663 ± 1%           612 ± 4%   -7.61%  (p=0.008 n=5+5)
Perf-task-clock-1024      1.06k ± 1%         0.95k ± 2%  -10.24%  (p=0.008 n=5+5)

Updates #28808
Updates #18237

Change-Id: I4239cd89f21ad16dfbbef58d81981da48acd0605
Reviewed-on: https://go-review.googlesource.com/c/go/+/264477
Run-TryBot: Michael Pratt <[email protected]>
TryBot-Result: Go Bot <[email protected]>
Reviewed-by: Michael Knyszek <[email protected]>
Trust: Michael Pratt <[email protected]>
|
Change https://golang.org/cl/266367 mentions this issue: |
In golang.org/cl/264477, I missed this new block after rebasing past
golang.org/cl/232298. These fields must be zero if there are no timers.

Updates #28808
Updates #18237

Change-Id: I2d9e1cbf326497c833daa26b11aed9a1e12c2270
Reviewed-on: https://go-review.googlesource.com/c/go/+/266367
Run-TryBot: Michael Pratt <[email protected]>
Reviewed-by: Austin Clements <[email protected]>
Reviewed-by: Ian Lance Taylor <[email protected]>
Reviewed-by: Michael Knyszek <[email protected]>
TryBot-Result: Go Bot <[email protected]>
Trust: Michael Pratt <[email protected]>
|
Hello gophers. We have a similar issue — mcall, findrunnable, schedule excessively consume CPU time (mcall is up to 75% on stack). The application itself consumes 30-50% CPU while it mainly should be in I/O wait. The application is basically a proxy with tiny additional logic (receive 20 bytes packets over TCP/IP, accumulate up to 500 bytes and send it again over TCP/IP). What makes it worse in our case, that mcall/findrunnable are very aggressive, to the point where the application is mainly running runtime functions, and our own code gets delayed so that we see a very visible lag up to seconds. The issue described by @philhofer is not applicable in our case, we read and write relatively small (should be below 1500) packets, and increasing packet size (batch write / batch read) seems to decrease the CPU consumption. We use simple protocol on top of TCP/IP: Please let me know if you need full profile or source code. |
|
@aka-rider What CPU, and OS, and version of Go did this profile come from? The amount of time spent in |
|
@aka-rider In addition to Chris' questions, could you describe the application a bit more? In particular:
I'm particularly curious about the last question, as you mention "lag up to seconds", yet your profile only shows 118s of CPU on 300s wall-time. i.e., less than 1 CPU of work on average. Unless the system is under heavy load, I wouldn't expect to see such extreme latency, which may be indicative of a scheduling bug rather than overall performance (what this issue is about). |
|
I forgot to mention that Go 1.16 will include several timer overhead improvements, so if you can test on tip (if this isn't already on tip), that would be helpful. |
|
Hi @ChrisHines We running virtual machines in KVM: I agree, nanotime also bothers me. I came across this ticket #27707, and the following snippet: package main
import (
"time"
)
func main() {
for {
time.Sleep(time.Millisecond)
}
}consumes ~10% CPU on our cluster (it's < 2% CPU on my Mac and my colleague's Ubuntu laptop) |
|
Hi @prattmic We have 1 goroutine per incoming connection (receive), 1 goroutine per outgoing connection (async send) The number of connections is 10-200. Interestingly, the CPU consumption doesn't depend on the number of connections too much — it's ~0% with 0 connections, 30% with one connection, 30-50% with 200 connections. This particular profile comes from our development environment, the amount of connections was ~6-8, and machine was not busy. We used to see significant delays with increased number of connections. I tried GOMAXPROCS 1, 2, 5, 20, 50 — and it doesn't seem to change anything. The initial design was using channels. Every read goroutine would write received data to a single buffered channel Right now, we use circular buffer with mutex — all receiving goroutines write into it, one goroutine reads from it, and communication with send goroutines is the same, except is buffer+mutex per sending goroutine. I also tried to get rid of asynchronous send goroutines, and write to TCP directly from the processing goroutine, it increased the CPU consumption from 30% to 50% for a single connection. It makes me think that it specifically TCPConn.Write (and maybe Read) cause this behavior. |
|
@aka-rider lots of time in I don't know of a handy way to see which clock is in besides reading it directly from a program. https://gist.github.com/prattmic/a9816731294715426d7b85eb091d0102 will dump out the VDSO parameter page, from which on my system I can see the clock mode at offset 0x80 is 0x1 (VDSO_CLOCKMODE_TSC), which is what I want. (Offset and location varies depending on kernel version...). All of this is quite a bit of a tangent from the issue at hand, though, as even a slow VDSO shouldn't be causing this much trouble. I'll take a look at the rest of your summary tomorrow. |
|
Hi @prattmic |
|
With gotip the CPU profile and consumption is very similar to what it was before |
|
It does seem that your system is using VCLOCK_PVCLOCK instead of TSC, though looking at the implementation it seems pretty efficient except for the VCLOCK_NONE case, which the comment says will only affect Xen, not KVM. I still don't think the clock source is really the underlying problem here, but it may be interesting if you can run this workload in a non-virtualized environment to see if it behaves better. More importantly, I now notice that the entry point to ~90% of your time in the scheduler is due to calls to |
|
Thank for your suggestion @prattmic.
It seems to behave better on non-virtualized environment, although it's hard to reproduce the exact workload. Lab benchmarks on our laptops don't have the same CPU consumption. I had the following in my code (in the next lines there's a call to for cycles := 0; cycles < 10000; cycles++ {
if payload, stream, err = s.dequeue(p); err != nil || payload != nil {
return
}
runtime.Gosched()
}The following profile with the code above commented out: The CPU consumption stays roughly the same — about 30% |
|
Ah, this looks better. Not better that usage isn't down much, but better in that it now looks like the symptoms that this issue was originally intended to address. i.e., this now looks like there may be lots of fast cycles between idle and active, where the scheduler is spending lots of time futilely trying to find work, then finally going to sleep only to be re-woken almost immediately. Is there a particular reason you need that To help verify the above behavior, could you provide the full pprof profile for this run? Plus a runtime trace? You may need to make the run fairly short if the trace is unreasonably large. |
|
Hi.
Right now the application behaves well without it, so it can go. The reason it was added is because waiting on chan could left a goroutine sleeping for too long. It seems like waiting on a Cond is better in that sense. pprof.buffer.samples.cpu.008.pb.gz I will think of how to get the trace from Docker container. |
|
In general the Go scheduler reacts badly to any kind of busy loop, whether implemented with |
Thanks for letting me know @ianlancetaylor Please find the attached trace |
It looks like this was fixed starting with 2.6.28:
So I wonder if it's possible to implement that fix now? |
The most recently goready()'d G on each P is given a special position in
the P's runqueue, p.runnext. Other Ps steal p.runnext only as a last
resort, and usleep(3) before doing so: findRunnable() => stealWork() =>
runqsteal() => runqgrab(). As documented in runqgrab(), this is to
reduce thrashing of Gs between Ps in cases where one goroutine wakes another
and then "almost immediately" blocks.
On Linux, usleep() is implemented by invoking the nanosleep system call.
Syscall timeouts in the Linux kernel are subject to timer slack, as
documented by the man page for syscall prctl, section
"PR_SET_TIMERSLACK". Experimentally, short timeouts can expect to expire
50 microseconds late regardless of other system activity. Thus, on
Linux, usleep(3) typically sleeps for at least 53 microseconds, more
than 17x longer than intended.
A P must be in the spinning state in order to attempt work-stealing.
While at least one P is spinning, wakep() will refuse to wake a new
spinning P. One P sleeping in runqgrab() thus prevents further threads
from being woken in response to e.g. goroutine wakeups *globally*
(throughout the process). Futex wake-to-wakeup latency is approximately
20 microseconds, so sleeping for 53 microseconds can significantly
increase goroutine wakeup latency by delaying thread wakeup.
Fix this by timestamping Gs when they are runqput() into p.runnext, and
causing runqgrab() to indicate to findRunnable() that it should loop if
p.runnext is not yet stealable.
Alternative fixes considered:
- osyield() on Linux as we do on a few other platforms. On Linux,
osyield() is implemented by the sched_yield system call, which IIUC
causes the calling thread to yield its timeslice to any thread on its
runqueue that it would not preempt on wakeup, potentially introducing
even larger latencies on busy systems. See also
https://www.realworldtech.com/forum/?threadid=189711&curpostid=189752
for a case against sched_yield on semantic grounds.
- Replace the usleep() with a spin loop in-place. This tends to waste
the spinning P's time, since it can't check other runqueues and the
number of calls to runqgrab() - and therefore sleeps - is linear in
the number of Ps. Empirically, it introduces regressions not observed
in this change.
Unfortunately, this is a load-bearing bug. In programs with goroutines
that frequently wake up goroutines and then immediately block, this bug
significantly reduces overhead from useless thread wakeups in wakep().
In golang.org/x/benchmarks, this manifests most clearly as regressions
in benchmark dustin_broadcast. To avoid this regression, we need to
intentionally throttle wakep() => acquirem().
Thus, this change also introduces a "need-wakep()" prediction mechanism,
which causes goready() and newproc() to call wakep() only if the calling
goroutine is predicted not to immediately block. To handle
mispredictions, sysmon is changed to wakep() if it detects
underutilization. The current prediction algorithm is simple, but
appears to be effective; it can be improved in the future as warranted.
Results from golang.org/x/benchmarks:
(Baseline is go1.20.1; experiment is go1.20.1 plus this change)
shortname: ajstarks_deck_generate
goos: linux
goarch: amd64
pkg: github.com/ajstarks/deck/generate
cpu: Intel(R) Xeon(R) W-2135 CPU @ 3.70GHz
│ ./bent-bench/20230303T173250.baseline.stdout │ ./bent-bench/20230303T173250.experiment.stdout │
│ sec/op │ sec/op vs base │
Arc-12 3.857µ ± 5% 3.753µ ± 5% ~ (p=0.424 n=10)
Polygon-12 7.074µ ± 6% 6.969µ ± 4% ~ (p=0.190 n=10)
geomean 5.224µ 5.114µ -2.10%
shortname: aws_jsonutil
pkg: github.com/aws/aws-sdk-go/private/protocol/json/jsonutil
│ ./bent-bench/20230303T173250.baseline.stdout │ ./bent-bench/20230303T173250.experiment.stdout │
│ sec/op │ sec/op vs base │
BuildJSON-12 5.602µ ± 3% 5.600µ ± 2% ~ (p=0.896 n=10)
StdlibJSON-12 3.843µ ± 2% 3.828µ ± 2% ~ (p=0.224 n=10)
geomean 4.640µ 4.630µ -0.22%
shortname: benhoyt_goawk_1_18
pkg: github.com/benhoyt/goawk/interp
│ ./bent-bench/20230303T173250.baseline.stdout │ ./bent-bench/20230303T173250.experiment.stdout │
│ sec/op │ sec/op vs base │
RecursiveFunc-12 17.79µ ± 3% 17.65µ ± 3% ~ (p=0.436 n=10)
RegexMatch-12 815.8n ± 4% 823.3n ± 1% ~ (p=0.353 n=10)
RepeatExecProgram-12 21.30µ ± 6% 21.69µ ± 3% ~ (p=0.052 n=10)
RepeatNew-12 79.21n ± 4% 79.73n ± 3% ~ (p=0.529 n=10)
RepeatIOExecProgram-12 41.83µ ± 1% 42.07µ ± 2% ~ (p=0.796 n=10)
RepeatIONew-12 1.195µ ± 3% 1.196µ ± 2% ~ (p=1.000 n=10)
geomean 3.271µ 3.288µ +0.54%
shortname: bindata
pkg: github.com/kevinburke/go-bindata
│ ./bent-bench/20230303T173250.baseline.stdout │ ./bent-bench/20230303T173250.experiment.stdout │
│ sec/op │ sec/op vs base │
Bindata-12 316.2m ± 5% 309.7m ± 4% ~ (p=0.436 n=10)
│ ./bent-bench/20230303T173250.baseline.stdout │ ./bent-bench/20230303T173250.experiment.stdout │
│ B/s │ B/s vs base │
Bindata-12 20.71Mi ± 5% 21.14Mi ± 4% ~ (p=0.436 n=10)
│ ./bent-bench/20230303T173250.baseline.stdout │ ./bent-bench/20230303T173250.experiment.stdout │
│ B/op │ B/op vs base │
Bindata-12 183.0Mi ± 0% 183.0Mi ± 0% ~ (p=0.353 n=10)
│ ./bent-bench/20230303T173250.baseline.stdout │ ./bent-bench/20230303T173250.experiment.stdout │
│ allocs/op │ allocs/op vs base │
Bindata-12 5.790k ± 0% 5.789k ± 0% ~ (p=0.358 n=10)
shortname: bloom_bloom
pkg: github.com/bits-and-blooms/bloom/v3
│ ./bent-bench/20230303T173250.baseline.stdout │ ./bent-bench/20230303T173250.experiment.stdout │
│ sec/op │ sec/op vs base │
SeparateTestAndAdd-12 414.6n ± 4% 413.9n ± 2% ~ (p=0.895 n=10)
CombinedTestAndAdd-12 425.8n ± 9% 419.8n ± 8% ~ (p=0.353 n=10)
geomean 420.2n 416.9n -0.78%
shortname: capnproto2
pkg: zombiezen.com/go/capnproto2
│ ./bent-bench/20230303T173250.baseline.stdout │ ./bent-bench/20230303T173250.experiment.stdout │
│ sec/op │ sec/op vs base │
TextMovementBetweenSegments-12 320.5µ ± 5% 318.4µ ± 10% ~ (p=0.579 n=10)
Growth_MultiSegment-12 13.63m ± 1% 13.87m ± 2% +1.71% (p=0.029 n=10)
geomean 2.090m 2.101m +0.52%
│ ./bent-bench/20230303T173250.baseline.stdout │ ./bent-bench/20230303T173250.experiment.stdout │
│ B/s │ B/s vs base │
Growth_MultiSegment-12 73.35Mi ± 1% 72.12Mi ± 2% -1.68% (p=0.027 n=10)
│ ./bent-bench/20230303T173250.baseline.stdout │ ./bent-bench/20230303T173250.experiment.stdout │
│ B/op │ B/op vs base │
Growth_MultiSegment-12 1.572Mi ± 0% 1.572Mi ± 0% ~ (p=0.320 n=10)
│ ./bent-bench/20230303T173250.baseline.stdout │ ./bent-bench/20230303T173250.experiment.stdout │
│ allocs/op │ allocs/op vs base │
Growth_MultiSegment-12 21.00 ± 0% 21.00 ± 0% ~ (p=1.000 n=10) ¹
¹ all samples are equal
shortname: cespare_mph
pkg: github.com/cespare/mph
│ ./bent-bench/20230303T173250.baseline.stdout │ ./bent-bench/20230303T173250.experiment.stdout │
│ sec/op │ sec/op vs base │
Build-12 32.72m ± 2% 32.49m ± 1% ~ (p=0.280 n=10)
shortname: commonmark_markdown
pkg: gitlab.com/golang-commonmark/markdown
│ ./bent-bench/20230303T173250.baseline.stdout │ ./bent-bench/20230303T173250.experiment.stdout │
│ sec/op │ sec/op vs base │
RenderSpecNoHTML-12 10.09m ± 2% 10.18m ± 3% ~ (p=0.796 n=10)
RenderSpec-12 10.19m ± 1% 10.11m ± 3% ~ (p=0.684 n=10)
RenderSpecBlackFriday2-12 6.793m ± 5% 6.946m ± 2% ~ (p=0.063 n=10)
geomean 8.872m 8.944m +0.81%
shortname: dustin_broadcast
pkg: github.com/dustin/go-broadcast
│ ./bent-bench/20230303T173250.baseline.stdout │ ./bent-bench/20230303T173250.experiment.stdout │
│ sec/op │ sec/op vs base │
DirectSend-12 570.5n ± 7% 355.2n ± 2% -37.74% (p=0.000 n=10)
ParallelDirectSend-12 549.0n ± 5% 360.9n ± 3% -34.25% (p=0.000 n=10)
ParallelBrodcast-12 788.7n ± 2% 486.0n ± 4% -38.37% (p=0.000 n=10)
MuxBrodcast-12 788.6n ± 4% 471.5n ± 6% -40.21% (p=0.000 n=10)
geomean 664.4n 414.0n -37.68%
shortname: dustin_humanize
pkg: github.com/dustin/go-humanize
│ ./bent-bench/20230303T173250.baseline.stdout │ ./bent-bench/20230303T173250.experiment.stdout │
│ sec/op │ sec/op vs base │
ParseBigBytes-12 1.964µ ± 5% 1.941µ ± 3% ~ (p=0.289 n=10)
shortname: ericlagergren_decimal
pkg: github.com/ericlagergren/decimal/benchmarks
│ ./bent-bench/20230303T173250.baseline.stdout │ ./bent-bench/20230303T173250.experiment.stdout │
│ sec/op │ sec/op vs base │
Pi/foo=ericlagergren_(Go)/prec=100-12 147.5µ ± 2% 147.5µ ± 1% ~ (p=0.912 n=10)
Pi/foo=ericlagergren_(GDA)/prec=100-12 329.6µ ± 1% 332.1µ ± 2% ~ (p=0.063 n=10)
Pi/foo=shopspring/prec=100-12 680.5µ ± 4% 688.6µ ± 2% ~ (p=0.481 n=10)
Pi/foo=apmckinlay/prec=100-12 2.541µ ± 4% 2.525µ ± 3% ~ (p=0.218 n=10)
Pi/foo=go-inf/prec=100-12 169.5µ ± 3% 170.7µ ± 3% ~ (p=0.218 n=10)
Pi/foo=float64/prec=100-12 4.136µ ± 3% 4.162µ ± 6% ~ (p=0.436 n=10)
geomean 62.38µ 62.66µ +0.45%
shortname: ethereum_bitutil
pkg: github.com/ethereum/go-ethereum/common/bitutil
│ ./bent-bench/20230303T173250.baseline.stdout │ ./bent-bench/20230303T173250.experiment.stdout │
│ sec/op │ sec/op vs base │
FastTest2KB-12 130.4n ± 1% 131.5n ± 1% ~ (p=0.093 n=10)
BaseTest2KB-12 624.8n ± 2% 983.0n ± 2% +57.32% (p=0.000 n=10)
Encoding4KBVerySparse-12 21.48µ ± 3% 22.20µ ± 3% +3.37% (p=0.005 n=10)
geomean 1.205µ 1.421µ +17.94%
│ ./bent-bench/20230303T173250.baseline.stdout │ ./bent-bench/20230303T173250.experiment.stdout │
│ B/op │ B/op vs base │
Encoding4KBVerySparse-12 9.750Ki ± 0% 9.750Ki ± 0% ~ (p=1.000 n=10) ¹
¹ all samples are equal
│ ./bent-bench/20230303T173250.baseline.stdout │ ./bent-bench/20230303T173250.experiment.stdout │
│ allocs/op │ allocs/op vs base │
Encoding4KBVerySparse-12 15.00 ± 0% 15.00 ± 0% ~ (p=1.000 n=10) ¹
¹ all samples are equal
shortname: ethereum_core
pkg: github.com/ethereum/go-ethereum/core
│ ./bent-bench/20230303T173250.baseline.stdout │ ./bent-bench/20230303T173250.experiment.stdout │
│ sec/op │ sec/op vs base │
PendingDemotion10000-12 96.72n ± 4% 98.55n ± 2% ~ (p=0.055 n=10)
FuturePromotion10000-12 2.128n ± 3% 2.093n ± 3% ~ (p=0.896 n=10)
PoolBatchInsert10000-12 642.6m ± 2% 642.1m ± 5% ~ (p=0.796 n=10)
PoolBatchLocalInsert10000-12 805.2m ± 2% 826.6m ± 4% ~ (p=0.105 n=10)
geomean 101.6µ 102.3µ +0.69%
shortname: ethereum_corevm
pkg: github.com/ethereum/go-ethereum/core/vm
│ ./bent-bench/20230303T173250.baseline.stdout │ ./bent-bench/20230303T173250.experiment.stdout │
│ sec/op │ sec/op vs base │
OpDiv128-12 137.4n ± 3% 139.5n ± 1% +1.56% (p=0.024 n=10)
shortname: ethereum_ecies
pkg: github.com/ethereum/go-ethereum/crypto/ecies
│ ./bent-bench/20230303T173250.baseline.stdout │ ./bent-bench/20230303T173250.experiment.stdout │
│ sec/op │ sec/op vs base │
GenerateKeyP256-12 15.67µ ± 6% 15.66µ ± 3% ~ (p=0.971 n=10)
GenSharedKeyP256-12 51.09µ ± 6% 52.09µ ± 4% ~ (p=0.631 n=10)
GenSharedKeyS256-12 47.24µ ± 2% 46.67µ ± 3% ~ (p=0.247 n=10)
geomean 33.57µ 33.64µ +0.21%
shortname: ethereum_ethash
pkg: github.com/ethereum/go-ethereum/consensus/ethash
│ ./bent-bench/20230303T173250.baseline.stdout │ ./bent-bench/20230303T173250.experiment.stdout │
│ sec/op │ sec/op vs base │
HashimotoLight-12 1.116m ± 5% 1.112m ± 2% ~ (p=0.684 n=10)
shortname: ethereum_trie
pkg: github.com/ethereum/go-ethereum/trie
│ ./bent-bench/20230303T173250.baseline.stdout │ ./bent-bench/20230303T173250.experiment.stdout │
│ sec/op │ sec/op vs base │
HashFixedSize/10K-12 9.236m ± 1% 9.106m ± 1% -1.40% (p=0.019 n=10)
CommitAfterHashFixedSize/10K-12 19.60m ± 1% 19.51m ± 1% ~ (p=0.796 n=10)
geomean 13.45m 13.33m -0.93%
│ ./bent-bench/20230303T173250.baseline.stdout │ ./bent-bench/20230303T173250.experiment.stdout │
│ B/op │ B/op vs base │
HashFixedSize/10K-12 6.036Mi ± 0% 6.037Mi ± 0% ~ (p=0.247 n=10)
CommitAfterHashFixedSize/10K-12 8.626Mi ± 0% 8.626Mi ± 0% ~ (p=0.280 n=10)
geomean 7.216Mi 7.216Mi +0.01%
│ ./bent-bench/20230303T173250.baseline.stdout │ ./bent-bench/20230303T173250.experiment.stdout │
│ allocs/op │ allocs/op vs base │
HashFixedSize/10K-12 77.17k ± 0% 77.17k ± 0% ~ (p=0.050 n=10)
CommitAfterHashFixedSize/10K-12 79.99k ± 0% 79.99k ± 0% ~ (p=0.391 n=10)
geomean 78.56k 78.57k +0.00%
shortname: gonum_blas_native
pkg: gonum.org/v1/gonum/blas/gonum
│ ./bent-bench/20230303T173250.baseline.stdout │ ./bent-bench/20230303T173250.experiment.stdout │
│ sec/op │ sec/op vs base │
Dnrm2MediumPosInc-12 1.953µ ± 2% 1.940µ ± 5% ~ (p=0.989 n=10)
DasumMediumUnitaryInc-12 932.5n ± 1% 931.2n ± 1% ~ (p=0.753 n=10)
geomean 1.349µ 1.344µ -0.40%
shortname: gonum_community
pkg: gonum.org/v1/gonum/graph/community
│ ./bent-bench/20230303T173250.baseline.stdout │ ./bent-bench/20230303T173250.experiment.stdout │
│ sec/op │ sec/op vs base │
LouvainDirectedMultiplex-12 26.40m ± 1% 26.64m ± 1% ~ (p=0.165 n=10)
shortname: gonum_lapack_native
pkg: gonum.org/v1/gonum/lapack/gonum
│ ./bent-bench/20230303T173250.baseline.stdout │ ./bent-bench/20230303T173250.experiment.stdout │
│ sec/op │ sec/op vs base │
Dgeev/Circulant10-12 41.97µ ± 6% 42.90µ ± 4% ~ (p=0.143 n=10)
Dgeev/Circulant100-12 12.13m ± 4% 12.30m ± 3% ~ (p=0.796 n=10)
geomean 713.4µ 726.4µ +1.81%
shortname: gonum_mat
pkg: gonum.org/v1/gonum/mat
│ ./bent-bench/20230303T173250.baseline.stdout │ ./bent-bench/20230303T173250.experiment.stdout │
│ sec/op │ sec/op vs base │
MulWorkspaceDense1000Hundredth-12 89.78m ± 0% 81.48m ± 1% -9.24% (p=0.000 n=10)
ScaleVec10000Inc20-12 7.204µ ± 36% 8.450µ ± 35% ~ (p=0.853 n=10)
geomean 804.2µ 829.7µ +3.18%
shortname: gonum_topo
pkg: gonum.org/v1/gonum/graph/topo
│ ./bent-bench/20230303T173250.baseline.stdout │ ./bent-bench/20230303T173250.experiment.stdout │
│ sec/op │ sec/op vs base │
TarjanSCCGnp_10_tenth-12 7.251µ ± 1% 7.187µ ± 1% -0.88% (p=0.025 n=10)
TarjanSCCGnp_1000_half-12 74.48m ± 2% 74.37m ± 4% ~ (p=0.796 n=10)
geomean 734.8µ 731.1µ -0.51%
shortname: gonum_traverse
pkg: gonum.org/v1/gonum/graph/traverse
│ ./bent-bench/20230303T173250.baseline.stdout │ ./bent-bench/20230303T173250.experiment.stdout │
│ sec/op │ sec/op vs base │
WalkAllBreadthFirstGnp_10_tenth-12 3.517µ ± 1% 3.534µ ± 1% ~ (p=0.343 n=10)
WalkAllBreadthFirstGnp_1000_tenth-12 11.12m ± 6% 11.19m ± 2% ~ (p=0.631 n=10)
geomean 197.8µ 198.9µ +0.54%
shortname: gtank_blake2s
pkg: github.com/gtank/blake2s
│ ./bent-bench/20230303T173250.baseline.stdout │ ./bent-bench/20230303T173250.experiment.stdout │
│ sec/op │ sec/op vs base │
Hash8K-12 18.96µ ± 4% 18.82µ ± 5% ~ (p=0.579 n=10)
│ ./bent-bench/20230303T173250.baseline.stdout │ ./bent-bench/20230303T173250.experiment.stdout │
│ B/s │ B/s vs base │
Hash8K-12 412.2Mi ± 4% 415.2Mi ± 5% ~ (p=0.579 n=10)
shortname: hugo_hugolib
pkg: github.com/gohugoio/hugo/hugolib
│ ./bent-bench/20230303T173250.baseline.stdout │ ./bent-bench/20230303T173250.experiment.stdout │
│ sec/op │ sec/op vs base │
MergeByLanguage-12 529.9n ± 1% 531.5n ± 2% ~ (p=0.305 n=10)
ResourceChainPostProcess-12 62.76m ± 3% 56.23m ± 2% -10.39% (p=0.000 n=10)
ReplaceShortcodeTokens-12 2.727µ ± 3% 2.701µ ± 7% ~ (p=0.592 n=10)
geomean 44.92µ 43.22µ -3.80%
shortname: k8s_cache
pkg: k8s.io/client-go/tools/cache
│ ./bent-bench/20230303T173250.baseline.stdout │ ./bent-bench/20230303T173250.experiment.stdout │
│ sec/op │ sec/op vs base │
Listener-12 1.312µ ± 1% 1.199µ ± 1% -8.62% (p=0.000 n=10)
ReflectorResyncChanMany-12 785.7n ± 4% 796.3n ± 3% ~ (p=0.089 n=10)
geomean 1.015µ 976.9n -3.76%
│ ./bent-bench/20230303T173250.baseline.stdout │ ./bent-bench/20230303T173250.experiment.stdout │
│ B/op │ B/op vs base │
Listener-12 16.00 ± 0% 16.00 ± 0% ~ (p=1.000 n=10) ¹
¹ all samples are equal
│ ./bent-bench/20230303T173250.baseline.stdout │ ./bent-bench/20230303T173250.experiment.stdout │
│ allocs/op │ allocs/op vs base │
Listener-12 1.000 ± 0% 1.000 ± 0% ~ (p=1.000 n=10) ¹
¹ all samples are equal
shortname: k8s_workqueue
pkg: k8s.io/client-go/util/workqueue
│ ./bent-bench/20230303T173250.baseline.stdout │ ./bent-bench/20230303T173250.experiment.stdout │
│ sec/op │ sec/op vs base │
ParallelizeUntil/pieces:1000,workers:10,chunkSize:1-12 244.6µ ± 1% 245.9µ ± 0% +0.55% (p=0.023 n=10)
ParallelizeUntil/pieces:1000,workers:10,chunkSize:10-12 75.09µ ± 1% 63.54µ ± 1% -15.37% (p=0.000 n=10)
ParallelizeUntil/pieces:1000,workers:10,chunkSize:100-12 49.47µ ± 2% 42.45µ ± 2% -14.19% (p=0.000 n=10)
ParallelizeUntil/pieces:999,workers:10,chunkSize:13-12 68.51µ ± 1% 55.07µ ± 1% -19.63% (p=0.000 n=10)
geomean 88.82µ 77.74µ -12.47%
shortname: kanzi
pkg: github.com/flanglet/kanzi-go/benchmark
│ ./bent-bench/20230303T173250.baseline.stdout │ ./bent-bench/20230303T173250.experiment.stdout │
│ sec/op │ sec/op vs base │
BWTS-12 0.4479n ± 6% 0.4385n ± 7% ~ (p=0.529 n=10)
FPAQ-12 17.03m ± 3% 17.42m ± 3% ~ (p=0.123 n=10)
LZ-12 1.897m ± 2% 1.887m ± 4% ~ (p=1.000 n=10)
MTFT-12 771.2µ ± 4% 785.8µ ± 3% ~ (p=0.247 n=10)
geomean 57.79µ 58.01µ +0.38%
shortname: minio
pkg: github.com/minio/minio/cmd
│ ./bent-bench/20230303T173250.baseline.stdout │ ./bent-bench/20230303T173250.experiment.stdout │
│ sec/op │ sec/op vs base │
DecodehealingTracker-12 852.8n ± 5% 866.8n ± 5% ~ (p=0.190 n=10)
AppendMsgReplicateDecision-12 0.5383n ± 4% 0.7598n ± 3% +41.13% (p=0.000 n=10)
AppendMsgResyncTargetsInfo-12 4.785n ± 2% 4.639n ± 3% -3.06% (p=0.003 n=10)
DataUpdateTracker-12 3.122µ ± 2% 1.880µ ± 3% -39.77% (p=0.000 n=10)
MarshalMsgdataUsageCacheInfo-12 110.9n ± 2% 109.4n ± 3% ~ (p=0.101 n=10)
geomean 59.74n 57.50n -3.75%
│ ./bent-bench/20230303T173250.baseline.stdout │ ./bent-bench/20230303T173250.experiment.stdout │
│ B/s │ B/s vs base │
DecodehealingTracker-12 347.8Mi ± 5% 342.2Mi ± 6% ~ (p=0.190 n=10)
AppendMsgReplicateDecision-12 1.730Gi ± 3% 1.226Gi ± 3% -29.14% (p=0.000 n=10)
AppendMsgResyncTargetsInfo-12 1.946Gi ± 2% 2.008Gi ± 3% +3.15% (p=0.003 n=10)
DataUpdateTracker-12 312.5Ki ± 3% 517.6Ki ± 2% +65.62% (p=0.000 n=10)
geomean 139.1Mi 145.4Mi +4.47%
│ ./bent-bench/20230303T173250.baseline.stdout │ ./bent-bench/20230303T173250.experiment.stdout │
│ B/op │ B/op vs base │
DecodehealingTracker-12 0.000 ± 0% 0.000 ± 0% ~ (p=1.000 n=10) ¹
AppendMsgReplicateDecision-12 0.000 ± 0% 0.000 ± 0% ~ (p=1.000 n=10) ¹
AppendMsgResyncTargetsInfo-12 0.000 ± 0% 0.000 ± 0% ~ (p=1.000 n=10) ¹
DataUpdateTracker-12 340.0 ± 0% 339.0 ± 1% ~ (p=0.737 n=10)
MarshalMsgdataUsageCacheInfo-12 96.00 ± 0% 96.00 ± 0% ~ (p=1.000 n=10) ¹
geomean ² -0.06% ²
¹ all samples are equal
² summaries must be >0 to compute geomean
│ ./bent-bench/20230303T173250.baseline.stdout │ ./bent-bench/20230303T173250.experiment.stdout │
│ allocs/op │ allocs/op vs base │
DecodehealingTracker-12 0.000 ± 0% 0.000 ± 0% ~ (p=1.000 n=10) ¹
AppendMsgReplicateDecision-12 0.000 ± 0% 0.000 ± 0% ~ (p=1.000 n=10) ¹
AppendMsgResyncTargetsInfo-12 0.000 ± 0% 0.000 ± 0% ~ (p=1.000 n=10) ¹
DataUpdateTracker-12 9.000 ± 0% 9.000 ± 0% ~ (p=1.000 n=10) ¹
MarshalMsgdataUsageCacheInfo-12 1.000 ± 0% 1.000 ± 0% ~ (p=1.000 n=10) ¹
geomean ² +0.00% ²
¹ all samples are equal
² summaries must be >0 to compute geomean
shortname: semver
pkg: github.com/Masterminds/semver
│ ./bent-bench/20230303T173250.baseline.stdout │ ./bent-bench/20230303T173250.experiment.stdout │
│ sec/op │ sec/op vs base │
ValidateVersionTildeFail-12 854.7n ± 2% 842.7n ± 2% ~ (p=0.123 n=10)
shortname: shopify_sarama
pkg: github.com/Shopify/sarama
│ ./bent-bench/20230303T173250.baseline.stdout │ ./bent-bench/20230303T173250.experiment.stdout │
│ sec/op │ sec/op vs base │
Broker_Open-12 212.2µ ± 1% 205.9µ ± 2% -2.95% (p=0.000 n=10)
Broker_No_Metrics_Open-12 132.9µ ± 1% 121.3µ ± 2% -8.68% (p=0.000 n=10)
geomean 167.9µ 158.1µ -5.86%
shortname: spexs2
pkg: github.com/egonelbre/spexs2/_benchmark
│ ./bent-bench/20230303T173250.baseline.stdout │ ./bent-bench/20230303T173250.experiment.stdout │
│ sec/op │ sec/op vs base │
Run/10k/1-12 23.29 ± 1% 23.11 ± 2% ~ (p=0.315 n=10)
Run/10k/16-12 5.648 ± 2% 5.462 ± 4% -3.30% (p=0.004 n=10)
geomean 11.47 11.23 -2.06%
shortname: sweet-biogo-igor
goos:
goarch:
pkg:
cpu:
│ ./sweet/results/biogo-igor/baseline.results │ ./sweet/results/biogo-igor/experiment.results │
│ sec/op │ sec/op vs base │
BiogoIgor 13.53 ± 1% 13.62 ± 1% ~ (p=0.165 n=10)
│ ./sweet/results/biogo-igor/baseline.results │ ./sweet/results/biogo-igor/experiment.results │
│ average-RSS-bytes │ average-RSS-bytes vs base │
BiogoIgor 62.19Mi ± 3% 62.86Mi ± 1% ~ (p=0.247 n=10)
│ ./sweet/results/biogo-igor/baseline.results │ ./sweet/results/biogo-igor/experiment.results │
│ peak-RSS-bytes │ peak-RSS-bytes vs base │
BiogoIgor 89.57Mi ± 4% 89.03Mi ± 3% ~ (p=0.516 n=10)
│ ./sweet/results/biogo-igor/baseline.results │ ./sweet/results/biogo-igor/experiment.results │
│ peak-VM-bytes │ peak-VM-bytes vs base │
BiogoIgor 766.4Mi ± 0% 766.4Mi ± 0% ~ (p=0.954 n=10)
shortname: sweet-biogo-krishna
│ ./sweet/results/biogo-krishna/baseline.results │ ./sweet/results/biogo-krishna/experiment.results │
│ sec/op │ sec/op vs base │
BiogoKrishna 12.70 ± 2% 12.09 ± 3% -4.86% (p=0.000 n=10)
│ ./sweet/results/biogo-krishna/baseline.results │ ./sweet/results/biogo-krishna/experiment.results │
│ average-RSS-bytes │ average-RSS-bytes vs base │
BiogoKrishna 4.085Gi ± 0% 4.083Gi ± 0% ~ (p=0.105 n=10)
│ ./sweet/results/biogo-krishna/baseline.results │ ./sweet/results/biogo-krishna/experiment.results │
│ peak-RSS-bytes │ peak-RSS-bytes vs base │
BiogoKrishna 4.174Gi ± 0% 4.173Gi ± 0% ~ (p=0.853 n=10)
│ ./sweet/results/biogo-krishna/baseline.results │ ./sweet/results/biogo-krishna/experiment.results │
│ peak-VM-bytes │ peak-VM-bytes vs base │
BiogoKrishna 4.877Gi ± 0% 4.877Gi ± 0% ~ (p=0.591 n=10)
shortname: sweet-bleve-index
│ ./sweet/results/bleve-index/baseline.results │ ./sweet/results/bleve-index/experiment.results │
│ sec/op │ sec/op vs base │
BleveIndexBatch100 4.675 ± 1% 4.669 ± 1% ~ (p=0.739 n=10)
│ ./sweet/results/bleve-index/baseline.results │ ./sweet/results/bleve-index/experiment.results │
│ average-RSS-bytes │ average-RSS-bytes vs base │
BleveIndexBatch100 185.5Mi ± 1% 185.9Mi ± 1% ~ (p=0.796 n=10)
│ ./sweet/results/bleve-index/baseline.results │ ./sweet/results/bleve-index/experiment.results │
│ peak-RSS-bytes │ peak-RSS-bytes vs base │
BleveIndexBatch100 267.5Mi ± 6% 265.0Mi ± 2% ~ (p=0.739 n=10)
│ ./sweet/results/bleve-index/baseline.results │ ./sweet/results/bleve-index/experiment.results │
│ peak-VM-bytes │ peak-VM-bytes vs base │
BleveIndexBatch100 1.945Gi ± 4% 1.945Gi ± 0% ~ (p=0.725 n=10)
shortname: sweet-go-build
│ ./sweet/results/go-build/baseline.results │ ./sweet/results/go-build/experiment.results │
│ sec/op │ sec/op vs base │
GoBuildKubelet 51.32 ± 0% 51.38 ± 3% ~ (p=0.105 n=10)
GoBuildKubeletLink 7.669 ± 1% 7.663 ± 2% ~ (p=0.579 n=10)
GoBuildIstioctl 46.02 ± 0% 46.07 ± 0% ~ (p=0.739 n=10)
GoBuildIstioctlLink 8.174 ± 1% 8.143 ± 2% ~ (p=0.436 n=10)
GoBuildFrontend 16.17 ± 1% 16.10 ± 1% ~ (p=0.143 n=10)
GoBuildFrontendLink 1.399 ± 3% 1.377 ± 3% ~ (p=0.218 n=10)
geomean 12.23 12.18 -0.39%
shortname: sweet-gopher-lua
│ ./sweet/results/gopher-lua/baseline.results │ ./sweet/results/gopher-lua/experiment.results │
│ sec/op │ sec/op vs base │
GopherLuaKNucleotide 22.71 ± 1% 22.86 ± 1% ~ (p=0.218 n=10)
│ ./sweet/results/gopher-lua/baseline.results │ ./sweet/results/gopher-lua/experiment.results │
│ average-RSS-bytes │ average-RSS-bytes vs base │
GopherLuaKNucleotide 36.64Mi ± 2% 36.40Mi ± 1% ~ (p=0.631 n=10)
│ ./sweet/results/gopher-lua/baseline.results │ ./sweet/results/gopher-lua/experiment.results │
│ peak-RSS-bytes │ peak-RSS-bytes vs base │
GopherLuaKNucleotide 43.28Mi ± 5% 41.55Mi ± 7% ~ (p=0.089 n=10)
│ ./sweet/results/gopher-lua/baseline.results │ ./sweet/results/gopher-lua/experiment.results │
│ peak-VM-bytes │ peak-VM-bytes vs base │
GopherLuaKNucleotide 699.6Mi ± 0% 699.9Mi ± 0% +0.04% (p=0.006 n=10)
shortname: sweet-markdown
│ ./sweet/results/markdown/baseline.results │ ./sweet/results/markdown/experiment.results │
│ sec/op │ sec/op vs base │
MarkdownRenderXHTML 260.6m ± 4% 256.4m ± 4% ~ (p=0.796 n=10)
│ ./sweet/results/markdown/baseline.results │ ./sweet/results/markdown/experiment.results │
│ average-RSS-bytes │ average-RSS-bytes vs base │
MarkdownRenderXHTML 20.47Mi ± 1% 20.71Mi ± 2% ~ (p=0.393 n=10)
│ ./sweet/results/markdown/baseline.results │ ./sweet/results/markdown/experiment.results │
│ peak-RSS-bytes │ peak-RSS-bytes vs base │
MarkdownRenderXHTML 20.88Mi ± 11% 21.73Mi ± 6% ~ (p=0.470 n=10)
│ ./sweet/results/markdown/baseline.results │ ./sweet/results/markdown/experiment.results │
│ peak-VM-bytes │ peak-VM-bytes vs base │
MarkdownRenderXHTML 699.2Mi ± 0% 699.3Mi ± 0% ~ (p=0.464 n=10)
shortname: sweet-tile38
│ ./sweet/results/tile38/baseline.results │ ./sweet/results/tile38/experiment.results │
│ sec/op │ sec/op vs base │
Tile38WithinCircle100kmRequest 529.1µ ± 1% 530.3µ ± 1% ~ (p=0.143 n=10)
Tile38IntersectsCircle100kmRequest 629.6µ ± 1% 630.8µ ± 1% ~ (p=0.971 n=10)
Tile38KNearestLimit100Request 446.4µ ± 1% 453.7µ ± 1% +1.62% (p=0.000 n=10)
geomean 529.8µ 533.4µ +0.67%
│ ./sweet/results/tile38/baseline.results │ ./sweet/results/tile38/experiment.results │
│ average-RSS-bytes │ average-RSS-bytes vs base │
Tile38WithinCircle100kmRequest 5.054Gi ± 1% 5.057Gi ± 1% ~ (p=0.796 n=10)
Tile38IntersectsCircle100kmRequest 5.381Gi ± 0% 5.431Gi ± 1% +0.94% (p=0.019 n=10)
Tile38KNearestLimit100Request 6.801Gi ± 0% 6.802Gi ± 0% ~ (p=0.684 n=10)
geomean 5.697Gi 5.717Gi +0.34%
│ ./sweet/results/tile38/baseline.results │ ./sweet/results/tile38/experiment.results │
│ peak-RSS-bytes │ peak-RSS-bytes vs base │
Tile38WithinCircle100kmRequest 5.380Gi ± 1% 5.381Gi ± 1% ~ (p=0.912 n=10)
Tile38IntersectsCircle100kmRequest 5.669Gi ± 1% 5.756Gi ± 1% +1.53% (p=0.019 n=10)
Tile38KNearestLimit100Request 7.013Gi ± 0% 7.011Gi ± 0% ~ (p=0.796 n=10)
geomean 5.980Gi 6.010Gi +0.50%
│ ./sweet/results/tile38/baseline.results │ ./sweet/results/tile38/experiment.results │
│ peak-VM-bytes │ peak-VM-bytes vs base │
Tile38WithinCircle100kmRequest 6.047Gi ± 1% 6.047Gi ± 1% ~ (p=0.725 n=10)
Tile38IntersectsCircle100kmRequest 6.305Gi ± 1% 6.402Gi ± 2% +1.53% (p=0.035 n=10)
Tile38KNearestLimit100Request 7.685Gi ± 0% 7.685Gi ± 0% ~ (p=0.955 n=10)
geomean 6.642Gi 6.676Gi +0.51%
│ ./sweet/results/tile38/baseline.results │ ./sweet/results/tile38/experiment.results │
│ p50-latency-sec │ p50-latency-sec vs base │
Tile38WithinCircle100kmRequest 88.81µ ± 1% 89.36µ ± 1% +0.61% (p=0.043 n=10)
Tile38IntersectsCircle100kmRequest 151.5µ ± 1% 152.0µ ± 1% ~ (p=0.089 n=10)
Tile38KNearestLimit100Request 259.0µ ± 0% 259.1µ ± 0% ~ (p=0.853 n=10)
geomean 151.6µ 152.1µ +0.33%
│ ./sweet/results/tile38/baseline.results │ ./sweet/results/tile38/experiment.results │
│ p90-latency-sec │ p90-latency-sec vs base │
Tile38WithinCircle100kmRequest 712.5µ ± 0% 713.9µ ± 1% ~ (p=0.190 n=10)
Tile38IntersectsCircle100kmRequest 960.6µ ± 1% 958.2µ ± 1% ~ (p=0.739 n=10)
Tile38KNearestLimit100Request 1.007m ± 1% 1.032m ± 1% +2.50% (p=0.000 n=10)
geomean 883.4µ 890.5µ +0.80%
│ ./sweet/results/tile38/baseline.results │ ./sweet/results/tile38/experiment.results │
│ p99-latency-sec │ p99-latency-sec vs base │
Tile38WithinCircle100kmRequest 7.061m ± 1% 7.085m ± 1% ~ (p=0.481 n=10)
Tile38IntersectsCircle100kmRequest 7.228m ± 1% 7.187m ± 1% ~ (p=0.143 n=10)
Tile38KNearestLimit100Request 2.085m ± 0% 2.131m ± 1% +2.22% (p=0.000 n=10)
geomean 4.738m 4.770m +0.66%
│ ./sweet/results/tile38/baseline.results │ ./sweet/results/tile38/experiment.results │
│ ops/s │ ops/s vs base │
Tile38WithinCircle100kmRequest 17.01k ± 1% 16.97k ± 1% ~ (p=0.143 n=10)
Tile38IntersectsCircle100kmRequest 14.29k ± 1% 14.27k ± 1% ~ (p=0.988 n=10)
Tile38KNearestLimit100Request 20.16k ± 1% 19.84k ± 1% -1.59% (p=0.000 n=10)
geomean 16.99k 16.87k -0.67%
shortname: uber_tally
goos: linux
goarch: amd64
pkg: github.com/uber-go/tally
cpu: Intel(R) Xeon(R) W-2135 CPU @ 3.70GHz
│ ./bent-bench/20230303T173250.baseline.stdout │ ./bent-bench/20230303T173250.experiment.stdout │
│ sec/op │ sec/op vs base │
ScopeTaggedNoCachedSubscopes-12 2.867µ ± 4% 2.921µ ± 4% ~ (p=0.579 n=10)
HistogramAllocation-12 1.519µ ± 3% 1.507µ ± 7% ~ (p=0.631 n=10)
geomean 2.087µ 2.098µ +0.53%
│ ./bent-bench/20230303T173250.baseline.stdout │ ./bent-bench/20230303T173250.experiment.stdout │
│ B/op │ B/op vs base │
HistogramAllocation-12 1.124Ki ± 1% 1.125Ki ± 4% ~ (p=0.271 n=10)
│ ./bent-bench/20230303T173250.baseline.stdout │ ./bent-bench/20230303T173250.experiment.stdout │
│ allocs/op │ allocs/op vs base │
HistogramAllocation-12 20.00 ± 0% 20.00 ± 0% ~ (p=1.000 n=10) ¹
¹ all samples are equal
shortname: uber_zap
pkg: go.uber.org/zap/zapcore
│ ./bent-bench/20230303T173250.baseline.stdout │ ./bent-bench/20230303T173250.experiment.stdout │
│ sec/op │ sec/op vs base │
BufferedWriteSyncer/write_file_with_buffer-12 296.1n ± 12% 205.9n ± 10% -30.46% (p=0.000 n=10)
MultiWriteSyncer/2_discarder-12 7.528n ± 4% 7.014n ± 2% -6.83% (p=0.000 n=10)
MultiWriteSyncer/4_discarder-12 9.065n ± 1% 8.908n ± 1% -1.73% (p=0.002 n=10)
MultiWriteSyncer/4_discarder_with_buffer-12 225.2n ± 2% 147.6n ± 2% -34.48% (p=0.000 n=10)
WriteSyncer/write_file_with_no_buffer-12 4.785µ ± 1% 4.933µ ± 3% +3.08% (p=0.001 n=10)
ZapConsole-12 702.5n ± 1% 649.1n ± 1% -7.62% (p=0.000 n=10)
JSONLogMarshalerFunc-12 1.219µ ± 2% 1.226µ ± 3% ~ (p=0.781 n=10)
ZapJSON-12 555.4n ± 1% 480.9n ± 3% -13.40% (p=0.000 n=10)
StandardJSON-12 814.1n ± 1% 809.0n ± 0% ~ (p=0.101 n=10)
Sampler_Check/7_keys-12 10.55n ± 2% 10.61n ± 1% ~ (p=0.594 n=10)
Sampler_Check/50_keys-12 11.01n ± 0% 10.98n ± 1% ~ (p=0.286 n=10)
Sampler_Check/100_keys-12 10.71n ± 0% 10.71n ± 0% ~ (p=0.563 n=10)
Sampler_CheckWithHook/7_keys-12 20.20n ± 2% 20.42n ± 2% ~ (p=0.446 n=10)
Sampler_CheckWithHook/50_keys-12 20.72n ± 2% 21.02n ± 1% ~ (p=0.078 n=10)
Sampler_CheckWithHook/100_keys-12 20.15n ± 2% 20.68n ± 3% +2.63% (p=0.037 n=10)
TeeCheck-12 140.8n ± 2% 140.5n ± 2% ~ (p=0.754 n=10)
geomean 87.80n 82.39n -6.15%
The only large regression (in ethereum_bitutil's BaseTest2KB) appears to
be spurious, as the test does not involve any goroutines (or
B.RunParallel()), which profiling confirms.
Updates golang/go#18237
Related to golang/go#32113
The most recently goready()'d G on each P is given a special position in
the P's runqueue, p.runnext. Other Ps steal p.runnext only as a last
resort, and usleep(3) before doing so: findRunnable() => stealWork() =>
runqsteal() => runqgrab(). As documented in runqgrab(), this is to
reduce thrashing of Gs between Ps in cases where one goroutine wakes another
and then "almost immediately" blocks.
On Linux, usleep() is implemented by invoking the nanosleep system call.
Syscall timeouts in the Linux kernel are subject to timer slack, as
documented by the man page for syscall prctl, section
"PR_SET_TIMERSLACK". Experimentally, short timeouts can expect to expire
50 microseconds late regardless of other system activity. Thus, on
Linux, usleep(3) typically sleeps for at least 53 microseconds, more
than 17x longer than intended.
A P must be in the spinning state in order to attempt work-stealing.
While at least one P is spinning, wakep() will refuse to wake a new
spinning P. One P sleeping in runqgrab() thus prevents further threads
from being woken in response to e.g. goroutine wakeups *globally*
(throughout the process). Futex wake-to-wakeup latency is approximately
20 microseconds, so sleeping for 53 microseconds can significantly
increase goroutine wakeup latency by delaying thread wakeup.
Fix this by timestamping Gs when they are runqput() into p.runnext, and
causing runqgrab() to indicate to findRunnable() that it should loop if
p.runnext is not yet stealable.
Alternative fixes considered:
- osyield() on Linux as we do on a few other platforms. On Linux,
osyield() is implemented by the sched_yield system call, which IIUC
causes the calling thread to yield its timeslice to any thread on its
runqueue that it would not preempt on wakeup, potentially introducing
even larger latencies on busy systems. See also
https://www.realworldtech.com/forum/?threadid=189711&curpostid=189752
for a case against sched_yield on semantic grounds.
- Replace the usleep() with a spin loop in-place. This tends to waste
the spinning P's time, since it can't check other runqueues and the
number of calls to runqgrab() - and therefore sleeps - is linear in
the number of Ps. Empirically, it introduces regressions not observed
in this change.
- Change thread timer slack using prctl(PR_SET_TIMERSLACK). In practice,
user programs will have been tuned based on the default timer slack
value, so tampering with this may introduce regressions into existing
programs.
Unfortunately, this is a load-bearing bug. In programs with goroutines
that frequently wake up goroutines and then immediately block, this bug
significantly reduces overhead from useless thread wakeups in wakep().
In golang.org/x/benchmarks, this manifests most clearly as regressions
in benchmark dustin_broadcast. To avoid this regression, we need to
intentionally throttle wakep() => acquirem().
Thus, this change also introduces a "need-wakep()" prediction mechanism,
which causes goready() and newproc() to call wakep() only if the calling
goroutine is predicted not to immediately block. To handle
mispredictions, sysmon is changed to wakep() if it detects
underutilization. The current prediction algorithm is simple, but
appears to be effective; it can be improved in the future as warranted.
Results from golang.org/x/benchmarks:
(Baseline is go1.20.1; experiment is go1.20.1 plus this change)
shortname: ajstarks_deck_generate
goos: linux
goarch: amd64
pkg: github.com/ajstarks/deck/generate
cpu: Intel(R) Xeon(R) W-2135 CPU @ 3.70GHz
│ ./bent-bench/20230303T173250.baseline.stdout │ ./bent-bench/20230303T173250.experiment.stdout │
│ sec/op │ sec/op vs base │
Arc-12 3.857µ ± 5% 3.753µ ± 5% ~ (p=0.424 n=10)
Polygon-12 7.074µ ± 6% 6.969µ ± 4% ~ (p=0.190 n=10)
geomean 5.224µ 5.114µ -2.10%
shortname: aws_jsonutil
pkg: github.com/aws/aws-sdk-go/private/protocol/json/jsonutil
│ ./bent-bench/20230303T173250.baseline.stdout │ ./bent-bench/20230303T173250.experiment.stdout │
│ sec/op │ sec/op vs base │
BuildJSON-12 5.602µ ± 3% 5.600µ ± 2% ~ (p=0.896 n=10)
StdlibJSON-12 3.843µ ± 2% 3.828µ ± 2% ~ (p=0.224 n=10)
geomean 4.640µ 4.630µ -0.22%
shortname: benhoyt_goawk_1_18
pkg: github.com/benhoyt/goawk/interp
│ ./bent-bench/20230303T173250.baseline.stdout │ ./bent-bench/20230303T173250.experiment.stdout │
│ sec/op │ sec/op vs base │
RecursiveFunc-12 17.79µ ± 3% 17.65µ ± 3% ~ (p=0.436 n=10)
RegexMatch-12 815.8n ± 4% 823.3n ± 1% ~ (p=0.353 n=10)
RepeatExecProgram-12 21.30µ ± 6% 21.69µ ± 3% ~ (p=0.052 n=10)
RepeatNew-12 79.21n ± 4% 79.73n ± 3% ~ (p=0.529 n=10)
RepeatIOExecProgram-12 41.83µ ± 1% 42.07µ ± 2% ~ (p=0.796 n=10)
RepeatIONew-12 1.195µ ± 3% 1.196µ ± 2% ~ (p=1.000 n=10)
geomean 3.271µ 3.288µ +0.54%
shortname: bindata
pkg: github.com/kevinburke/go-bindata
│ ./bent-bench/20230303T173250.baseline.stdout │ ./bent-bench/20230303T173250.experiment.stdout │
│ sec/op │ sec/op vs base │
Bindata-12 316.2m ± 5% 309.7m ± 4% ~ (p=0.436 n=10)
│ ./bent-bench/20230303T173250.baseline.stdout │ ./bent-bench/20230303T173250.experiment.stdout │
│ B/s │ B/s vs base │
Bindata-12 20.71Mi ± 5% 21.14Mi ± 4% ~ (p=0.436 n=10)
│ ./bent-bench/20230303T173250.baseline.stdout │ ./bent-bench/20230303T173250.experiment.stdout │
│ B/op │ B/op vs base │
Bindata-12 183.0Mi ± 0% 183.0Mi ± 0% ~ (p=0.353 n=10)
│ ./bent-bench/20230303T173250.baseline.stdout │ ./bent-bench/20230303T173250.experiment.stdout │
│ allocs/op │ allocs/op vs base │
Bindata-12 5.790k ± 0% 5.789k ± 0% ~ (p=0.358 n=10)
shortname: bloom_bloom
pkg: github.com/bits-and-blooms/bloom/v3
│ ./bent-bench/20230303T173250.baseline.stdout │ ./bent-bench/20230303T173250.experiment.stdout │
│ sec/op │ sec/op vs base │
SeparateTestAndAdd-12 414.6n ± 4% 413.9n ± 2% ~ (p=0.895 n=10)
CombinedTestAndAdd-12 425.8n ± 9% 419.8n ± 8% ~ (p=0.353 n=10)
geomean 420.2n 416.9n -0.78%
shortname: capnproto2
pkg: zombiezen.com/go/capnproto2
│ ./bent-bench/20230303T173250.baseline.stdout │ ./bent-bench/20230303T173250.experiment.stdout │
│ sec/op │ sec/op vs base │
TextMovementBetweenSegments-12 320.5µ ± 5% 318.4µ ± 10% ~ (p=0.579 n=10)
Growth_MultiSegment-12 13.63m ± 1% 13.87m ± 2% +1.71% (p=0.029 n=10)
geomean 2.090m 2.101m +0.52%
│ ./bent-bench/20230303T173250.baseline.stdout │ ./bent-bench/20230303T173250.experiment.stdout │
│ B/s │ B/s vs base │
Growth_MultiSegment-12 73.35Mi ± 1% 72.12Mi ± 2% -1.68% (p=0.027 n=10)
│ ./bent-bench/20230303T173250.baseline.stdout │ ./bent-bench/20230303T173250.experiment.stdout │
│ B/op │ B/op vs base │
Growth_MultiSegment-12 1.572Mi ± 0% 1.572Mi ± 0% ~ (p=0.320 n=10)
│ ./bent-bench/20230303T173250.baseline.stdout │ ./bent-bench/20230303T173250.experiment.stdout │
│ allocs/op │ allocs/op vs base │
Growth_MultiSegment-12 21.00 ± 0% 21.00 ± 0% ~ (p=1.000 n=10) ¹
¹ all samples are equal
shortname: cespare_mph
pkg: github.com/cespare/mph
│ ./bent-bench/20230303T173250.baseline.stdout │ ./bent-bench/20230303T173250.experiment.stdout │
│ sec/op │ sec/op vs base │
Build-12 32.72m ± 2% 32.49m ± 1% ~ (p=0.280 n=10)
shortname: commonmark_markdown
pkg: gitlab.com/golang-commonmark/markdown
│ ./bent-bench/20230303T173250.baseline.stdout │ ./bent-bench/20230303T173250.experiment.stdout │
│ sec/op │ sec/op vs base │
RenderSpecNoHTML-12 10.09m ± 2% 10.18m ± 3% ~ (p=0.796 n=10)
RenderSpec-12 10.19m ± 1% 10.11m ± 3% ~ (p=0.684 n=10)
RenderSpecBlackFriday2-12 6.793m ± 5% 6.946m ± 2% ~ (p=0.063 n=10)
geomean 8.872m 8.944m +0.81%
shortname: dustin_broadcast
pkg: github.com/dustin/go-broadcast
│ ./bent-bench/20230303T173250.baseline.stdout │ ./bent-bench/20230303T173250.experiment.stdout │
│ sec/op │ sec/op vs base │
DirectSend-12 570.5n ± 7% 355.2n ± 2% -37.74% (p=0.000 n=10)
ParallelDirectSend-12 549.0n ± 5% 360.9n ± 3% -34.25% (p=0.000 n=10)
ParallelBrodcast-12 788.7n ± 2% 486.0n ± 4% -38.37% (p=0.000 n=10)
MuxBrodcast-12 788.6n ± 4% 471.5n ± 6% -40.21% (p=0.000 n=10)
geomean 664.4n 414.0n -37.68%
shortname: dustin_humanize
pkg: github.com/dustin/go-humanize
│ ./bent-bench/20230303T173250.baseline.stdout │ ./bent-bench/20230303T173250.experiment.stdout │
│ sec/op │ sec/op vs base │
ParseBigBytes-12 1.964µ ± 5% 1.941µ ± 3% ~ (p=0.289 n=10)
shortname: ericlagergren_decimal
pkg: github.com/ericlagergren/decimal/benchmarks
│ ./bent-bench/20230303T173250.baseline.stdout │ ./bent-bench/20230303T173250.experiment.stdout │
│ sec/op │ sec/op vs base │
Pi/foo=ericlagergren_(Go)/prec=100-12 147.5µ ± 2% 147.5µ ± 1% ~ (p=0.912 n=10)
Pi/foo=ericlagergren_(GDA)/prec=100-12 329.6µ ± 1% 332.1µ ± 2% ~ (p=0.063 n=10)
Pi/foo=shopspring/prec=100-12 680.5µ ± 4% 688.6µ ± 2% ~ (p=0.481 n=10)
Pi/foo=apmckinlay/prec=100-12 2.541µ ± 4% 2.525µ ± 3% ~ (p=0.218 n=10)
Pi/foo=go-inf/prec=100-12 169.5µ ± 3% 170.7µ ± 3% ~ (p=0.218 n=10)
Pi/foo=float64/prec=100-12 4.136µ ± 3% 4.162µ ± 6% ~ (p=0.436 n=10)
geomean 62.38µ 62.66µ +0.45%
shortname: ethereum_bitutil
pkg: github.com/ethereum/go-ethereum/common/bitutil
│ ./bent-bench/20230303T173250.baseline.stdout │ ./bent-bench/20230303T173250.experiment.stdout │
│ sec/op │ sec/op vs base │
FastTest2KB-12 130.4n ± 1% 131.5n ± 1% ~ (p=0.093 n=10)
BaseTest2KB-12 624.8n ± 2% 983.0n ± 2% +57.32% (p=0.000 n=10)
Encoding4KBVerySparse-12 21.48µ ± 3% 22.20µ ± 3% +3.37% (p=0.005 n=10)
geomean 1.205µ 1.421µ +17.94%
│ ./bent-bench/20230303T173250.baseline.stdout │ ./bent-bench/20230303T173250.experiment.stdout │
│ B/op │ B/op vs base │
Encoding4KBVerySparse-12 9.750Ki ± 0% 9.750Ki ± 0% ~ (p=1.000 n=10) ¹
¹ all samples are equal
│ ./bent-bench/20230303T173250.baseline.stdout │ ./bent-bench/20230303T173250.experiment.stdout │
│ allocs/op │ allocs/op vs base │
Encoding4KBVerySparse-12 15.00 ± 0% 15.00 ± 0% ~ (p=1.000 n=10) ¹
¹ all samples are equal
shortname: ethereum_core
pkg: github.com/ethereum/go-ethereum/core
│ ./bent-bench/20230303T173250.baseline.stdout │ ./bent-bench/20230303T173250.experiment.stdout │
│ sec/op │ sec/op vs base │
PendingDemotion10000-12 96.72n ± 4% 98.55n ± 2% ~ (p=0.055 n=10)
FuturePromotion10000-12 2.128n ± 3% 2.093n ± 3% ~ (p=0.896 n=10)
PoolBatchInsert10000-12 642.6m ± 2% 642.1m ± 5% ~ (p=0.796 n=10)
PoolBatchLocalInsert10000-12 805.2m ± 2% 826.6m ± 4% ~ (p=0.105 n=10)
geomean 101.6µ 102.3µ +0.69%
shortname: ethereum_corevm
pkg: github.com/ethereum/go-ethereum/core/vm
│ ./bent-bench/20230303T173250.baseline.stdout │ ./bent-bench/20230303T173250.experiment.stdout │
│ sec/op │ sec/op vs base │
OpDiv128-12 137.4n ± 3% 139.5n ± 1% +1.56% (p=0.024 n=10)
shortname: ethereum_ecies
pkg: github.com/ethereum/go-ethereum/crypto/ecies
│ ./bent-bench/20230303T173250.baseline.stdout │ ./bent-bench/20230303T173250.experiment.stdout │
│ sec/op │ sec/op vs base │
GenerateKeyP256-12 15.67µ ± 6% 15.66µ ± 3% ~ (p=0.971 n=10)
GenSharedKeyP256-12 51.09µ ± 6% 52.09µ ± 4% ~ (p=0.631 n=10)
GenSharedKeyS256-12 47.24µ ± 2% 46.67µ ± 3% ~ (p=0.247 n=10)
geomean 33.57µ 33.64µ +0.21%
shortname: ethereum_ethash
pkg: github.com/ethereum/go-ethereum/consensus/ethash
│ ./bent-bench/20230303T173250.baseline.stdout │ ./bent-bench/20230303T173250.experiment.stdout │
│ sec/op │ sec/op vs base │
HashimotoLight-12 1.116m ± 5% 1.112m ± 2% ~ (p=0.684 n=10)
shortname: ethereum_trie
pkg: github.com/ethereum/go-ethereum/trie
│ ./bent-bench/20230303T173250.baseline.stdout │ ./bent-bench/20230303T173250.experiment.stdout │
│ sec/op │ sec/op vs base │
HashFixedSize/10K-12 9.236m ± 1% 9.106m ± 1% -1.40% (p=0.019 n=10)
CommitAfterHashFixedSize/10K-12 19.60m ± 1% 19.51m ± 1% ~ (p=0.796 n=10)
geomean 13.45m 13.33m -0.93%
│ ./bent-bench/20230303T173250.baseline.stdout │ ./bent-bench/20230303T173250.experiment.stdout │
│ B/op │ B/op vs base │
HashFixedSize/10K-12 6.036Mi ± 0% 6.037Mi ± 0% ~ (p=0.247 n=10)
CommitAfterHashFixedSize/10K-12 8.626Mi ± 0% 8.626Mi ± 0% ~ (p=0.280 n=10)
geomean 7.216Mi 7.216Mi +0.01%
│ ./bent-bench/20230303T173250.baseline.stdout │ ./bent-bench/20230303T173250.experiment.stdout │
│ allocs/op │ allocs/op vs base │
HashFixedSize/10K-12 77.17k ± 0% 77.17k ± 0% ~ (p=0.050 n=10)
CommitAfterHashFixedSize/10K-12 79.99k ± 0% 79.99k ± 0% ~ (p=0.391 n=10)
geomean 78.56k 78.57k +0.00%
shortname: gonum_blas_native
pkg: gonum.org/v1/gonum/blas/gonum
│ ./bent-bench/20230303T173250.baseline.stdout │ ./bent-bench/20230303T173250.experiment.stdout │
│ sec/op │ sec/op vs base │
Dnrm2MediumPosInc-12 1.953µ ± 2% 1.940µ ± 5% ~ (p=0.989 n=10)
DasumMediumUnitaryInc-12 932.5n ± 1% 931.2n ± 1% ~ (p=0.753 n=10)
geomean 1.349µ 1.344µ -0.40%
shortname: gonum_community
pkg: gonum.org/v1/gonum/graph/community
│ ./bent-bench/20230303T173250.baseline.stdout │ ./bent-bench/20230303T173250.experiment.stdout │
│ sec/op │ sec/op vs base │
LouvainDirectedMultiplex-12 26.40m ± 1% 26.64m ± 1% ~ (p=0.165 n=10)
shortname: gonum_lapack_native
pkg: gonum.org/v1/gonum/lapack/gonum
│ ./bent-bench/20230303T173250.baseline.stdout │ ./bent-bench/20230303T173250.experiment.stdout │
│ sec/op │ sec/op vs base │
Dgeev/Circulant10-12 41.97µ ± 6% 42.90µ ± 4% ~ (p=0.143 n=10)
Dgeev/Circulant100-12 12.13m ± 4% 12.30m ± 3% ~ (p=0.796 n=10)
geomean 713.4µ 726.4µ +1.81%
shortname: gonum_mat
pkg: gonum.org/v1/gonum/mat
│ ./bent-bench/20230303T173250.baseline.stdout │ ./bent-bench/20230303T173250.experiment.stdout │
│ sec/op │ sec/op vs base │
MulWorkspaceDense1000Hundredth-12 89.78m ± 0% 81.48m ± 1% -9.24% (p=0.000 n=10)
ScaleVec10000Inc20-12 7.204µ ± 36% 8.450µ ± 35% ~ (p=0.853 n=10)
geomean 804.2µ 829.7µ +3.18%
shortname: gonum_topo
pkg: gonum.org/v1/gonum/graph/topo
│ ./bent-bench/20230303T173250.baseline.stdout │ ./bent-bench/20230303T173250.experiment.stdout │
│ sec/op │ sec/op vs base │
TarjanSCCGnp_10_tenth-12 7.251µ ± 1% 7.187µ ± 1% -0.88% (p=0.025 n=10)
TarjanSCCGnp_1000_half-12 74.48m ± 2% 74.37m ± 4% ~ (p=0.796 n=10)
geomean 734.8µ 731.1µ -0.51%
shortname: gonum_traverse
pkg: gonum.org/v1/gonum/graph/traverse
│ ./bent-bench/20230303T173250.baseline.stdout │ ./bent-bench/20230303T173250.experiment.stdout │
│ sec/op │ sec/op vs base │
WalkAllBreadthFirstGnp_10_tenth-12 3.517µ ± 1% 3.534µ ± 1% ~ (p=0.343 n=10)
WalkAllBreadthFirstGnp_1000_tenth-12 11.12m ± 6% 11.19m ± 2% ~ (p=0.631 n=10)
geomean 197.8µ 198.9µ +0.54%
shortname: gtank_blake2s
pkg: github.com/gtank/blake2s
│ ./bent-bench/20230303T173250.baseline.stdout │ ./bent-bench/20230303T173250.experiment.stdout │
│ sec/op │ sec/op vs base │
Hash8K-12 18.96µ ± 4% 18.82µ ± 5% ~ (p=0.579 n=10)
│ ./bent-bench/20230303T173250.baseline.stdout │ ./bent-bench/20230303T173250.experiment.stdout │
│ B/s │ B/s vs base │
Hash8K-12 412.2Mi ± 4% 415.2Mi ± 5% ~ (p=0.579 n=10)
shortname: hugo_hugolib
pkg: github.com/gohugoio/hugo/hugolib
│ ./bent-bench/20230303T173250.baseline.stdout │ ./bent-bench/20230303T173250.experiment.stdout │
│ sec/op │ sec/op vs base │
MergeByLanguage-12 529.9n ± 1% 531.5n ± 2% ~ (p=0.305 n=10)
ResourceChainPostProcess-12 62.76m ± 3% 56.23m ± 2% -10.39% (p=0.000 n=10)
ReplaceShortcodeTokens-12 2.727µ ± 3% 2.701µ ± 7% ~ (p=0.592 n=10)
geomean 44.92µ 43.22µ -3.80%
shortname: k8s_cache
pkg: k8s.io/client-go/tools/cache
│ ./bent-bench/20230303T173250.baseline.stdout │ ./bent-bench/20230303T173250.experiment.stdout │
│ sec/op │ sec/op vs base │
Listener-12 1.312µ ± 1% 1.199µ ± 1% -8.62% (p=0.000 n=10)
ReflectorResyncChanMany-12 785.7n ± 4% 796.3n ± 3% ~ (p=0.089 n=10)
geomean 1.015µ 976.9n -3.76%
│ ./bent-bench/20230303T173250.baseline.stdout │ ./bent-bench/20230303T173250.experiment.stdout │
│ B/op │ B/op vs base │
Listener-12 16.00 ± 0% 16.00 ± 0% ~ (p=1.000 n=10) ¹
¹ all samples are equal
│ ./bent-bench/20230303T173250.baseline.stdout │ ./bent-bench/20230303T173250.experiment.stdout │
│ allocs/op │ allocs/op vs base │
Listener-12 1.000 ± 0% 1.000 ± 0% ~ (p=1.000 n=10) ¹
¹ all samples are equal
shortname: k8s_workqueue
pkg: k8s.io/client-go/util/workqueue
│ ./bent-bench/20230303T173250.baseline.stdout │ ./bent-bench/20230303T173250.experiment.stdout │
│ sec/op │ sec/op vs base │
ParallelizeUntil/pieces:1000,workers:10,chunkSize:1-12 244.6µ ± 1% 245.9µ ± 0% +0.55% (p=0.023 n=10)
ParallelizeUntil/pieces:1000,workers:10,chunkSize:10-12 75.09µ ± 1% 63.54µ ± 1% -15.37% (p=0.000 n=10)
ParallelizeUntil/pieces:1000,workers:10,chunkSize:100-12 49.47µ ± 2% 42.45µ ± 2% -14.19% (p=0.000 n=10)
ParallelizeUntil/pieces:999,workers:10,chunkSize:13-12 68.51µ ± 1% 55.07µ ± 1% -19.63% (p=0.000 n=10)
geomean 88.82µ 77.74µ -12.47%
shortname: kanzi
pkg: github.com/flanglet/kanzi-go/benchmark
│ ./bent-bench/20230303T173250.baseline.stdout │ ./bent-bench/20230303T173250.experiment.stdout │
│ sec/op │ sec/op vs base │
BWTS-12 0.4479n ± 6% 0.4385n ± 7% ~ (p=0.529 n=10)
FPAQ-12 17.03m ± 3% 17.42m ± 3% ~ (p=0.123 n=10)
LZ-12 1.897m ± 2% 1.887m ± 4% ~ (p=1.000 n=10)
MTFT-12 771.2µ ± 4% 785.8µ ± 3% ~ (p=0.247 n=10)
geomean 57.79µ 58.01µ +0.38%
shortname: minio
pkg: github.com/minio/minio/cmd
│ ./bent-bench/20230303T173250.baseline.stdout │ ./bent-bench/20230303T173250.experiment.stdout │
│ sec/op │ sec/op vs base │
DecodehealingTracker-12 852.8n ± 5% 866.8n ± 5% ~ (p=0.190 n=10)
AppendMsgReplicateDecision-12 0.5383n ± 4% 0.7598n ± 3% +41.13% (p=0.000 n=10)
AppendMsgResyncTargetsInfo-12 4.785n ± 2% 4.639n ± 3% -3.06% (p=0.003 n=10)
DataUpdateTracker-12 3.122µ ± 2% 1.880µ ± 3% -39.77% (p=0.000 n=10)
MarshalMsgdataUsageCacheInfo-12 110.9n ± 2% 109.4n ± 3% ~ (p=0.101 n=10)
geomean 59.74n 57.50n -3.75%
│ ./bent-bench/20230303T173250.baseline.stdout │ ./bent-bench/20230303T173250.experiment.stdout │
│ B/s │ B/s vs base │
DecodehealingTracker-12 347.8Mi ± 5% 342.2Mi ± 6% ~ (p=0.190 n=10)
AppendMsgReplicateDecision-12 1.730Gi ± 3% 1.226Gi ± 3% -29.14% (p=0.000 n=10)
AppendMsgResyncTargetsInfo-12 1.946Gi ± 2% 2.008Gi ± 3% +3.15% (p=0.003 n=10)
DataUpdateTracker-12 312.5Ki ± 3% 517.6Ki ± 2% +65.62% (p=0.000 n=10)
geomean 139.1Mi 145.4Mi +4.47%
│ ./bent-bench/20230303T173250.baseline.stdout │ ./bent-bench/20230303T173250.experiment.stdout │
│ B/op │ B/op vs base │
DecodehealingTracker-12 0.000 ± 0% 0.000 ± 0% ~ (p=1.000 n=10) ¹
AppendMsgReplicateDecision-12 0.000 ± 0% 0.000 ± 0% ~ (p=1.000 n=10) ¹
AppendMsgResyncTargetsInfo-12 0.000 ± 0% 0.000 ± 0% ~ (p=1.000 n=10) ¹
DataUpdateTracker-12 340.0 ± 0% 339.0 ± 1% ~ (p=0.737 n=10)
MarshalMsgdataUsageCacheInfo-12 96.00 ± 0% 96.00 ± 0% ~ (p=1.000 n=10) ¹
geomean ² -0.06% ²
¹ all samples are equal
² summaries must be >0 to compute geomean
│ ./bent-bench/20230303T173250.baseline.stdout │ ./bent-bench/20230303T173250.experiment.stdout │
│ allocs/op │ allocs/op vs base │
DecodehealingTracker-12 0.000 ± 0% 0.000 ± 0% ~ (p=1.000 n=10) ¹
AppendMsgReplicateDecision-12 0.000 ± 0% 0.000 ± 0% ~ (p=1.000 n=10) ¹
AppendMsgResyncTargetsInfo-12 0.000 ± 0% 0.000 ± 0% ~ (p=1.000 n=10) ¹
DataUpdateTracker-12 9.000 ± 0% 9.000 ± 0% ~ (p=1.000 n=10) ¹
MarshalMsgdataUsageCacheInfo-12 1.000 ± 0% 1.000 ± 0% ~ (p=1.000 n=10) ¹
geomean ² +0.00% ²
¹ all samples are equal
² summaries must be >0 to compute geomean
shortname: semver
pkg: github.com/Masterminds/semver
│ ./bent-bench/20230303T173250.baseline.stdout │ ./bent-bench/20230303T173250.experiment.stdout │
│ sec/op │ sec/op vs base │
ValidateVersionTildeFail-12 854.7n ± 2% 842.7n ± 2% ~ (p=0.123 n=10)
shortname: shopify_sarama
pkg: github.com/Shopify/sarama
│ ./bent-bench/20230303T173250.baseline.stdout │ ./bent-bench/20230303T173250.experiment.stdout │
│ sec/op │ sec/op vs base │
Broker_Open-12 212.2µ ± 1% 205.9µ ± 2% -2.95% (p=0.000 n=10)
Broker_No_Metrics_Open-12 132.9µ ± 1% 121.3µ ± 2% -8.68% (p=0.000 n=10)
geomean 167.9µ 158.1µ -5.86%
shortname: spexs2
pkg: github.com/egonelbre/spexs2/_benchmark
│ ./bent-bench/20230303T173250.baseline.stdout │ ./bent-bench/20230303T173250.experiment.stdout │
│ sec/op │ sec/op vs base │
Run/10k/1-12 23.29 ± 1% 23.11 ± 2% ~ (p=0.315 n=10)
Run/10k/16-12 5.648 ± 2% 5.462 ± 4% -3.30% (p=0.004 n=10)
geomean 11.47 11.23 -2.06%
shortname: sweet-biogo-igor
goos:
goarch:
pkg:
cpu:
│ ./sweet/results/biogo-igor/baseline.results │ ./sweet/results/biogo-igor/experiment.results │
│ sec/op │ sec/op vs base │
BiogoIgor 13.53 ± 1% 13.62 ± 1% ~ (p=0.165 n=10)
│ ./sweet/results/biogo-igor/baseline.results │ ./sweet/results/biogo-igor/experiment.results │
│ average-RSS-bytes │ average-RSS-bytes vs base │
BiogoIgor 62.19Mi ± 3% 62.86Mi ± 1% ~ (p=0.247 n=10)
│ ./sweet/results/biogo-igor/baseline.results │ ./sweet/results/biogo-igor/experiment.results │
│ peak-RSS-bytes │ peak-RSS-bytes vs base │
BiogoIgor 89.57Mi ± 4% 89.03Mi ± 3% ~ (p=0.516 n=10)
│ ./sweet/results/biogo-igor/baseline.results │ ./sweet/results/biogo-igor/experiment.results │
│ peak-VM-bytes │ peak-VM-bytes vs base │
BiogoIgor 766.4Mi ± 0% 766.4Mi ± 0% ~ (p=0.954 n=10)
shortname: sweet-biogo-krishna
│ ./sweet/results/biogo-krishna/baseline.results │ ./sweet/results/biogo-krishna/experiment.results │
│ sec/op │ sec/op vs base │
BiogoKrishna 12.70 ± 2% 12.09 ± 3% -4.86% (p=0.000 n=10)
│ ./sweet/results/biogo-krishna/baseline.results │ ./sweet/results/biogo-krishna/experiment.results │
│ average-RSS-bytes │ average-RSS-bytes vs base │
BiogoKrishna 4.085Gi ± 0% 4.083Gi ± 0% ~ (p=0.105 n=10)
│ ./sweet/results/biogo-krishna/baseline.results │ ./sweet/results/biogo-krishna/experiment.results │
│ peak-RSS-bytes │ peak-RSS-bytes vs base │
BiogoKrishna 4.174Gi ± 0% 4.173Gi ± 0% ~ (p=0.853 n=10)
│ ./sweet/results/biogo-krishna/baseline.results │ ./sweet/results/biogo-krishna/experiment.results │
│ peak-VM-bytes │ peak-VM-bytes vs base │
BiogoKrishna 4.877Gi ± 0% 4.877Gi ± 0% ~ (p=0.591 n=10)
shortname: sweet-bleve-index
│ ./sweet/results/bleve-index/baseline.results │ ./sweet/results/bleve-index/experiment.results │
│ sec/op │ sec/op vs base │
BleveIndexBatch100 4.675 ± 1% 4.669 ± 1% ~ (p=0.739 n=10)
│ ./sweet/results/bleve-index/baseline.results │ ./sweet/results/bleve-index/experiment.results │
│ average-RSS-bytes │ average-RSS-bytes vs base │
BleveIndexBatch100 185.5Mi ± 1% 185.9Mi ± 1% ~ (p=0.796 n=10)
│ ./sweet/results/bleve-index/baseline.results │ ./sweet/results/bleve-index/experiment.results │
│ peak-RSS-bytes │ peak-RSS-bytes vs base │
BleveIndexBatch100 267.5Mi ± 6% 265.0Mi ± 2% ~ (p=0.739 n=10)
│ ./sweet/results/bleve-index/baseline.results │ ./sweet/results/bleve-index/experiment.results │
│ peak-VM-bytes │ peak-VM-bytes vs base │
BleveIndexBatch100 1.945Gi ± 4% 1.945Gi ± 0% ~ (p=0.725 n=10)
shortname: sweet-go-build
│ ./sweet/results/go-build/baseline.results │ ./sweet/results/go-build/experiment.results │
│ sec/op │ sec/op vs base │
GoBuildKubelet 51.32 ± 0% 51.38 ± 3% ~ (p=0.105 n=10)
GoBuildKubeletLink 7.669 ± 1% 7.663 ± 2% ~ (p=0.579 n=10)
GoBuildIstioctl 46.02 ± 0% 46.07 ± 0% ~ (p=0.739 n=10)
GoBuildIstioctlLink 8.174 ± 1% 8.143 ± 2% ~ (p=0.436 n=10)
GoBuildFrontend 16.17 ± 1% 16.10 ± 1% ~ (p=0.143 n=10)
GoBuildFrontendLink 1.399 ± 3% 1.377 ± 3% ~ (p=0.218 n=10)
geomean 12.23 12.18 -0.39%
shortname: sweet-gopher-lua
│ ./sweet/results/gopher-lua/baseline.results │ ./sweet/results/gopher-lua/experiment.results │
│ sec/op │ sec/op vs base │
GopherLuaKNucleotide 22.71 ± 1% 22.86 ± 1% ~ (p=0.218 n=10)
│ ./sweet/results/gopher-lua/baseline.results │ ./sweet/results/gopher-lua/experiment.results │
│ average-RSS-bytes │ average-RSS-bytes vs base │
GopherLuaKNucleotide 36.64Mi ± 2% 36.40Mi ± 1% ~ (p=0.631 n=10)
│ ./sweet/results/gopher-lua/baseline.results │ ./sweet/results/gopher-lua/experiment.results │
│ peak-RSS-bytes │ peak-RSS-bytes vs base │
GopherLuaKNucleotide 43.28Mi ± 5% 41.55Mi ± 7% ~ (p=0.089 n=10)
│ ./sweet/results/gopher-lua/baseline.results │ ./sweet/results/gopher-lua/experiment.results │
│ peak-VM-bytes │ peak-VM-bytes vs base │
GopherLuaKNucleotide 699.6Mi ± 0% 699.9Mi ± 0% +0.04% (p=0.006 n=10)
shortname: sweet-markdown
│ ./sweet/results/markdown/baseline.results │ ./sweet/results/markdown/experiment.results │
│ sec/op │ sec/op vs base │
MarkdownRenderXHTML 260.6m ± 4% 256.4m ± 4% ~ (p=0.796 n=10)
│ ./sweet/results/markdown/baseline.results │ ./sweet/results/markdown/experiment.results │
│ average-RSS-bytes │ average-RSS-bytes vs base │
MarkdownRenderXHTML 20.47Mi ± 1% 20.71Mi ± 2% ~ (p=0.393 n=10)
│ ./sweet/results/markdown/baseline.results │ ./sweet/results/markdown/experiment.results │
│ peak-RSS-bytes │ peak-RSS-bytes vs base │
MarkdownRenderXHTML 20.88Mi ± 11% 21.73Mi ± 6% ~ (p=0.470 n=10)
│ ./sweet/results/markdown/baseline.results │ ./sweet/results/markdown/experiment.results │
│ peak-VM-bytes │ peak-VM-bytes vs base │
MarkdownRenderXHTML 699.2Mi ± 0% 699.3Mi ± 0% ~ (p=0.464 n=10)
shortname: sweet-tile38
│ ./sweet/results/tile38/baseline.results │ ./sweet/results/tile38/experiment.results │
│ sec/op │ sec/op vs base │
Tile38WithinCircle100kmRequest 529.1µ ± 1% 530.3µ ± 1% ~ (p=0.143 n=10)
Tile38IntersectsCircle100kmRequest 629.6µ ± 1% 630.8µ ± 1% ~ (p=0.971 n=10)
Tile38KNearestLimit100Request 446.4µ ± 1% 453.7µ ± 1% +1.62% (p=0.000 n=10)
geomean 529.8µ 533.4µ +0.67%
│ ./sweet/results/tile38/baseline.results │ ./sweet/results/tile38/experiment.results │
│ average-RSS-bytes │ average-RSS-bytes vs base │
Tile38WithinCircle100kmRequest 5.054Gi ± 1% 5.057Gi ± 1% ~ (p=0.796 n=10)
Tile38IntersectsCircle100kmRequest 5.381Gi ± 0% 5.431Gi ± 1% +0.94% (p=0.019 n=10)
Tile38KNearestLimit100Request 6.801Gi ± 0% 6.802Gi ± 0% ~ (p=0.684 n=10)
geomean 5.697Gi 5.717Gi +0.34%
│ ./sweet/results/tile38/baseline.results │ ./sweet/results/tile38/experiment.results │
│ peak-RSS-bytes │ peak-RSS-bytes vs base │
Tile38WithinCircle100kmRequest 5.380Gi ± 1% 5.381Gi ± 1% ~ (p=0.912 n=10)
Tile38IntersectsCircle100kmRequest 5.669Gi ± 1% 5.756Gi ± 1% +1.53% (p=0.019 n=10)
Tile38KNearestLimit100Request 7.013Gi ± 0% 7.011Gi ± 0% ~ (p=0.796 n=10)
geomean 5.980Gi 6.010Gi +0.50%
│ ./sweet/results/tile38/baseline.results │ ./sweet/results/tile38/experiment.results │
│ peak-VM-bytes │ peak-VM-bytes vs base │
Tile38WithinCircle100kmRequest 6.047Gi ± 1% 6.047Gi ± 1% ~ (p=0.725 n=10)
Tile38IntersectsCircle100kmRequest 6.305Gi ± 1% 6.402Gi ± 2% +1.53% (p=0.035 n=10)
Tile38KNearestLimit100Request 7.685Gi ± 0% 7.685Gi ± 0% ~ (p=0.955 n=10)
geomean 6.642Gi 6.676Gi +0.51%
│ ./sweet/results/tile38/baseline.results │ ./sweet/results/tile38/experiment.results │
│ p50-latency-sec │ p50-latency-sec vs base │
Tile38WithinCircle100kmRequest 88.81µ ± 1% 89.36µ ± 1% +0.61% (p=0.043 n=10)
Tile38IntersectsCircle100kmRequest 151.5µ ± 1% 152.0µ ± 1% ~ (p=0.089 n=10)
Tile38KNearestLimit100Request 259.0µ ± 0% 259.1µ ± 0% ~ (p=0.853 n=10)
geomean 151.6µ 152.1µ +0.33%
│ ./sweet/results/tile38/baseline.results │ ./sweet/results/tile38/experiment.results │
│ p90-latency-sec │ p90-latency-sec vs base │
Tile38WithinCircle100kmRequest 712.5µ ± 0% 713.9µ ± 1% ~ (p=0.190 n=10)
Tile38IntersectsCircle100kmRequest 960.6µ ± 1% 958.2µ ± 1% ~ (p=0.739 n=10)
Tile38KNearestLimit100Request 1.007m ± 1% 1.032m ± 1% +2.50% (p=0.000 n=10)
geomean 883.4µ 890.5µ +0.80%
│ ./sweet/results/tile38/baseline.results │ ./sweet/results/tile38/experiment.results │
│ p99-latency-sec │ p99-latency-sec vs base │
Tile38WithinCircle100kmRequest 7.061m ± 1% 7.085m ± 1% ~ (p=0.481 n=10)
Tile38IntersectsCircle100kmRequest 7.228m ± 1% 7.187m ± 1% ~ (p=0.143 n=10)
Tile38KNearestLimit100Request 2.085m ± 0% 2.131m ± 1% +2.22% (p=0.000 n=10)
geomean 4.738m 4.770m +0.66%
│ ./sweet/results/tile38/baseline.results │ ./sweet/results/tile38/experiment.results │
│ ops/s │ ops/s vs base │
Tile38WithinCircle100kmRequest 17.01k ± 1% 16.97k ± 1% ~ (p=0.143 n=10)
Tile38IntersectsCircle100kmRequest 14.29k ± 1% 14.27k ± 1% ~ (p=0.988 n=10)
Tile38KNearestLimit100Request 20.16k ± 1% 19.84k ± 1% -1.59% (p=0.000 n=10)
geomean 16.99k 16.87k -0.67%
shortname: uber_tally
goos: linux
goarch: amd64
pkg: github.com/uber-go/tally
cpu: Intel(R) Xeon(R) W-2135 CPU @ 3.70GHz
│ ./bent-bench/20230303T173250.baseline.stdout │ ./bent-bench/20230303T173250.experiment.stdout │
│ sec/op │ sec/op vs base │
ScopeTaggedNoCachedSubscopes-12 2.867µ ± 4% 2.921µ ± 4% ~ (p=0.579 n=10)
HistogramAllocation-12 1.519µ ± 3% 1.507µ ± 7% ~ (p=0.631 n=10)
geomean 2.087µ 2.098µ +0.53%
│ ./bent-bench/20230303T173250.baseline.stdout │ ./bent-bench/20230303T173250.experiment.stdout │
│ B/op │ B/op vs base │
HistogramAllocation-12 1.124Ki ± 1% 1.125Ki ± 4% ~ (p=0.271 n=10)
│ ./bent-bench/20230303T173250.baseline.stdout │ ./bent-bench/20230303T173250.experiment.stdout │
│ allocs/op │ allocs/op vs base │
HistogramAllocation-12 20.00 ± 0% 20.00 ± 0% ~ (p=1.000 n=10) ¹
¹ all samples are equal
shortname: uber_zap
pkg: go.uber.org/zap/zapcore
│ ./bent-bench/20230303T173250.baseline.stdout │ ./bent-bench/20230303T173250.experiment.stdout │
│ sec/op │ sec/op vs base │
BufferedWriteSyncer/write_file_with_buffer-12 296.1n ± 12% 205.9n ± 10% -30.46% (p=0.000 n=10)
MultiWriteSyncer/2_discarder-12 7.528n ± 4% 7.014n ± 2% -6.83% (p=0.000 n=10)
MultiWriteSyncer/4_discarder-12 9.065n ± 1% 8.908n ± 1% -1.73% (p=0.002 n=10)
MultiWriteSyncer/4_discarder_with_buffer-12 225.2n ± 2% 147.6n ± 2% -34.48% (p=0.000 n=10)
WriteSyncer/write_file_with_no_buffer-12 4.785µ ± 1% 4.933µ ± 3% +3.08% (p=0.001 n=10)
ZapConsole-12 702.5n ± 1% 649.1n ± 1% -7.62% (p=0.000 n=10)
JSONLogMarshalerFunc-12 1.219µ ± 2% 1.226µ ± 3% ~ (p=0.781 n=10)
ZapJSON-12 555.4n ± 1% 480.9n ± 3% -13.40% (p=0.000 n=10)
StandardJSON-12 814.1n ± 1% 809.0n ± 0% ~ (p=0.101 n=10)
Sampler_Check/7_keys-12 10.55n ± 2% 10.61n ± 1% ~ (p=0.594 n=10)
Sampler_Check/50_keys-12 11.01n ± 0% 10.98n ± 1% ~ (p=0.286 n=10)
Sampler_Check/100_keys-12 10.71n ± 0% 10.71n ± 0% ~ (p=0.563 n=10)
Sampler_CheckWithHook/7_keys-12 20.20n ± 2% 20.42n ± 2% ~ (p=0.446 n=10)
Sampler_CheckWithHook/50_keys-12 20.72n ± 2% 21.02n ± 1% ~ (p=0.078 n=10)
Sampler_CheckWithHook/100_keys-12 20.15n ± 2% 20.68n ± 3% +2.63% (p=0.037 n=10)
TeeCheck-12 140.8n ± 2% 140.5n ± 2% ~ (p=0.754 n=10)
geomean 87.80n 82.39n -6.15%
The only large regression (in ethereum_bitutil's BaseTest2KB) appears to
be spurious, as the test does not involve any goroutines (or
B.RunParallel()), which profiling confirms.
Updates golang/go#18237
Related to golang/go#32113
|
Change https://go.dev/cl/473656 mentions this issue: |
What version of Go are you using (
go version)?go1.7.3
What operating system and processor architecture are you using (
go env)?linux/amd64; Xeon E5-2670 (dual-socket 6-core packages, non-HT)
Our profiles indicate that we're spending an enormous number of cycles in
runtime.findrunnable(and its callees) on the hosts that serve as our protocol heads.Briefly, our these hosts translate HTTP CRUD operations into sets of transactions to be performed on our storage hosts, so the only real I/O these hosts do is networking.
Here's what I see in our cpu profiles when I run a benchmark with 40 clients against a single host backed by 60 storage controllers:
... here's the same benchmark, but this time against two hosts backed by (the same) 60 storage controllers:
Interestingly, the single-head cpu consumption is at 560% of 1200%, and the dual-head cpu consumption is at 470% and 468% of 1200%, respectively.
A couple notable details:
runtime.findrunnablein the single-node case. I'd expect that system to have on average 2x the number of goroutines, but I didn't think more goroutines would cause the proportional amount of time in the scheduler to increase. (I had presumed that more goroutines meant less work-stealing and polling, which would mean proportionally less time doing expensive stuff like syscalls and atomics.)Let me know if there are other details I can provide.
Thanks,
Phil
The text was updated successfully, but these errors were encountered: