Pass "start time" and "commit time" to Profiler callback #12852
Conversation
|
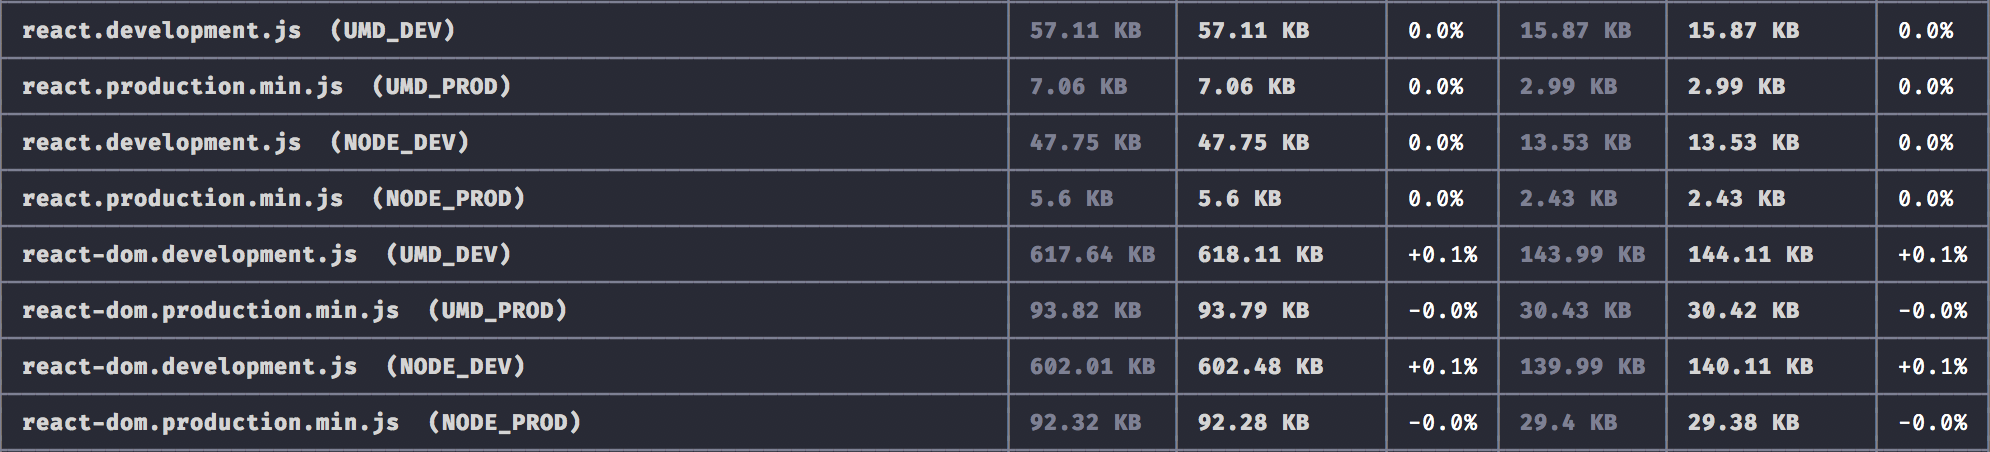
ReactDOM: size: -0.0%, gzip: -0.1% Details of bundled changes.Comparing: 397d611...0c99c4c react-dom
react-art
react-test-renderer
react-reconciler
react-native-renderer
Generated by 🚫 dangerJS |
There was a problem hiding this comment.
Will @gaearon's changes fix the byte size issue? That's a lot of bytes for something that is turned off.
| @@ -420,6 +422,10 @@ export default function<T, P, I, TI, HI, PI, C, CC, CX, PL>( | |||
| } | |||
| } | |||
|
|
|||
| if (enableProfilerTimer) { | |||
| recordCommitTime(); | |||
There was a problem hiding this comment.
This is not the place for it. This is inside a hot loop and gets called thousands of time. This would be a better place: https://github.com/bvaughn/react/blob/7f027607b516d3cb3d58feeb07074813f6f8bfb4/packages/react-reconciler/src/ReactFiberScheduler.js#L632 That way we also ensure that the render time doesn't overlap with the commit time frame.
There was a problem hiding this comment.
Ah, yeah. This was pretty dumb. Thanks for the pointer.
I built mater locally, then rebased and built this branch. Ran 14c14
< var aa = require("fbjs/lib/invariant"),
---
> var ba = require("fbjs/lib/invariant"),
32c32
< aa(
---
> ba(
1998c1998,2002
< (d.stateNode = { duration: 0, startTime: 0 }),
---
> (d.stateNode = {
> elapsedPauseTimeAtStart: 0,
> duration: 0,
> startTime: 0
> }),
2079a2084,2087
> getCommitTime: function() {
> return 0;
> },
> recordCommitTime: function() {},
2945c2953
< ba = e.enterHydrationState,
---
> aa = e.enterHydrationState,
3045c3053
< (null === a || null === a.child) && d.hydrate && ba(b)
---
> (null === a || null === a.child) && d.hydrate && aa(b)
4130c4138
< ? aa(
---
> ? ba(
4486,4493c4494,4501
< ba = Cf(),
< D = yf(a, ba),
< y = Af(ba);
< ba = Bf(ba, a.isPrimaryRenderer);
< var gb = We(Y),
< Pb = zf(a),
< Qb = rf(a, D, y, ba, Pb, l, k, gb, r).beginWork,
< Nc = sf(a, D, y, ba, Pb, gb).completeWork;
---
> aa = Cf(),
> D = yf(a, aa),
> y = Af(aa),
> gb = Bf(aa, a.isPrimaryRenderer);
> aa = We(Y);
> var Pb = zf(a),
> Qb = rf(a, D, y, gb, Pb, l, k, aa, r).beginWork,
> Nc = sf(a, D, y, gb, Pb, aa).completeWork;
4498c4506
< ba,
---
> gb,
4505c4513
< gb,
---
> aa,
4516c4524
< a = vf(a, g, l, k, d, r);
---
> a = vf(a, g, l, k, d, r, aa); |
7f02760 to
974ee00
Compare
|
Looking at this, I realize that I could wrap the entire After adding this wrapper, the build size is better: And the diff: 14c14
< var aa = require("fbjs/lib/invariant"),
---
> var ba = require("fbjs/lib/invariant"),
32c32
< aa(
---
> ba(
1998d1997
< (d.stateNode = { duration: 0, startTime: 0 }),
2079a2079,2082
> getCommitTime: function() {
> return 0;
> },
> recordCommitTime: function() {},
2945c2948
< ba = e.enterHydrationState,
---
> aa = e.enterHydrationState,
3045c3048
< (null === a || null === a.child) && d.hydrate && ba(b)
---
> (null === a || null === a.child) && d.hydrate && aa(b)
4130c4133
< ? aa(
---
> ? ba(
4486,4493c4489,4496
< ba = Cf(),
< D = yf(a, ba),
< y = Af(ba);
< ba = Bf(ba, a.isPrimaryRenderer);
< var gb = We(Y),
< Pb = zf(a),
< Qb = rf(a, D, y, ba, Pb, l, k, gb, r).beginWork,
< Nc = sf(a, D, y, ba, Pb, gb).completeWork;
---
> aa = Cf(),
> D = yf(a, aa),
> y = Af(aa),
> gb = Bf(aa, a.isPrimaryRenderer);
> aa = We(Y);
> var Pb = zf(a),
> Qb = rf(a, D, y, gb, Pb, l, k, aa, r).beginWork,
> Nc = sf(a, D, y, gb, Pb, aa).completeWork;
4498c4501
< ba,
---
> gb,
4505c4508
< gb,
---
> aa,
4516c4519
< a = vf(a, g, l, k, d, r);
---
> a = vf(a, g, l, k, d, r, aa); |

|
Merged in Dan's Flow refactor from master and did another master vs branch build comparison. Relevant results: DOM renderer production diff: 2826d2825
< (d.stateNode = { duration: 0, startTime: 0 }),DOM renderer development diff: 11822,11825c11822,11828
< fiber.stateNode = {
< duration: 0,
< startTime: 0
< };
---
> if (enableProfilerTimer) {
> fiber.stateNode = {
> elapsedPauseTimeAtStart: 0,
> duration: 0,
> startTime: 0
> };
> }
13280a13284,13296
> var commitTime = 0;
>
> function getCommitTime() {
> return commitTime;
> }
>
> function recordCommitTime() {
> if (!enableProfilerTimer) {
> return;
> }
> commitTime = now();
> }
>
13318c13334,13336
< fiber.stateNode.startTime = now() - totalElapsedPauseTime;
---
> var stateNode = fiber.stateNode;
> stateNode.elapsedPauseTimeAtStart = totalElapsedPauseTime;
> stateNode.startTime = now();
13339,13340c13357,13361
< fiber.stateNode.duration +=
< now() - totalElapsedPauseTime - fiber.stateNode.startTime;
---
> var stateNode = fiber.stateNode;
> stateNode.duration +=
> now() -
> (totalElapsedPauseTime - stateNode.elapsedPauseTimeAtStart) -
> stateNode.startTime;
18373c18394,18396
< finishedWork.treeBaseTime
---
> finishedWork.treeBaseTime,
> finishedWork.stateNode.startTime,
> getCommitTime()
19122a19146,19149
> if (enableProfilerTimer) {
> recordCommitTime();
> }
> |
| duration: 0, | ||
| startTime: 0, | ||
| }; | ||
| if (enableProfilerTimer) { |
There was a problem hiding this comment.
We can shave off a bit by not even initializing stateNode for Profiler unless we're actually going to use it for timing.
Profilercomponent passes additional "start time" and "commit time" parameters toonRendercallback.After discussing this new component type with some teams at FB that might use it, it's become apparent that the addition of these time values would be helpful.
performance.now()within theonRendercallback, but multipleProfilercomponents would end up with slightly different times for a single commit. This explicit time value ensures consistency.Tests have been updated to cover both new parameters.
Caveats
Start time is not the time when the event that triggered a render occurred (e.g. mouse click, Flux update). It is the time when the
Profilerin question started rendering as a result. (This might be significantly later than the event that originated the update. State updates can be async. Other code may execute in between. etc.)Commit time is not necessarily the exact time a user sees e.g. the updated DOM. It is the time when React commits the mutations to the DOM- but other scripts may run before the browser repaints.