Skip to content
New issue

Have a question about this project? Sign up for a free GitHub account to open an issue and contact its maintainers and the community.

By clicking “Sign up for GitHub”, you agree to our terms of service and privacy statement. We’ll occasionally send you account related emails.

Already on GitHub? Sign in to your account

Circular connector charts #5215

Closed
carlosvega opened this issue Oct 28, 2015 · 7 comments
Closed

Circular connector charts #5215

carlosvega opened this issue Oct 28, 2015 · 7 comments
Labels
Feature:New Vis Request for a new visualization type release_note:enhancement Team:Visualizations Visualization editors, elastic-charts and infrastructure

Comments

@carlosvega
Copy link

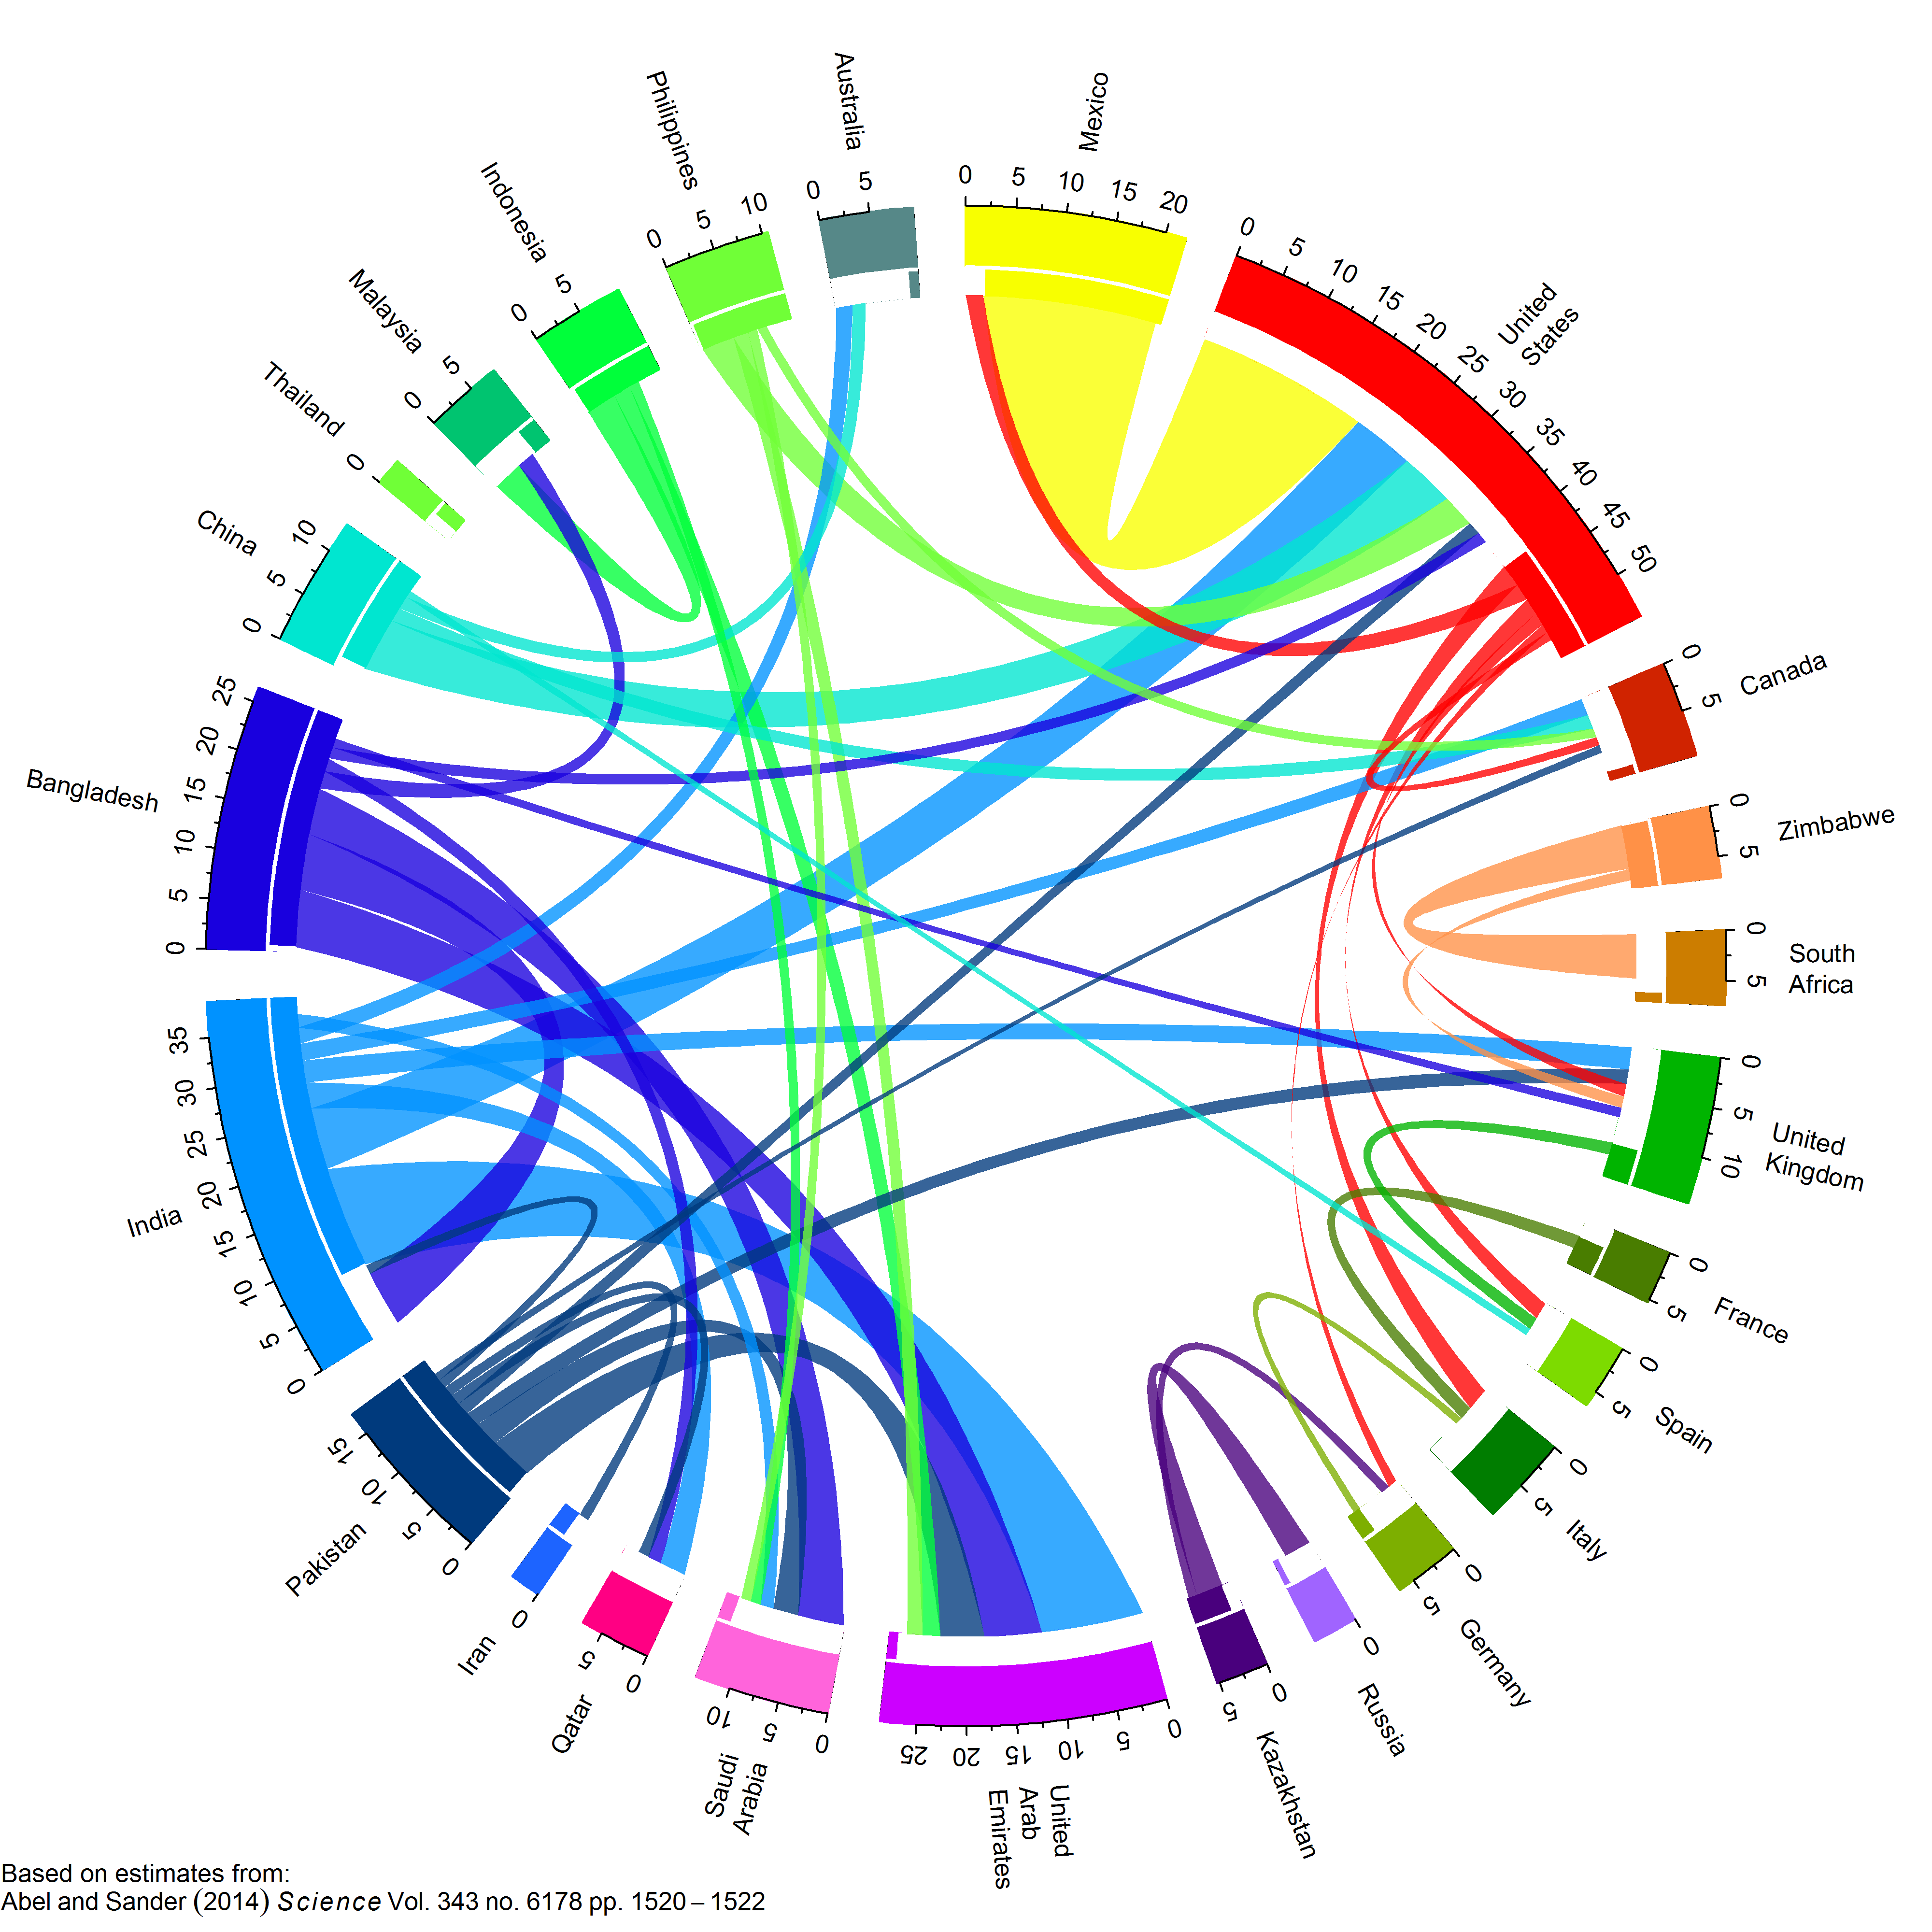
It would be awesome being able to create charts like this one straight from kibana: connector chart
Greetings,

Carlos Vega

@dannymeijer
Copy link

Doesn't this require more graph style data? I am wondering how you would
suggest the data model would look like in Elasticsearch.

On Wed, Oct 28, 2015 at 11:34 AM, Carlos Vega [email protected]
wrote:

It would be awesome being able to create charts like this one straight
from kibana: [image: connector chart]
https://camo.githubusercontent.com/db1e19f5a8001e0fbe8bf084065aaf5f79c1bc1c/687474703a2f2f692e696d6775722e636f6d2f6d6c317a6e374e2e706e67

Greetings,

Carlos Vega


Reply to this email directly or view it on GitHub
#5215.

@carlosvega
Copy link
Author

Simple, you choose two fields: Source and Destination in each document. A line from the source to the Destination. Imagen you store http transactions. Source IP to Server IP. And color based on response code, etc.

@absmith82
Copy link

I agree, this would be a great addition for the netflow/sflow data that I am collecting. even just my firewall logs would be great with this.

@absmith82
Copy link

image
Something like this, maybe a bit cleaner more kibanaish would be awesome

@nyurik
Copy link
Contributor

nyurik commented Feb 1, 2018

@carlosvega @adam-smith-sundance See Vega in Kibana 6.2, or you can already do it with https://github.com/nyurik/kibana-vega-vis

@tylersmalley tylersmalley added the Feature:Visualizations Generic visualization features (in case no more specific feature label is available) label Aug 7, 2018
@tylersmalley
Copy link
Contributor

@elastic/kibana-visualizations to triage

@timroes timroes added the Team:Visualizations Visualization editors, elastic-charts and infrastructure label Sep 16, 2018
@timroes timroes added Feature:New Vis Request for a new visualization type and removed Feature:Visualizations Generic visualization features (in case no more specific feature label is available) labels Oct 27, 2018
@stratoula
Copy link
Contributor

Thank you for contributing to this issue, however, we are closing this issue due to inactivity as part of a backlog grooming effort. If you believe this feature/bug should still be considered, please reopen with a comment.

Sign up for free to join this conversation on GitHub. Already have an account? Sign in to comment
Labels
Feature:New Vis Request for a new visualization type release_note:enhancement Team:Visualizations Visualization editors, elastic-charts and infrastructure
Projects
None yet
Development

No branches or pull requests

8 participants