Use ?prettyCandlePlot for instructions. It gives follwing output:
prettyCandlePlot         package:candlePlotter         R Documentation

Plot OHLC chart

Description:

     Returns ggplot2 object, so there is possibility to extend it
     further.

     Validates input.

Arguments:

time_series: A data frame with c('Time', 'Open', 'High', 'Low',
          'Close') columns where Time column must be of POSIXct type.

chart_title: An optional string with main chart title

under_candles_layers: A vector of ggplot layers to print under candles

See Also:

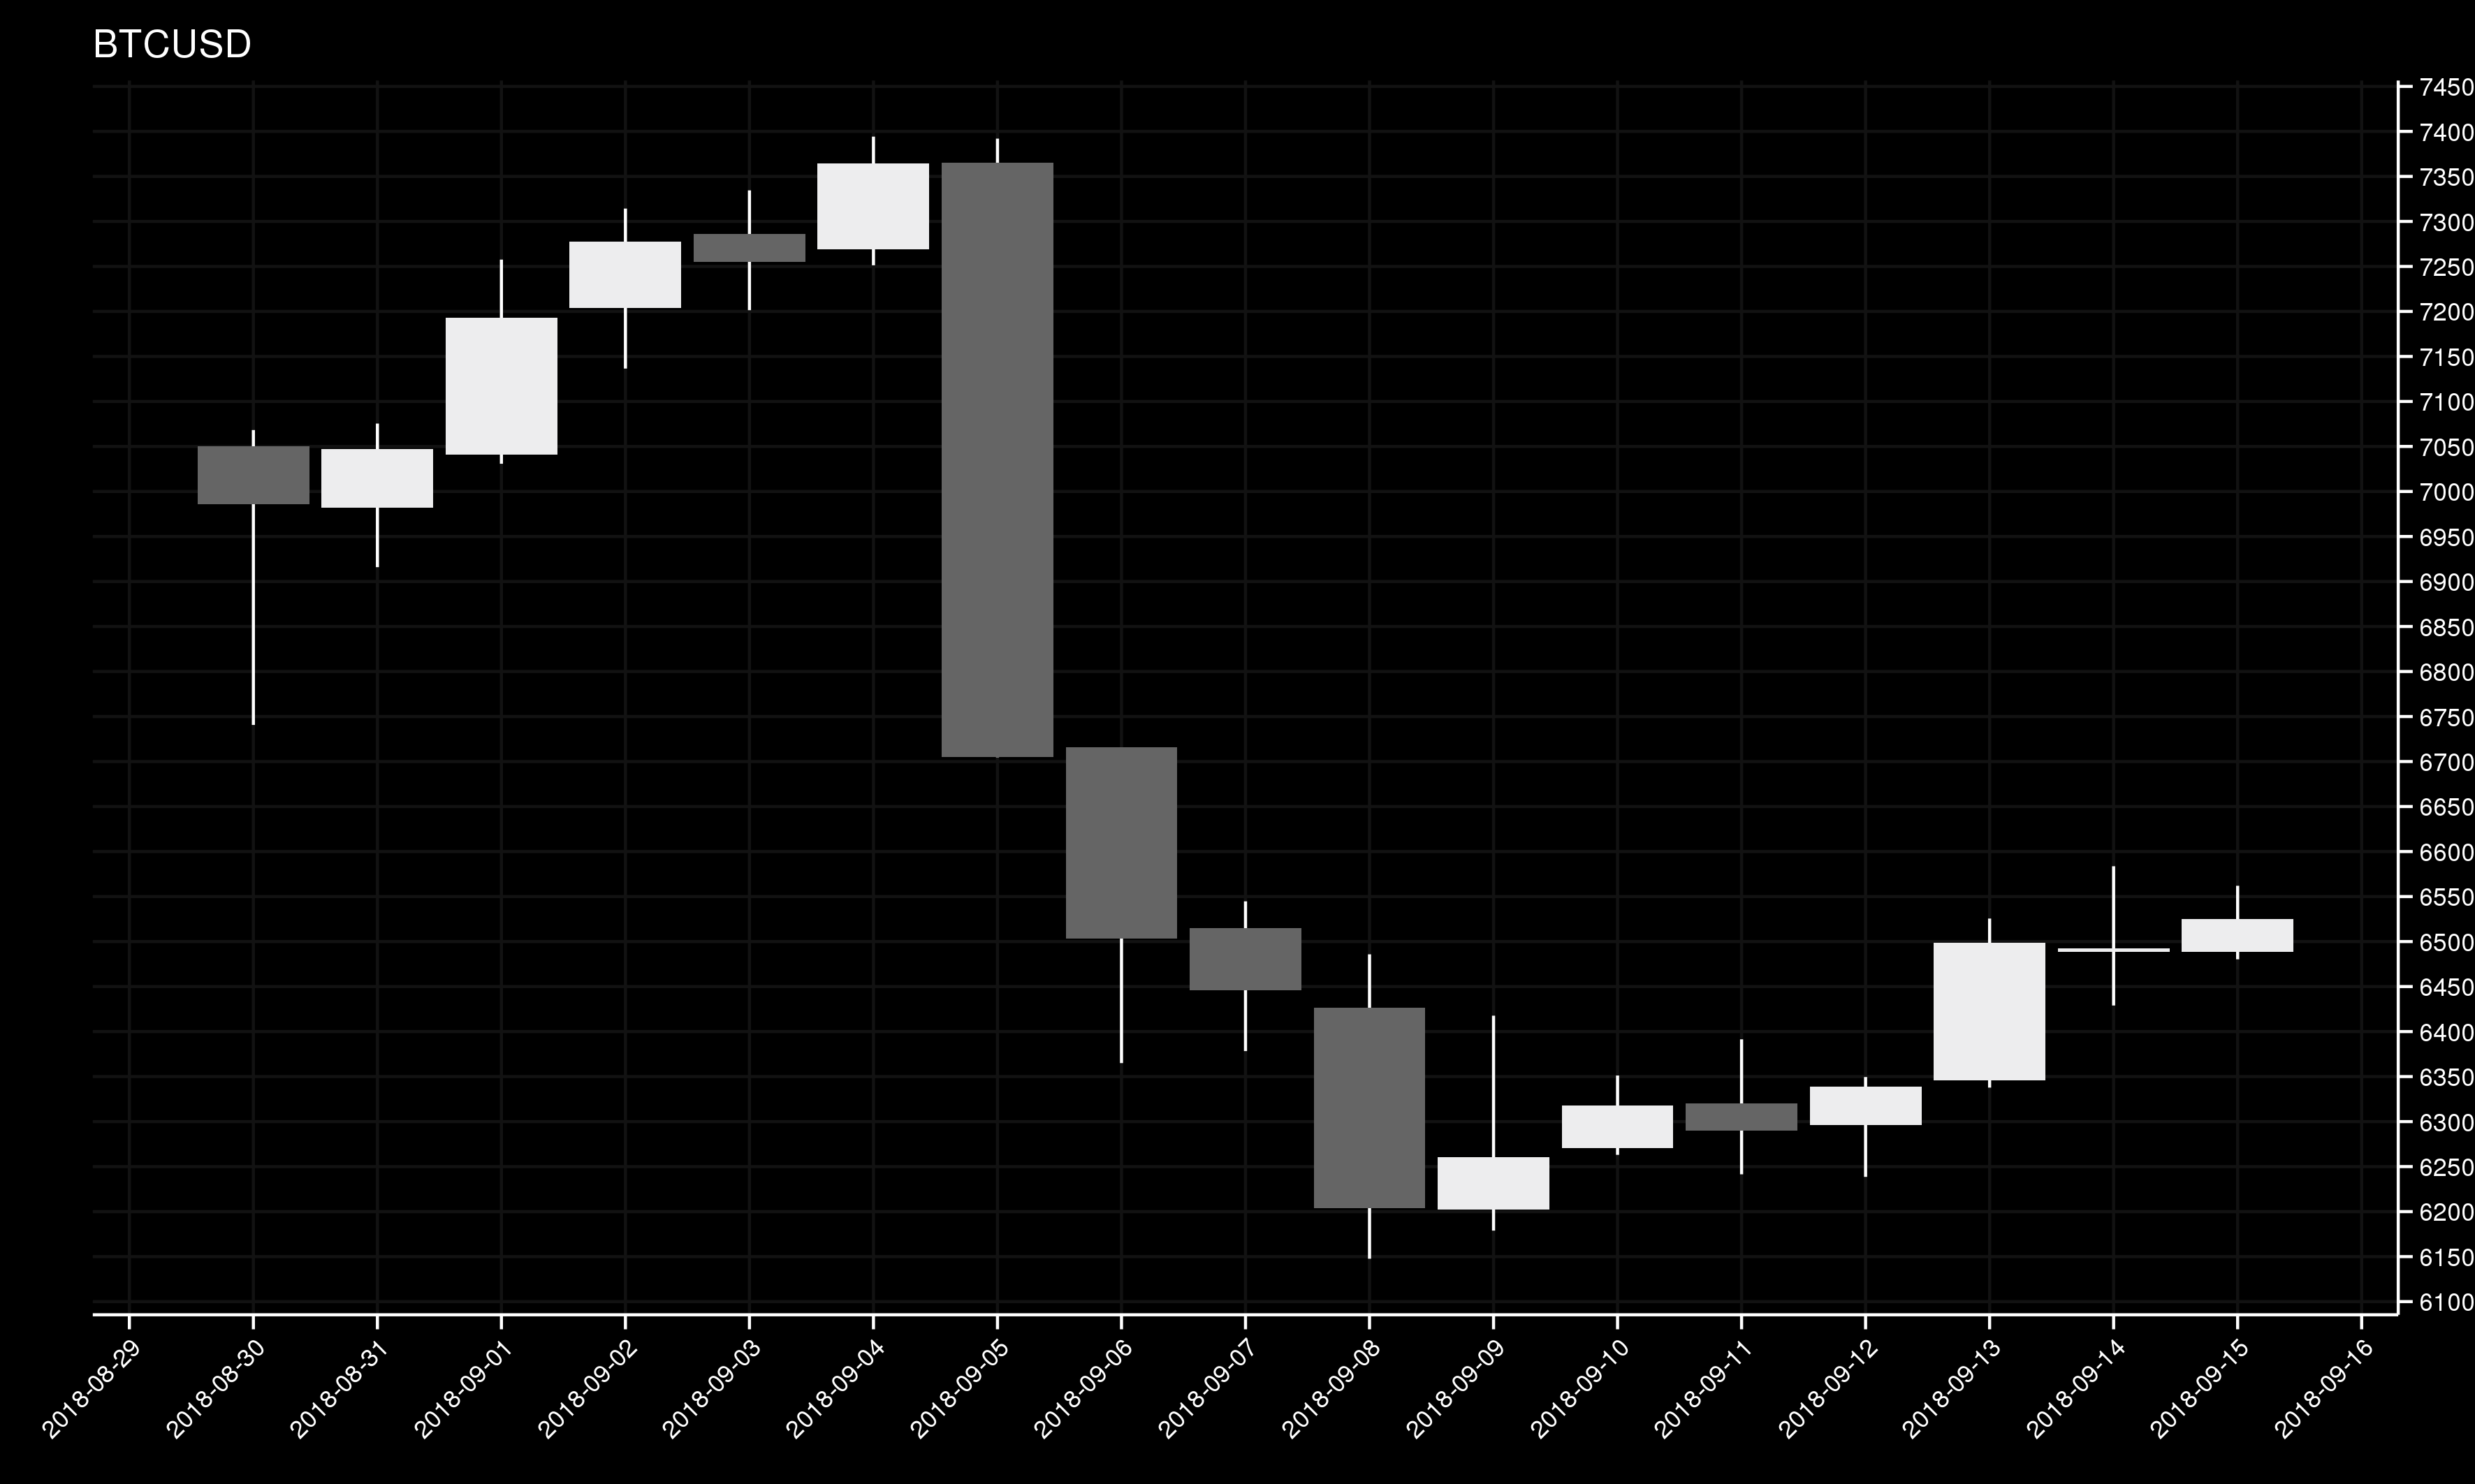
  Chart produced by the first example below:
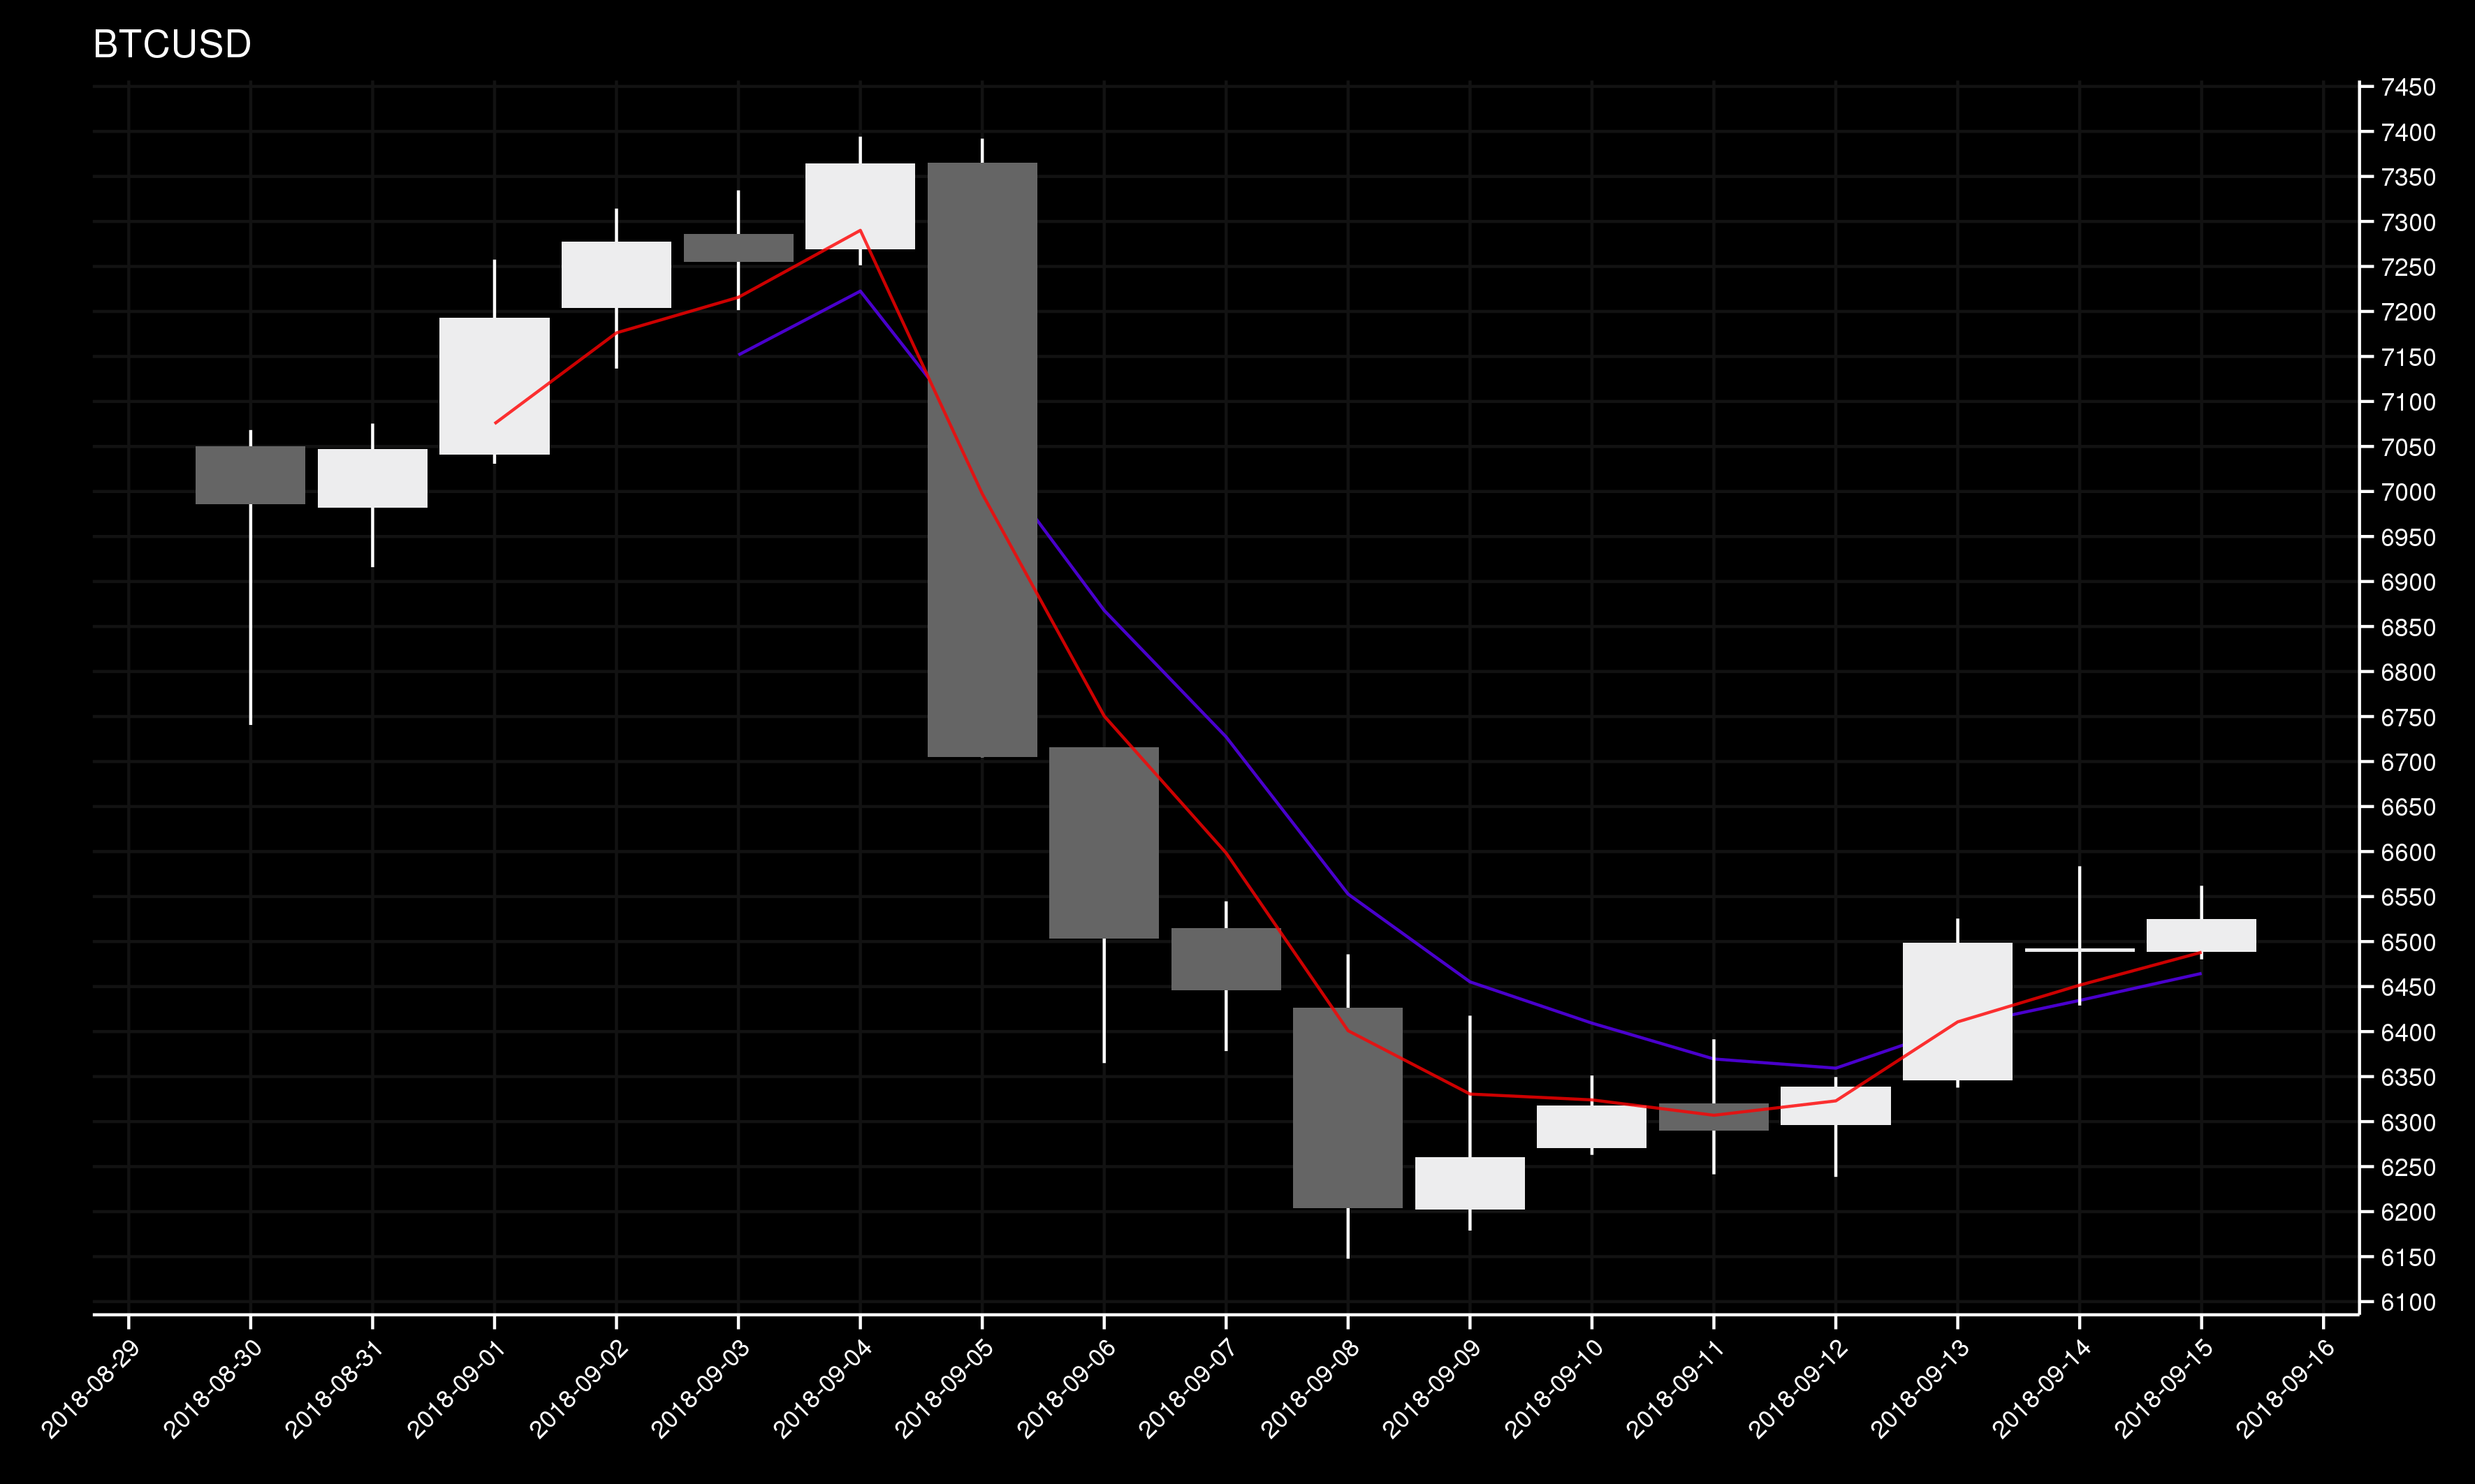
Extended chart produced by the second example below:
Examples:

     # Plotting a chart and saving it from a string:

     raw_data <- "
     Time Open High Low Close
     2018-08-30 7050.267 7068.232 6740.648 6985.976
     2018-08-31 6982.225 7075.417 6915.935 7046.783
     2018-09-01 7040.911 7257.571 7030.790 7193.122
     2018-09-02 7203.630 7314.289 7136.561 7277.199
     2018-09-03 7286.205 7334.481 7201.419 7255.241
     2018-09-04 7269.067 7394.179 7251.269 7364.443
     2018-09-05 7365.232 7391.967 6704.715 6704.715
     2018-09-06 6715.508 6715.508 6365.000 6503.564
     2018-09-07 6514.690 6544.672 6378.351 6446.210
     2018-09-08 6426.220 6485.850 6147.691 6203.588
     2018-09-09 6202.271 6417.675 6178.907 6260.216
     2018-09-10 6270.848 6351.214 6263.048 6317.647
     2018-09-11 6320.536 6391.365 6241.453 6289.961
     2018-09-12 6296.140 6349.481 6238.578 6339.010
     2018-09-13 6345.973 6525.523 6337.746 6498.652
     2018-09-14 6488.631 6583.669 6428.993 6492.367
     2018-09-15 6488.870 6561.979 6480.306 6524.671"
     data_for_chart <- read.table(text = raw_data, header = TRUE)
     data_for_chart <- transform(data_for_chart, Time = as.POSIXct(Time))
     plot <- prettyCandlePlot(data_for_chart, 'BTCUSD')

     ggsave(
       'btc_usd_daily.png',
       plot = plot,
       width = 30,
       height = 18,
       units = 'cm'
     )

     # Extending chart to include red EMA3 in front of candles and purple EMA5 under candles (notice EMA is function from TTR package);

     raw_data <- "
     Time Open High Low Close
     2018-08-30 7050.267 7068.232 6740.648 6985.976
     2018-08-31 6982.225 7075.417 6915.935 7046.783
     2018-09-01 7040.911 7257.571 7030.790 7193.122
     2018-09-02 7203.630 7314.289 7136.561 7277.199
     2018-09-03 7286.205 7334.481 7201.419 7255.241
     2018-09-04 7269.067 7394.179 7251.269 7364.443
     2018-09-05 7365.232 7391.967 6704.715 6704.715
     2018-09-06 6715.508 6715.508 6365.000 6503.564
     2018-09-07 6514.690 6544.672 6378.351 6446.210
     2018-09-08 6426.220 6485.850 6147.691 6203.588
     2018-09-09 6202.271 6417.675 6178.907 6260.216
     2018-09-10 6270.848 6351.214 6263.048 6317.647
     2018-09-11 6320.536 6391.365 6241.453 6289.961
     2018-09-12 6296.140 6349.481 6238.578 6339.010
     2018-09-13 6345.973 6525.523 6337.746 6498.652
     2018-09-14 6488.631 6583.669 6428.993 6492.367
     2018-09-15 6488.870 6561.979 6480.306 6524.671"
     data_for_chart <- read.table(text = raw_data, header = TRUE)
     data_for_chart <- transform(data_for_chart, Time = as.POSIXct(Time))
     data_for_chart$ema_3 <- EMA(data_for_chart$Close, 3)
     data_for_chart$ema_5 <- EMA(data_for_chart$Close, 5)

     under_candles_layers = list(
       layer(
         geom = "line",
         mapping = aes(x = Time, y = ema_5),
         stat = 'identity',
         position = 'identity',
         params = list(color = '#5c00ff', alpha = 0.8)
       )
     )
     plot <- prettyCandlePlot(data_for_chart, 'BTCUSD', under_candles_layers)
     plot <- plot + layer(
         geom = "line",
         mapping = aes(x = Time, y = ema_3),
         stat = 'identity',
         position = 'identity',
         params = list(color = '#ff0000', alpha = 0.8)
       )

     ggsave(
       'btc_usd_daily_with_emas.png',
       plot = plot,
       width = 30,
       height = 18,
       units = 'cm'
     )


