The flood module encompasses the hazard flood and landslides, that are triggered through heavy precipitation events. For now, we are still working on the flood module. But the good news is, that the landslide part is ready to use.
Use the all-in-one function climada_ls_hazard_set
**Example**
Here we create a landslide hazard set for Las Cañas neighborhood in the city San Salvador, Central America. The edge coordinates of Las Cañas neighborhood are [-89.145 -89.1 13.692 13.727]. Copy [hazard, centroids, fig] = climada_ls_hazard_set([-89.145 -89.1 13.692 13.727]); into the command line to create the hazard set.
The hazard maps (figure below) show which areas might be affected by landslides on average every 10 years, 25, 50, 100, 150 and 200 years respectively. Red points denote areas that are very close to a landslide (less than 100 m away), blue points denote areas that are more than 750 m away from a potential landslide.
**Get started**
- Get started reading the landslides manual and the climada manual
- Have a look at the climada wiki
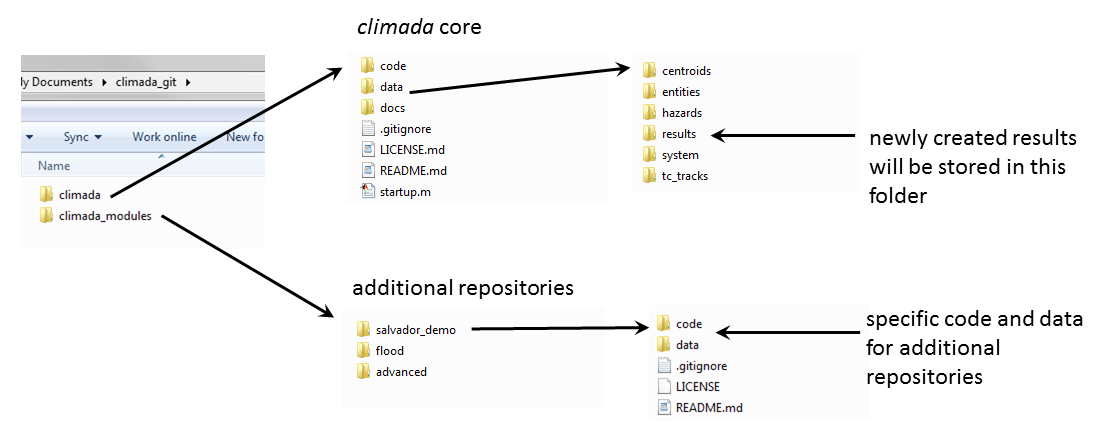
- Download the climada modules, i.e. climada core, climada advanced and flood into the required folder structure (see figure below).

**Maps for Las Cañas, a neighborhood in San Salvador, Central America**
Elevation from SRTM (90 m resolution) for the las canas neighborhood in San Salvador

Slope in degree for the las canas neighborhood in San Salvador

Topographical wetness index (TWI) is calculated using the elevation. TWI ranges from 2 to 12 and indicates the water accumulation potential at every location. The water flows from South to North.

Aspect in degree for the las canas neighborhood in San Salvador

copyright (c) 2015, David N. Bresch, [email protected] all rights reserved.
