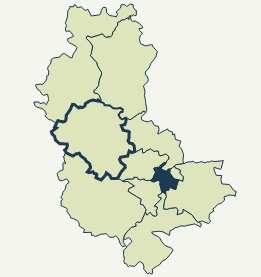
Example: [http://datapublica.github.io/mapNavigator/map_sample_dev.html]
This library can be used to :
- display choropleth maps (maps with color on the zones depending on a value)
- display maps with pie charts on the zones
- display a map with interactivity (call back fonctions on zones) for navigation purposes
| Choropleth | Pie maps | Navigation |
|---|---|---|
 |
 |
 |
Draw the map and data on the zone Format for Zones
zones = [{
    "name" : "Roissy - Sud Picardie",
    "path" : "M 26.828631754183792...",
    "centerX" : 29.537430742676435,
    "centerY" : -630.6423274989843,
    "id" : "0056"
},{...},...];
The format for data depends of the type of graph.
/**
* For choropleth maps, the data format is {"<zoneid>":value,...}
*/
var data = {
    "2208" : 2,
    "2206" : 6,
    "2202" : 7,
    "0056" : 8,
    "2105" : 1,
    "2201" : 3,
    "2204" : 4};

/**
* For pie maps, the data format is {"<zoneid>":[value1,value2,...],...}
*/
var data2 = {
    "2208" : [1, 2, 3],
    "2206" : [3, 2, 1],
    "2202" : [3, 2, 0],
    "0056" : [3, 5, 1]};
highlight a list of zone (zone is an array of id)
unhighlight the highlighted zones
Options/Usage
var map = new MapNavigator('holder',options);
map.draw(zones, data);
options = {
    valueFormatter : function(value) {
        return "" + value + " %";
    },
    highlight : {
        color : "#F00",
        animate : true,
    },
    hover : null, // could be function(value)
    ...
};
| option | default value | comment |
|---|---|---|
| mode | "choropleth" | "choropleth" or pie |
| valueFormatter | function(value) { return "" + value + " %";} |
customize the value display |
| highlight.color | #F00 |
highlight zones on mouse over with a specific border color |
| highlight.animate | true | animate zones on mouse over |
| hover | function(zone) {} |
function call back when mouse hover. |
| value.display | true | Display the value on the map |
| value.tooltip.enabled | false | Display a tooltip for the values (on zone for choropleth and on pie sectors for pie charts) |
| value.tooltip.formater | function(zoneName, label, value, percent) | Tooltip formatter |
| value.tooltip.backgroundColor | white | tooltip background color |
| value.tooltip.x | if set, fix the tooltip on the x-axis (0 = left) | |
| value.tooltip.y | if set, fix the tooltip on the y-axis (0 = bottom) | |
| value.tooltip.font | '11px Arial,Helvetica' | ? |
| value.txt.font | 'bold 12px Arial,Helvetica' | value text on map |
| value.txt.fill | '#AAA' | text color on map |
| area.defaultColor | map area default color | |
| area.backgroundColor | map external background color | |
| area.lineColor | map line color | |
| area.label | true | display the label on the map txt : { font : '12px Arial,Helvetica', fill : '#AAA' }, padding : 5 // i |
| area.labelDraggable | true | can reposition label on map |
| area.onclick | function(zone, holder) | callback fonction when clicking on map (the 2nd arg is the given holder when instanciating MapNavigator object) |
| area.canclick | function(zone) | if we can click on a zone |
| area.txt.font | '12px Arial,Helvetica', | font of the area label |
| area.txt.fill | '#AAA' | color of area label |
| title.value | "Map" | title of the map |
| title.txt.font | '12px Arial,Helvetica', | font of the title |
| title.txt.fill | '#AAA' | color of title |
| pie.radiusRatio | 1 | In "pie" mode, this will enlarge the pies by the given ratio |
| legend.display | true | activates the legend |
| series | { n:4 , colorA:"white", colorB:"blue" } |
{ n:4 , colorA:"white", colorB:"blue" } : on choropleth will automatically compute categories on data: split the data in 2 and define the gradient color { values: [{min:, max:, text: ,color:},...]} : user defined categories on choropleth { values:[{text:"xxx",color:""},...]: user defined colors for pie sectors (the order of the array is the same as the order of data) { useGradient: true, colorA:"white", colorB:"blue" } : on choropleth will create a full gradient of the data instead of splitting into categories |
| exporting.enabled | true | to export as image |
| exporting.url | 'http://exporting.data-publica.com/' | path of the exporting server |
| exporting.icon | SVG path of the exporting icon |